
More administrators than physicians
This chart nails a big problem: more healthcare admins than doctors. The people doing the work are now outnumbered by...

AI integrations on Google Spreadsheets
Google just dropped a bomb inside Sheets: an =AI() formula that lets you type plain-English prompts instead of formulas. You...

Top 40 professions that will be most impacted by AI
This chart lists the top 40 jobs most likely to be taken over by AI. At the top? Interpreters, translators,...

What people think a $1M/year consulting business looks like
Everyone thinks a $1M business means 200 clients paying $5K each. Easy math, right? Wrong. In reality, most agencies or...

“Maintaining Your Tesla” one-pager
This Tesla maintenance poster is genius. In one clean visual, it shows that owning a Tesla means less hassle. No...

“Do not mistake motion for progress”
Julie Zhuo shared a great reminder from her days at Meta: a poster of a rocking horse that said, “Do...

How publishers are using AI
Publishers aren’t just playing with AI anymore. They’re using it—mostly for the stuff that saves time and makes brains work...
Media is going to be more “winner-takes-all” as time goes on
Naval Ravikant nailed it: in an AI-saturated world, no one wants average. When anyone can churn out decent content with...
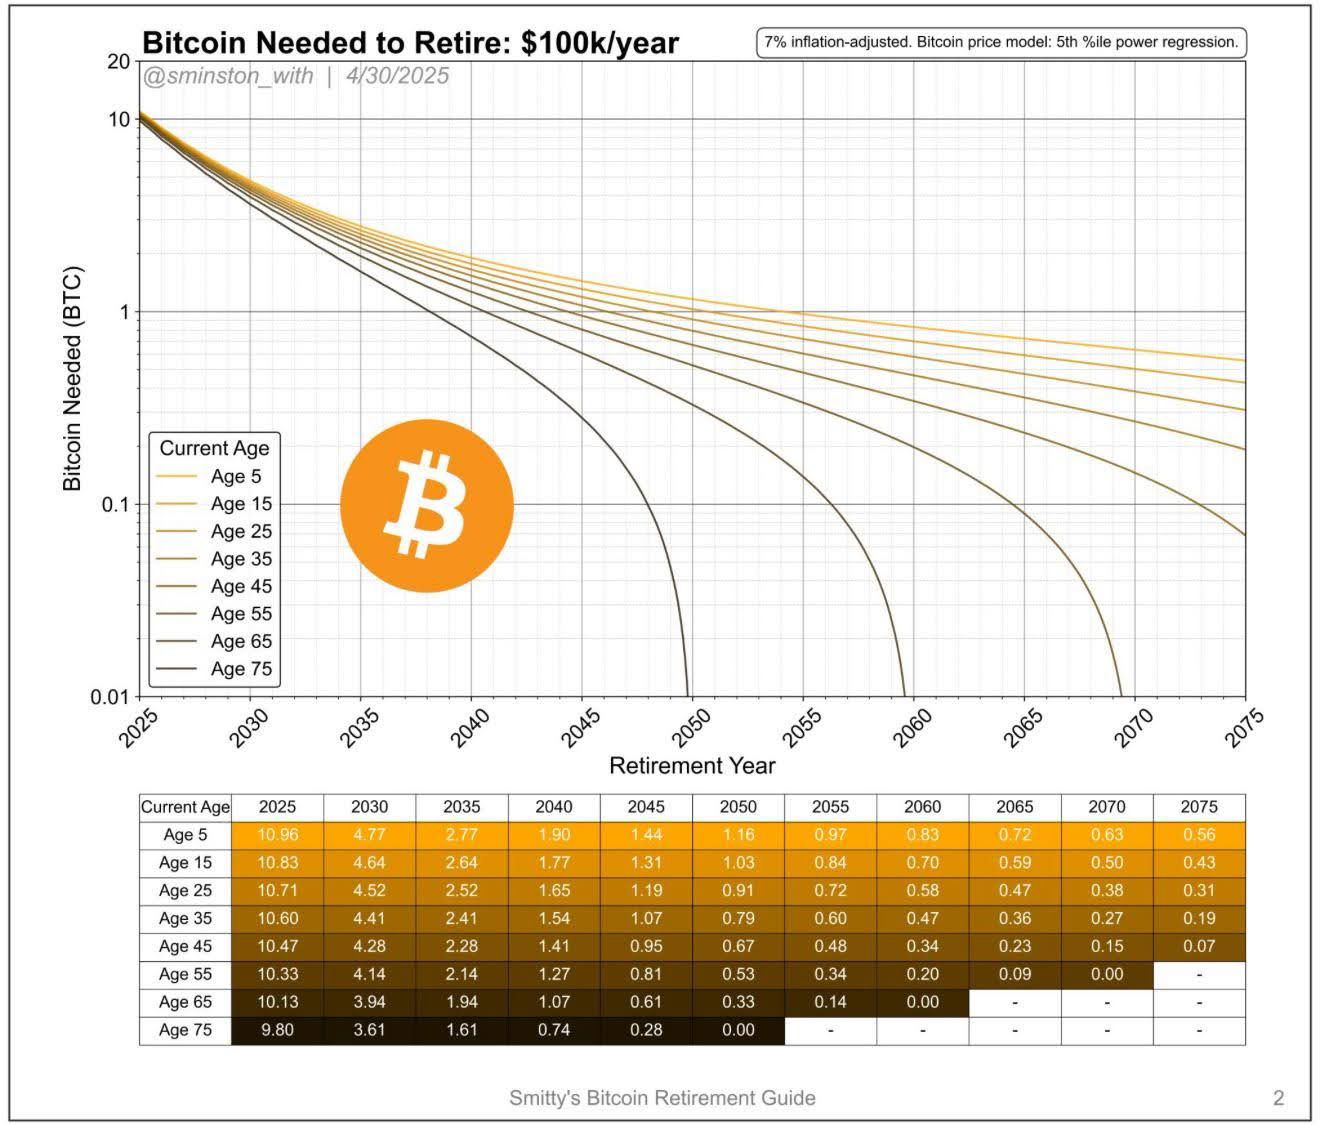
Bitcoin needed to retire on $100,000/year
This chart hits people where it hurts (and dreams) — financial freedom. It shows how much Bitcoin you’d need to...
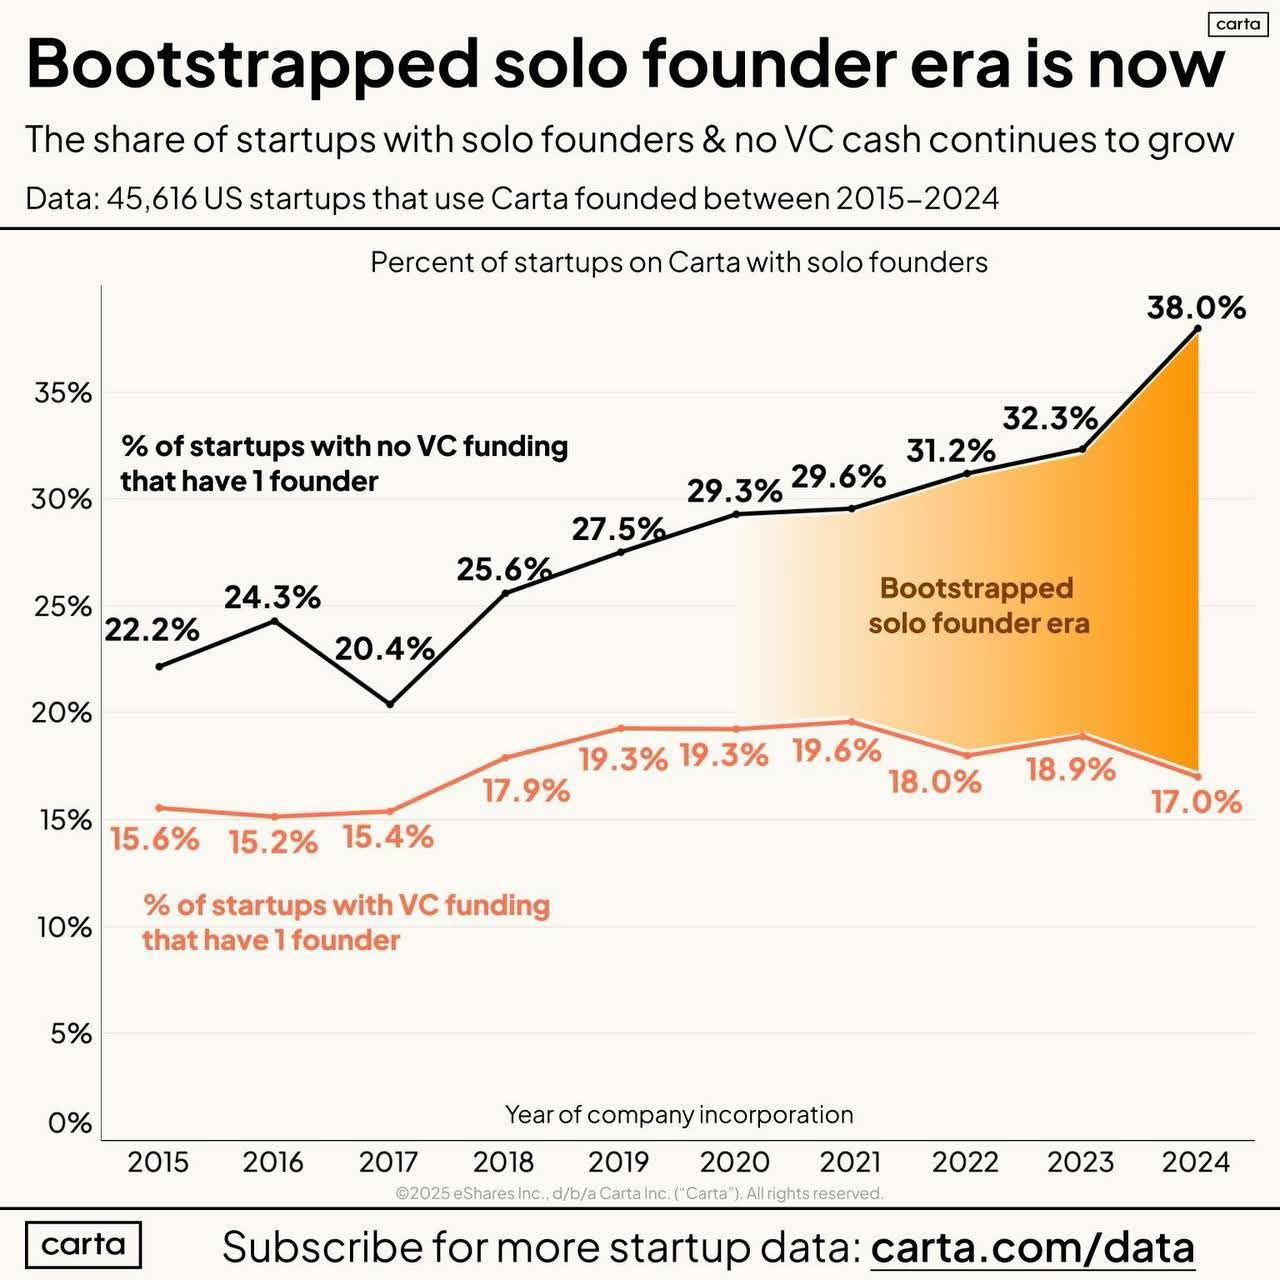
More entrepreneurs are not raising VC funding and have just one founder
Back in 2000, if you wanted to start an online company, you needed servers, tech help, and stacks of cash....
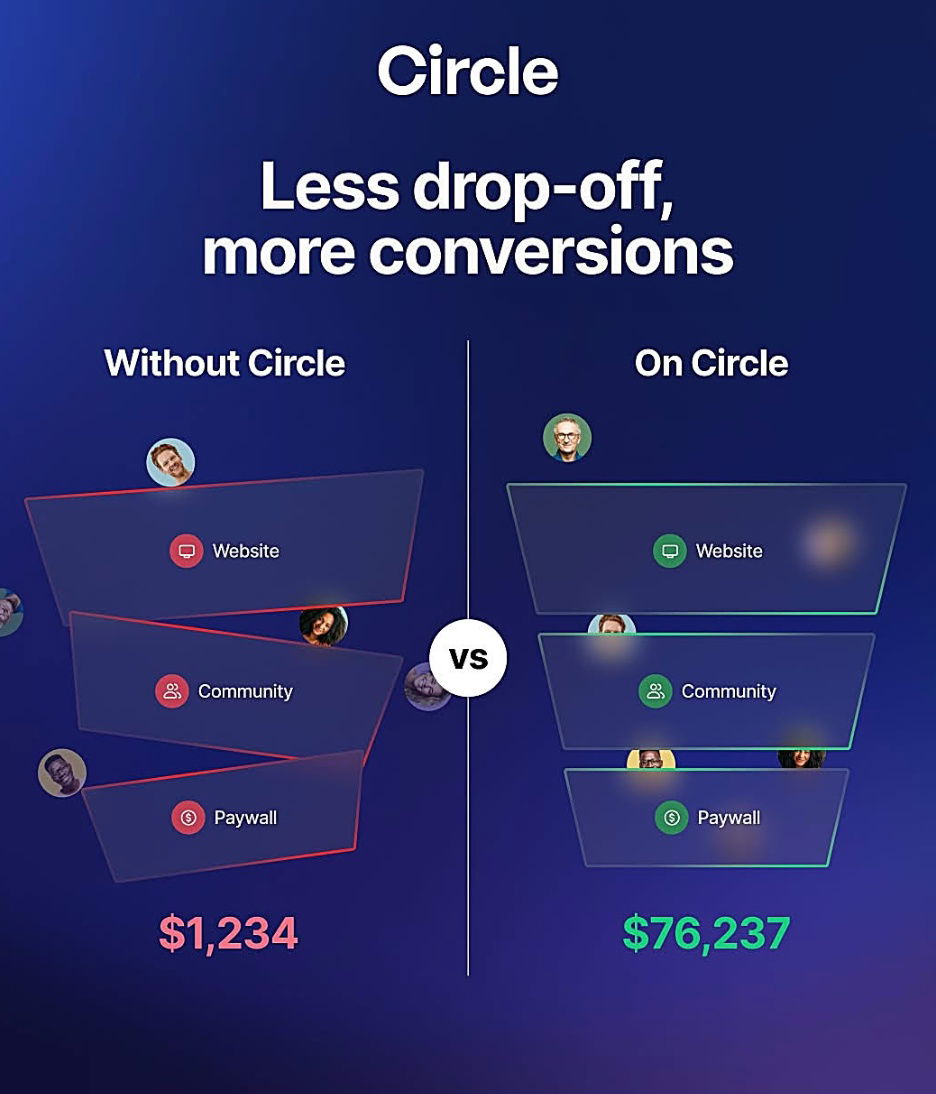
With Circle vs on Circle comparison chart
This comparison chart from Circle nails a key marketing move: show, don’t tell. With a single side-by-side visual, they turn...
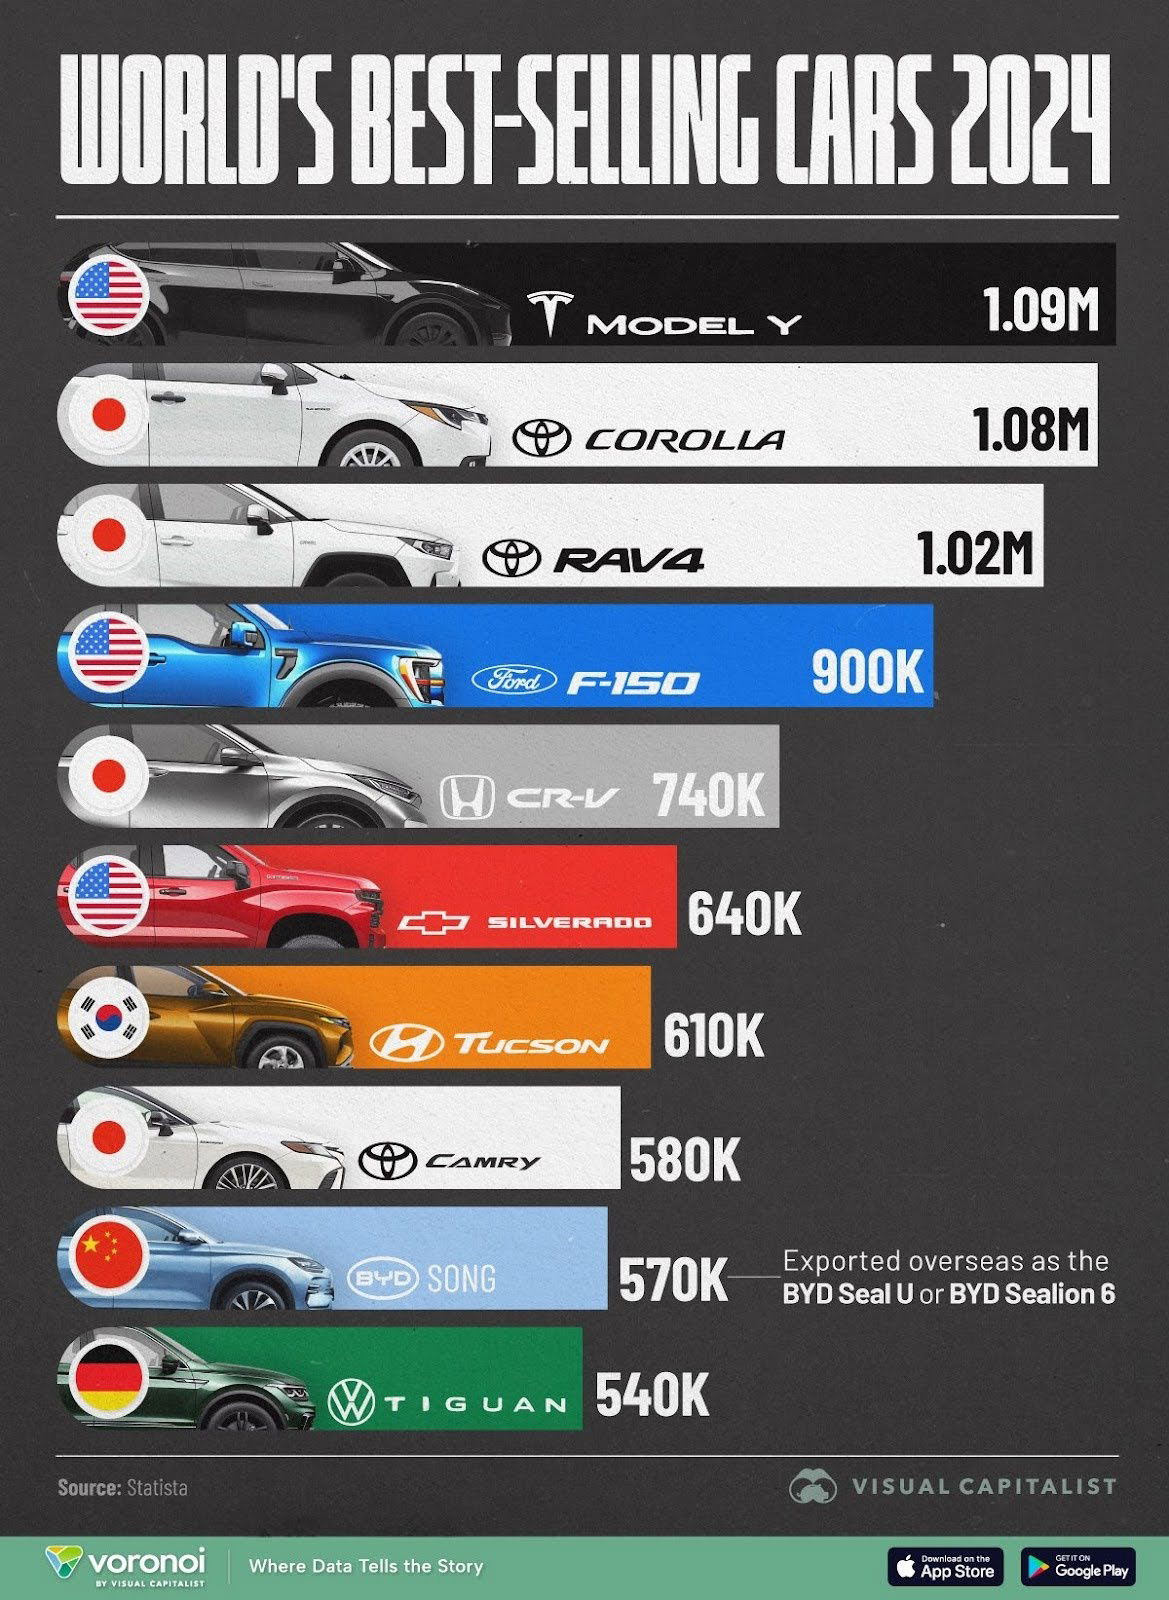
The World’s Best Selling Cars in 2024
This chart from Visual Capitalist nails it. It shows the world’s best-selling cars of 2024, but what really stands out...

Most companies are actually started by people in their 40s
This tweet shows how stories shape beliefs more than stats do. Everyone hears about the Zucks and Musks, so we...
AI is in all spreadsheets allowing new capabilites
Satya Nadella shared a wild update: Excel now has an “=COPILOT()” function. Yep, you can now ask Excel to analyze...
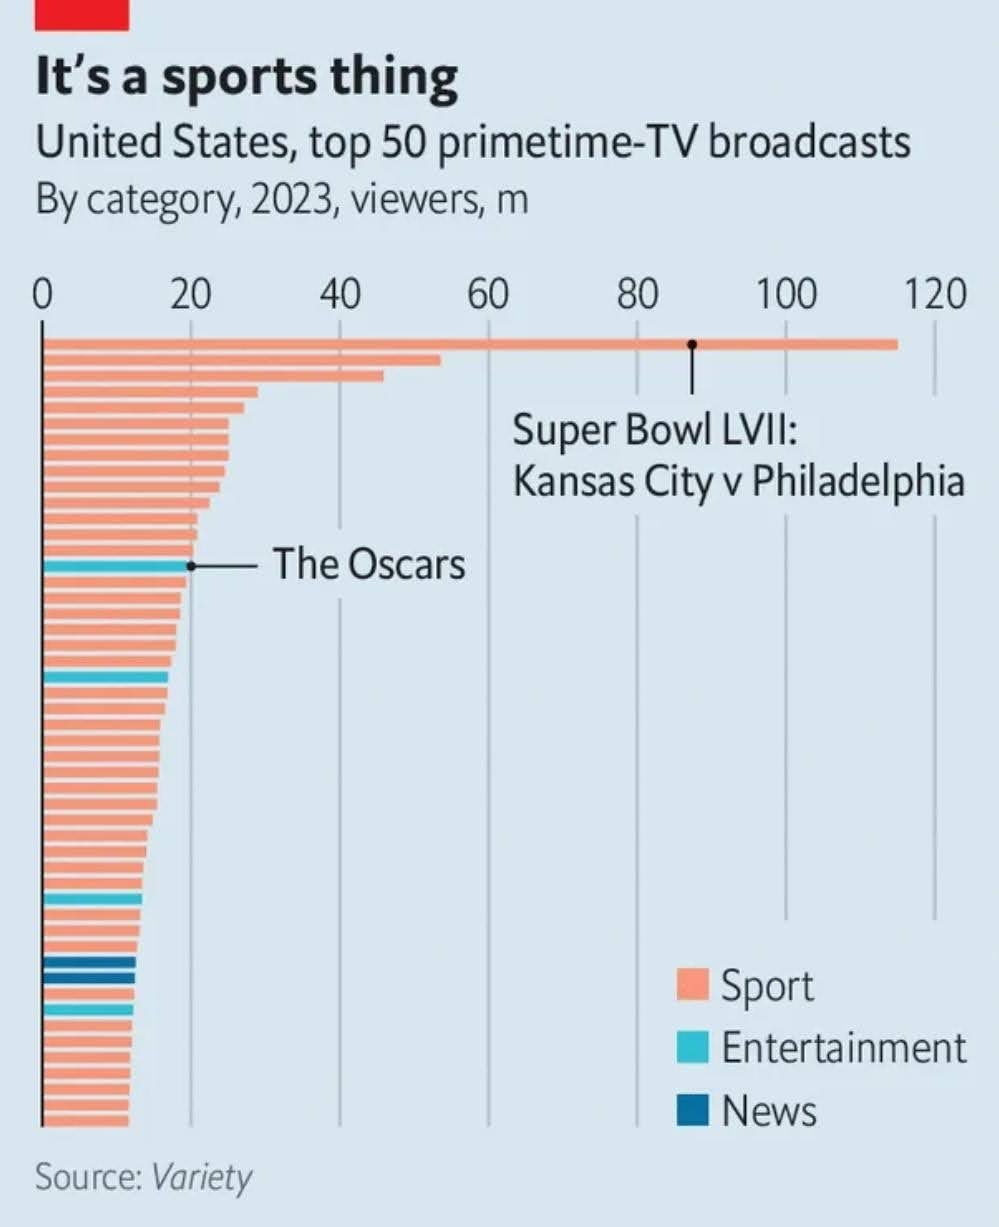
Live sports dominates TV
Look at that chart. The top 50 primetime TV broadcasts in 2023 are almost all sports. The only non-sport standout?...
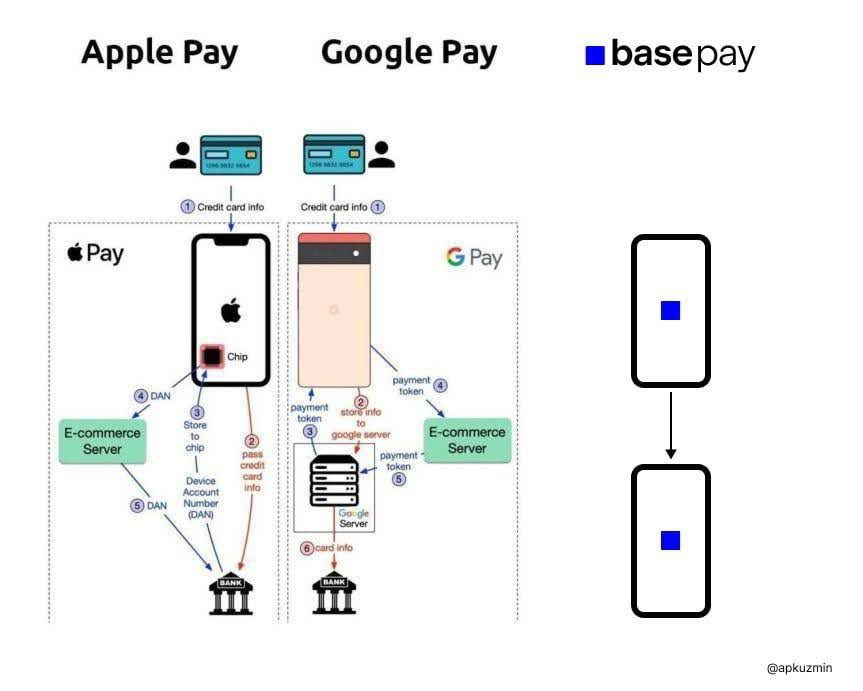
Apple Pay vs Google Pay vs Base Pay
Apple Pay and Google Pay’s systems look like spaghetti. Chips, tokens, servers—so many arrows. Then BasePay comes in: two blocks,...

StayFocused Chrome Extension for getting stuff done
Look at that YouTube tab. Just sitting there. Waiting to eat your entire afternoon. That’s why tools like Stay Focusd...
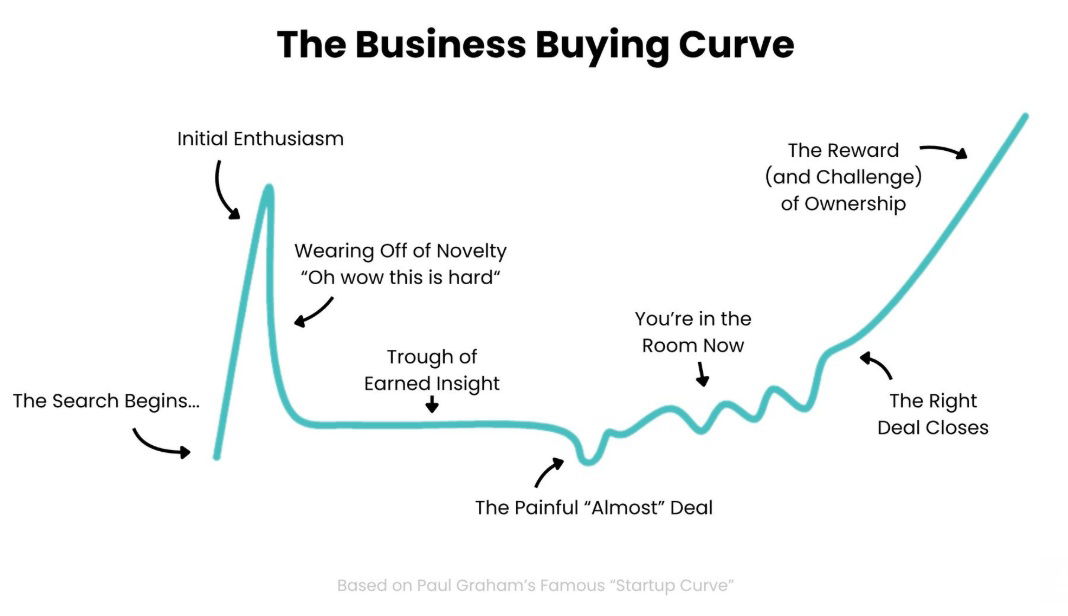
The Business Buying Curve
Buying a business looks glamorous from the outside. Then you try it—and realize it’s a long, twisty emotional journey. This...
Reading for 6-10 minutes before bed reduces stress levels by up to 68%
Bryan Johnson drops a simple tweet: “Read before bed for 6–10 minutes. Reduces stress 68%—better than music (61%), tea (54%),...

Funny real estate billboard dissing your random real estate cousin
Ever feel guilty for not hiring your cousin the realtor? This billboard flips that emotion into a marketing win. It...

Comparison Charts for Marketing
Sometimes the best marketing trick is also the simplest: a basic “Us vs. Them” chart. One glance and your audience...
Icon "What they're saying" section
Check out how Icon nails their testimonial page. Instead of fluffy praise, they feature quotes from real CEOs showing time...
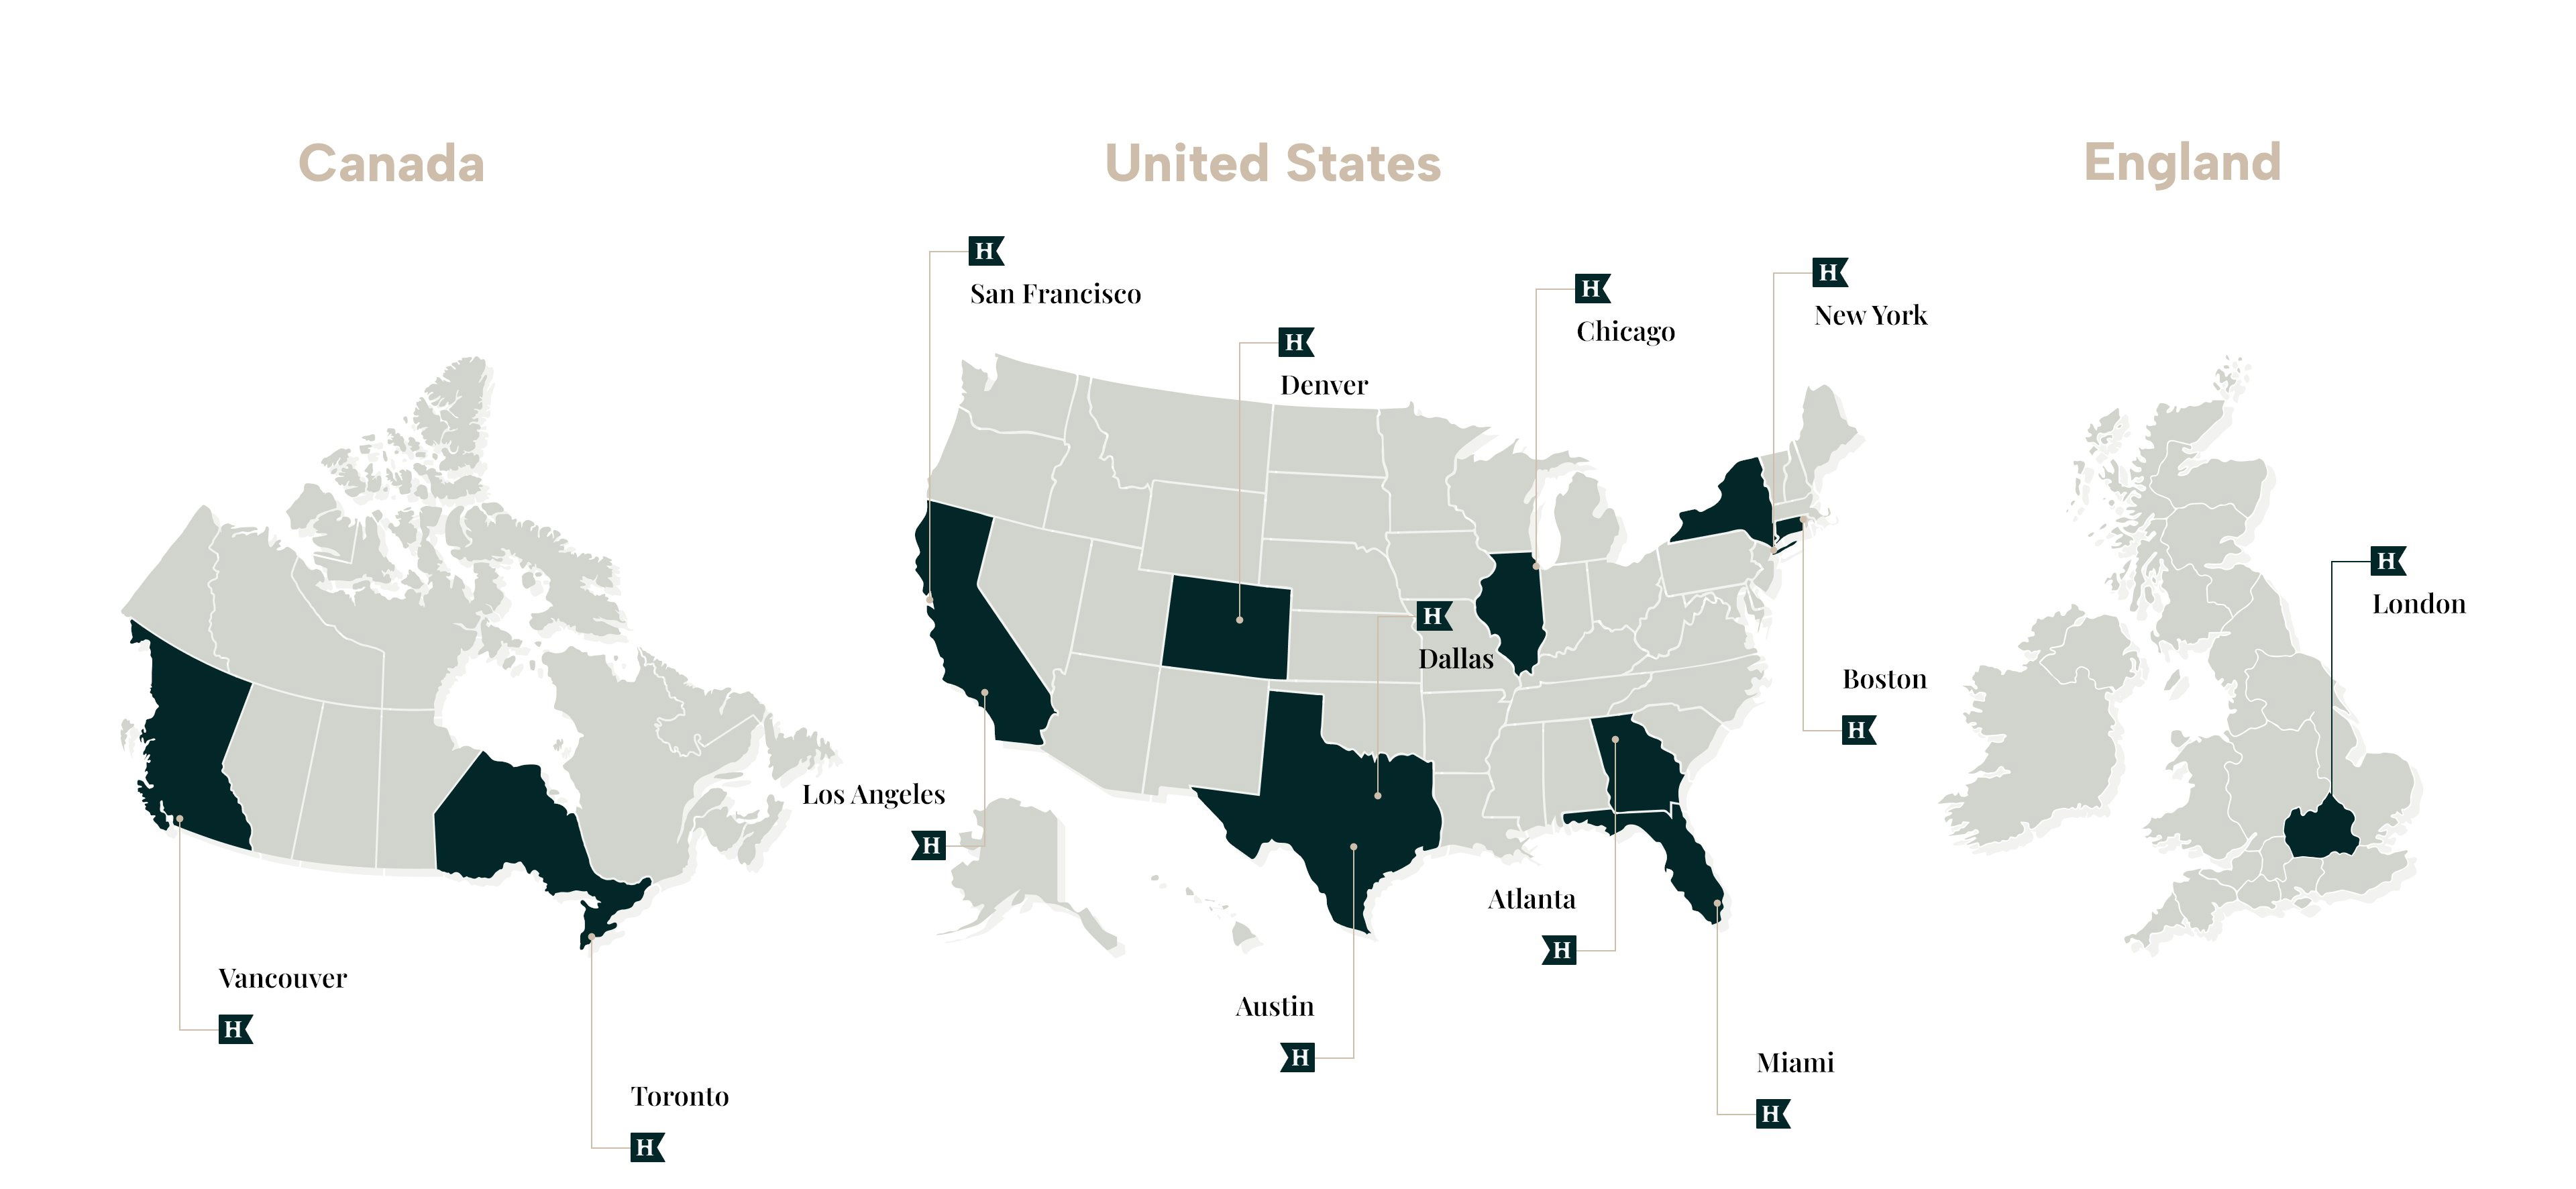
Hampton in person groups map
Hampton just dropped a slick map showing their next big move: going fully IRL. They’re launching in-person groups across 13...

To Rules of Marketing
This chart by Tom Pestridge nails what most marketers forget: marketing isn’t about clever tactics, it’s about human behavior. Each...