If you sell 5 books a day for $17.59 you make $22,471.22/yr
Updated on
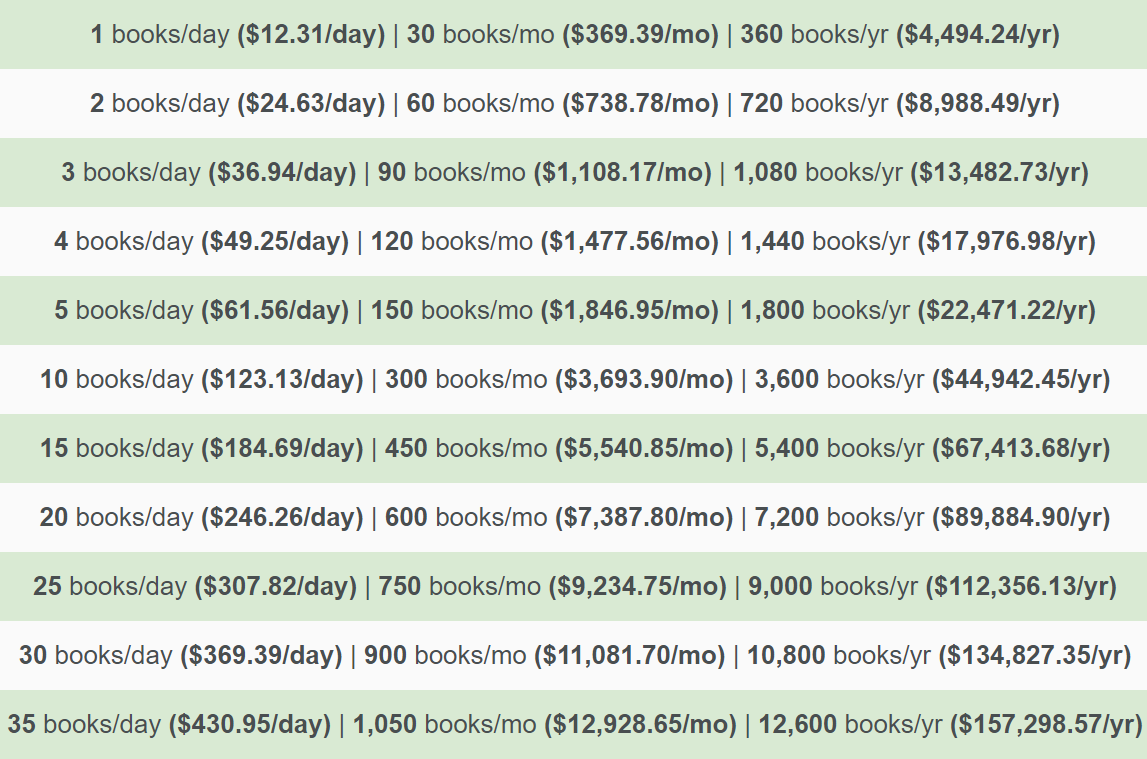
Ever wonder how many books you need to sell to make a living? This chart nails it. It shows daily book sales, broken into monthly and yearly profits. Suddenly, the abstract idea of “book sales” turns into simple math.
Marketing analysis
This image works because it shrinks a big, vague dream (making money writing) into small, achievable steps. It helps readers visualize progress and see income as a function of small daily habits.
Why it works
- Breaks complex goals into easy daily chunks
- Uses numbers to remove uncertainty
- Makes potential earnings feel attainable
- Encourages immediate action (“I just need to sell 5 books a day”)
Examples
- Gumroad creators show “sell one course/day = $X per month”
- Patreon pages highlight “100 supporters = $500/month”
- Substack writers share “500 paid readers = $2,500/month”
Small daily wins = big yearly results.
Analyzed by Swipebot
Loading analysis...
.png?width=3840&quality=80)