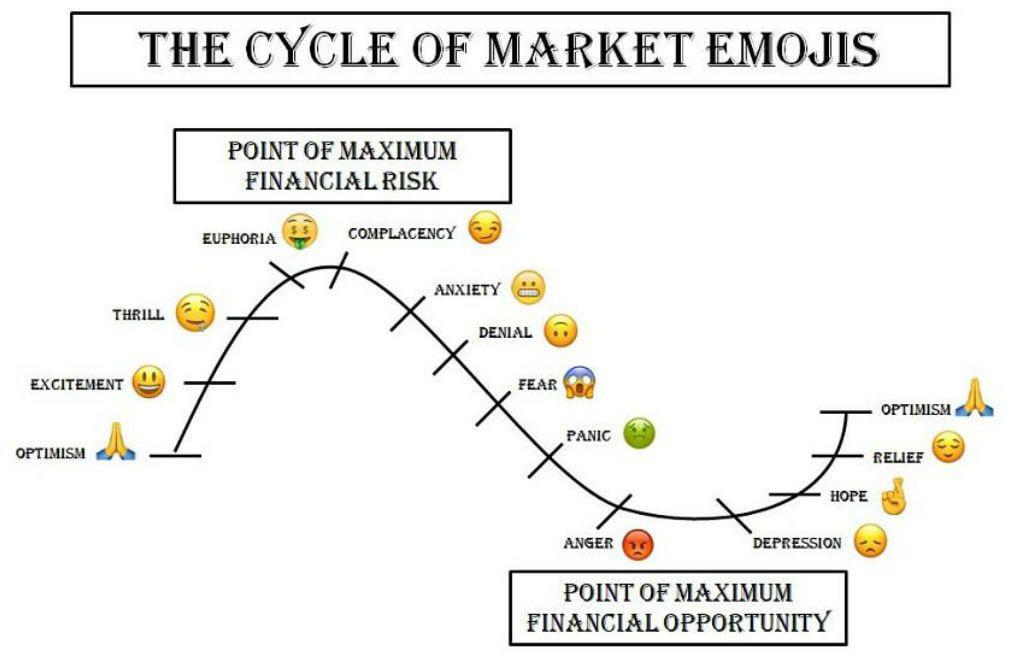
This graphic uses Emoji to show the different stages of a boom and bust market.


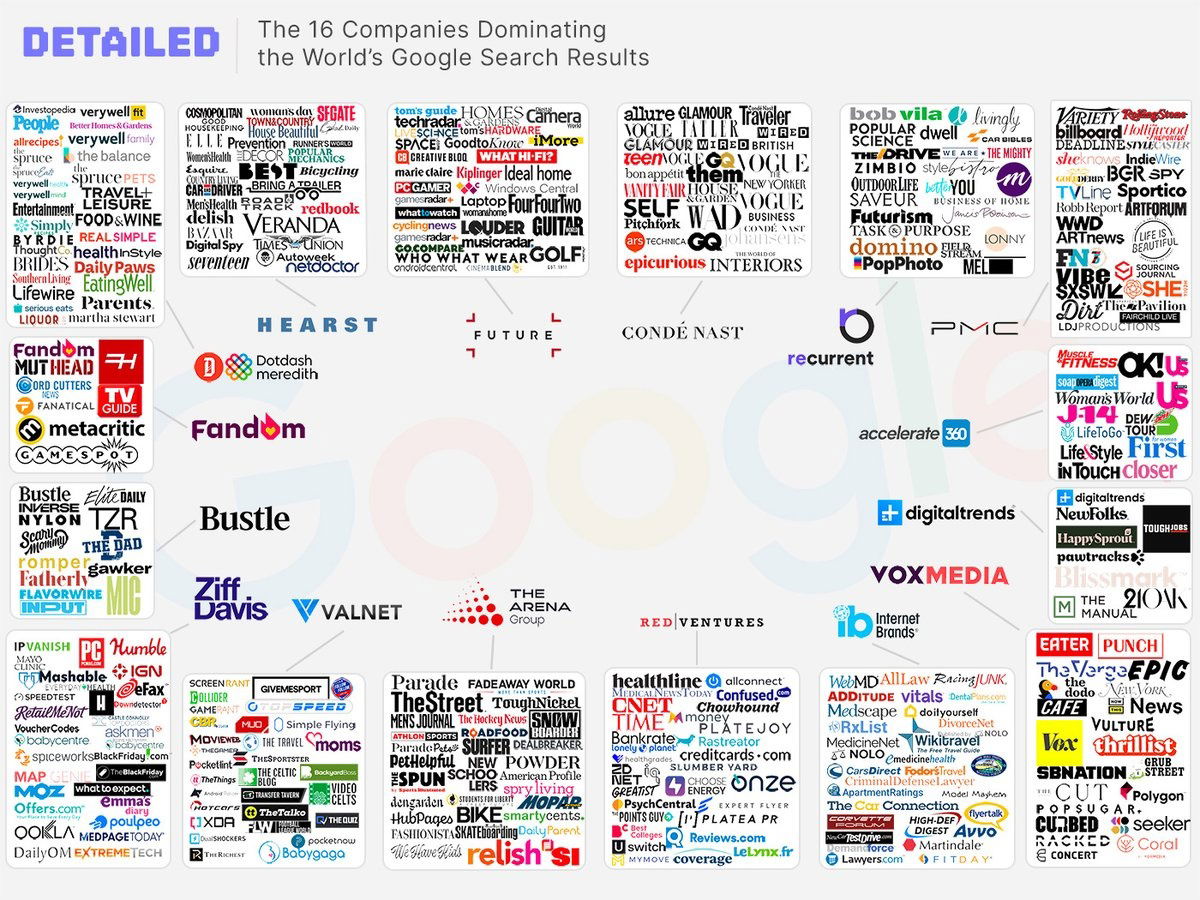
This image shows how 16 main brands control the SEO on google. Why I think the review industry sucks:basically 16...

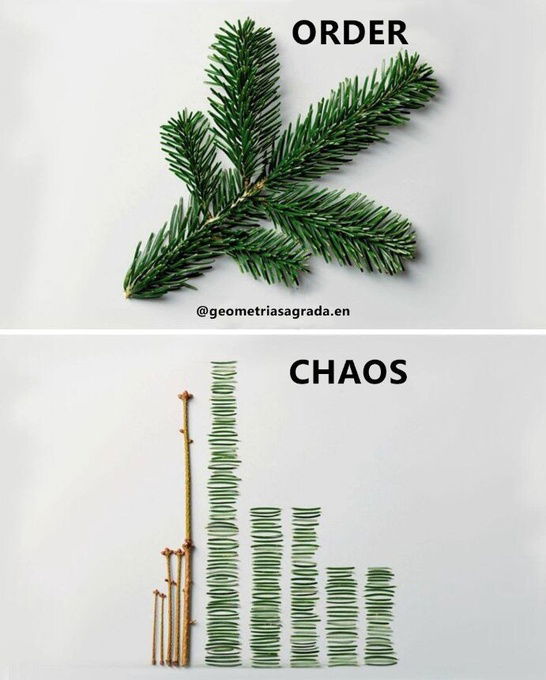
This is a cool visualization of an assembled plant in complete order, but then disassembled it looks like just random...

This is a pretty cool graphic that shows the progression of how the Tesla headlights look from 2012 all the...

An effective and straightforward image showcasing the evolution of the Mac Mini. What's crazy is the amount of ports it...

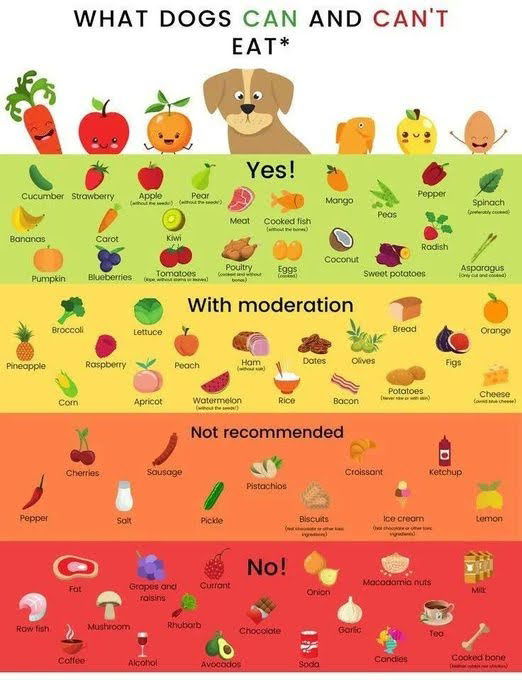
I like simple images that convey a BUNCH of data, and in one Instagram-sized post this shows what dogs can...

This is an awesome graph that takes all data from different ratings platforms and combines their scores to get the...
Search for a command to run...