Largest Companies by Market Cap Chart
Updated on
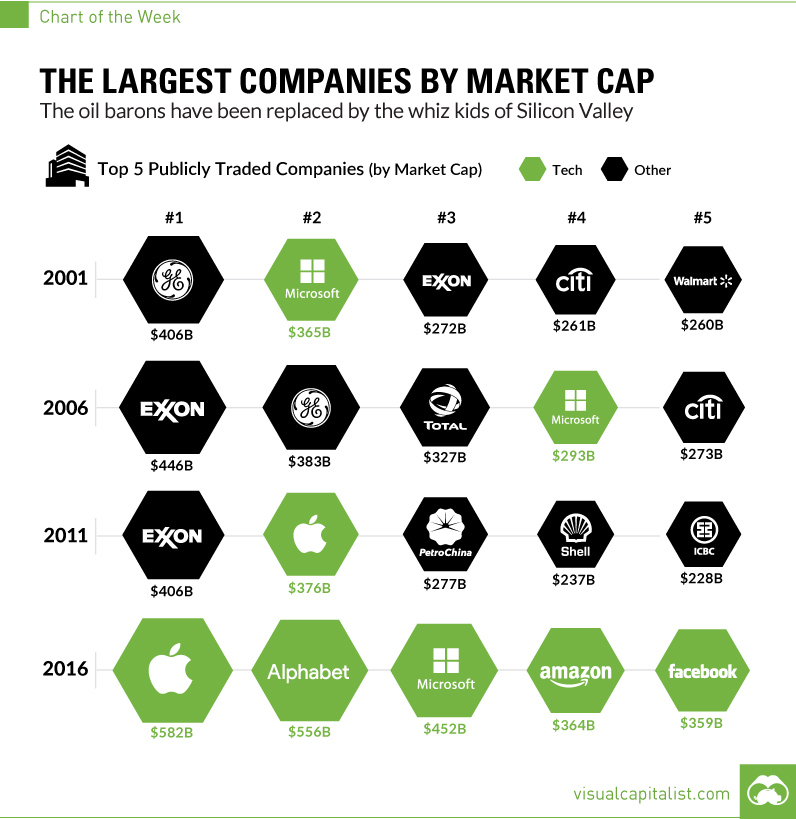
This chart nails it: in just 15 years, the biggest companies on earth flipped from oil and manufacturing to pure tech. The money didn’t disappear—it just chased eyeballs.
Marketing Analysis
By 2016, Apple, Alphabet, Microsoft, Amazon, and Facebook owned the top five spots. They didn’t sell oil or steel; they sold attention, habits, and ecosystems. Data and engagement replaced physical goods as the new “oil.”
Why It Works
- Tech scales globally with almost no extra cost
- Habit loops keep users locked in
- Data compounds value over time
- Innovation speed beats slow industries
Examples
- Apple hit $582B with both hardware and loyalty
- Amazon built $364B by making shopping frictionless
- Facebook turned $359B of value from attention alone
- Alphabet made $556B translating search intent into ad gold
Analyzed by Swipebot
Loading analysis...
