
This is a cool illustration (even though it’s a bit complex) of how information in an MP4 video file is stored and decoded.


A simple chart with unemployment and "underemployment" rates by college major makes this data visually interesting by making the bar...
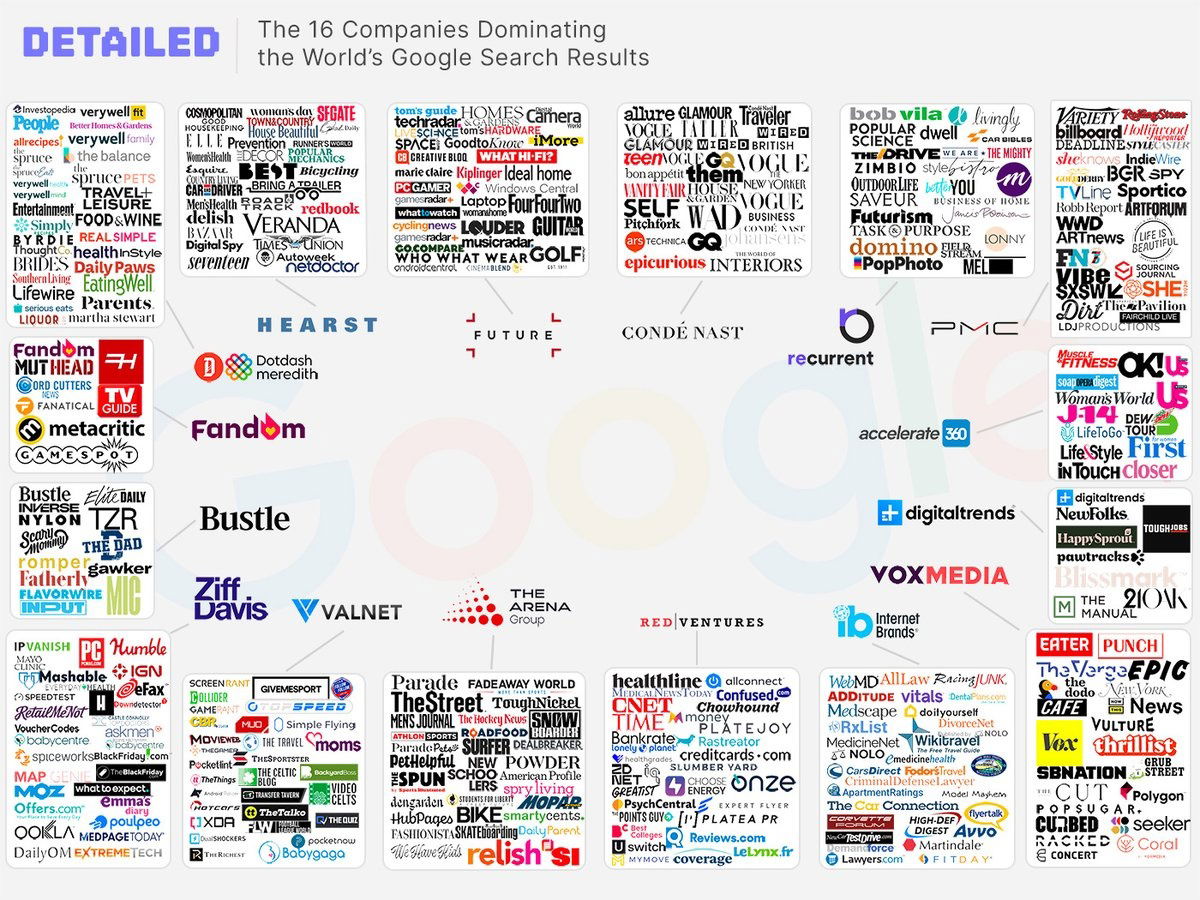
This image shows how 16 main brands control the SEO on google. Why I think the review industry sucks:basically 16...

Check out this chart to easily discover which countries are the biggest importers in the world!

Here's a cool gift list for men from @thewarkitchenHere's a list of products I've previously gifted people for Christmas:• Air...

This graph illustrates the number of downloads needed to rank #1 on the app store.app store.
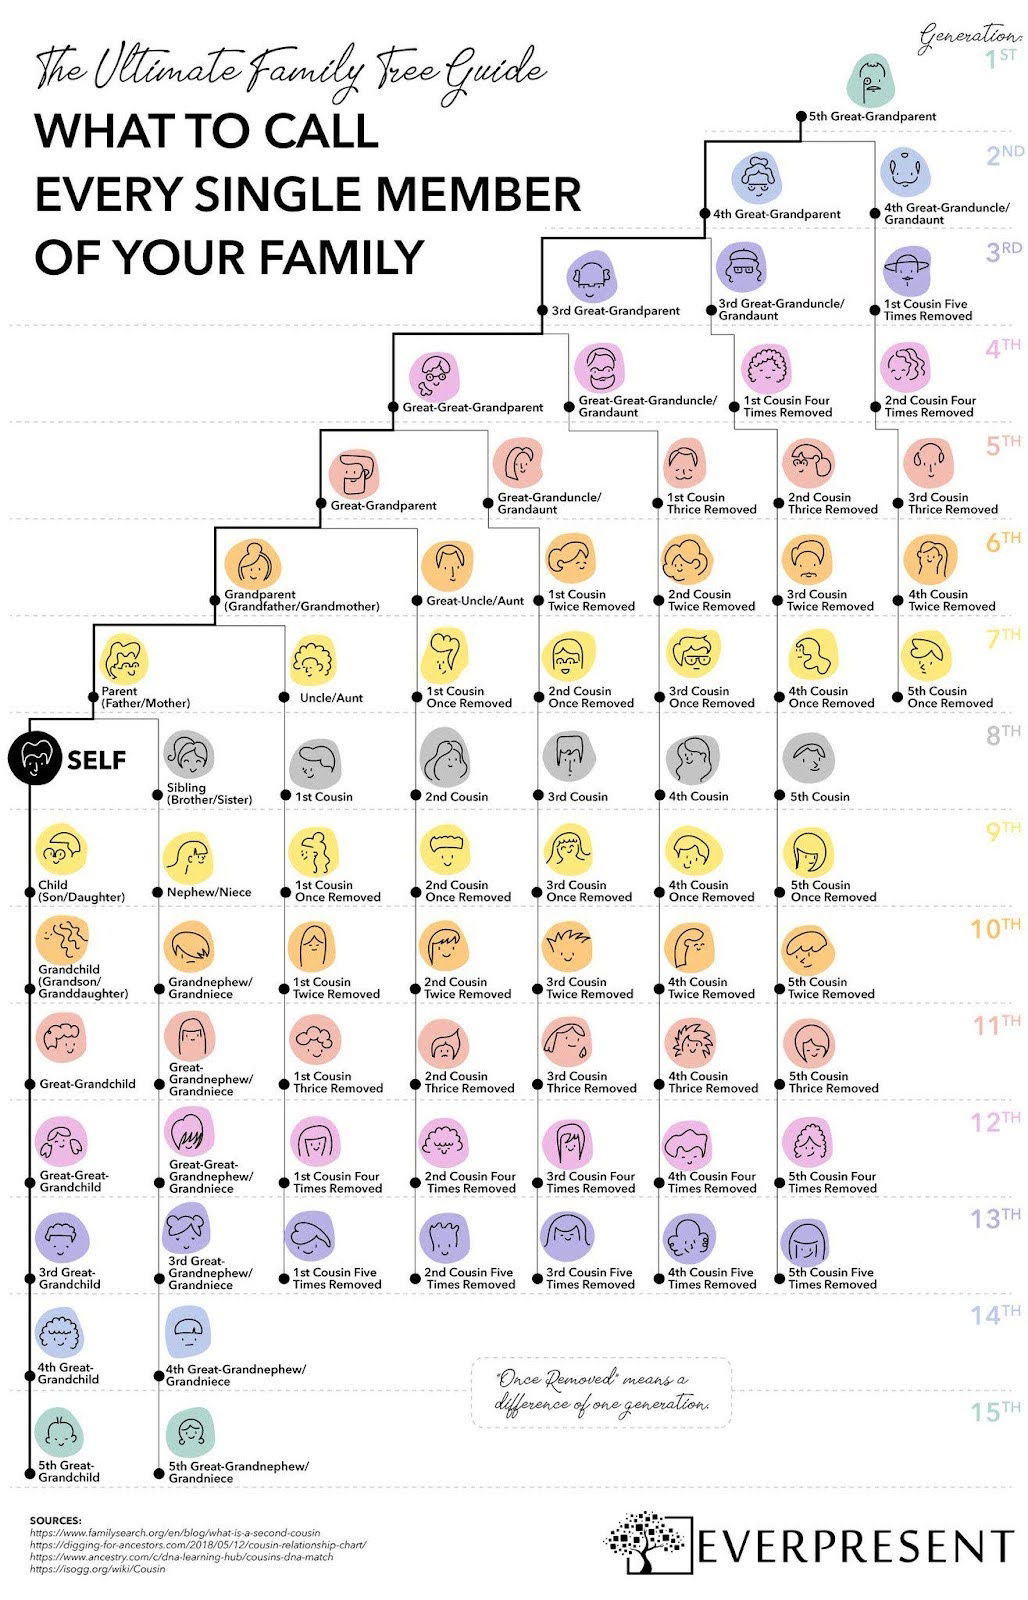
This colorful one-pager breaks down what to call every single family member—across 15 generations.
Search for a command to run...