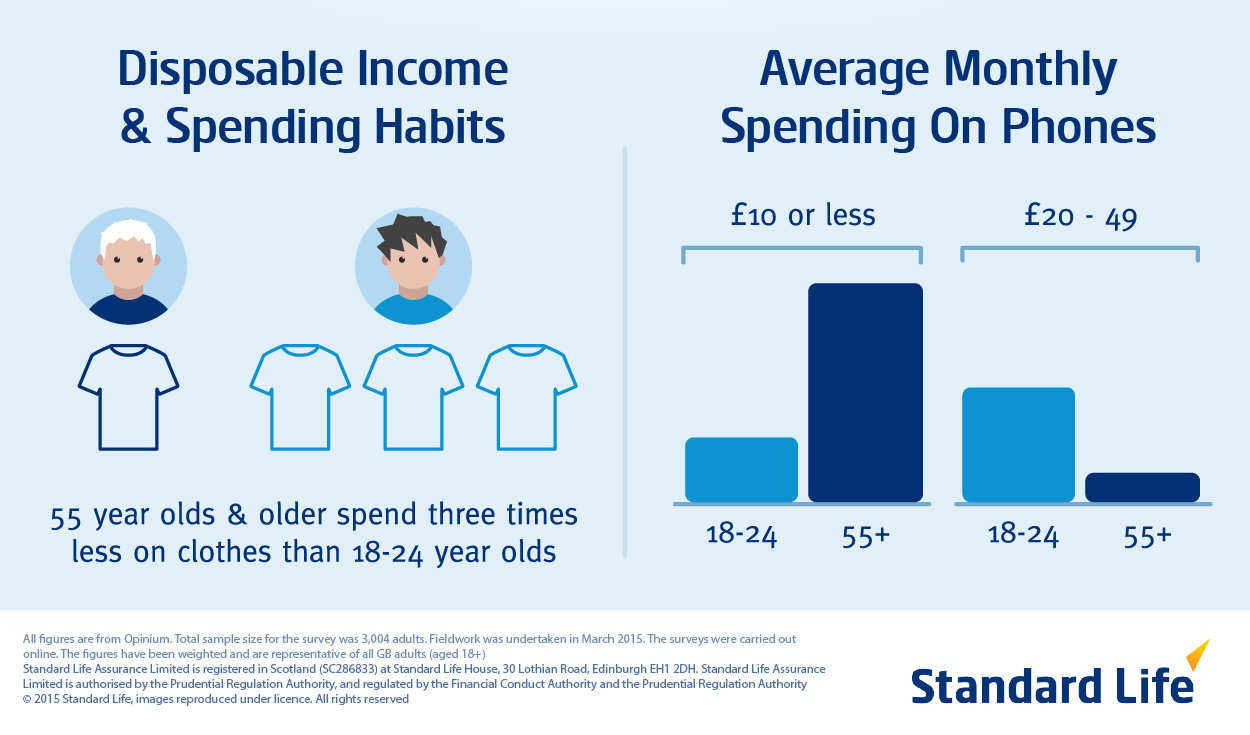
This Standard Life graphic is a masterclass in quick understanding. In two seconds, you “get” how spending habits differ between 18–24-year-olds and 55+ adults. No walls of text. Just icons, bars, and color doing the heavy lifting.
The Marketing Lesson
Visual storytelling wins when attention spans are short. The icons (shirts and bars) and bright contrasts pull your eye exactly where it needs to go. You don’t need to read the captions to understand the story.
Why It Works
- One clear comparison per visual
- Color contrast guides focus
- Simple icons replace complex labels
- Emotionally relatable categories (clothes, phones)
Real-World Examples
- Spotify Wrapped makes data instantly fun with shapes and color.
- Apple Fitness rings show progress without a single sentence.
- Google Trends turns dry stats into quick-scroll insights.
Analyzed by Swipebot
Loading analysis...
