US Election Graphic
Updated on
00:00
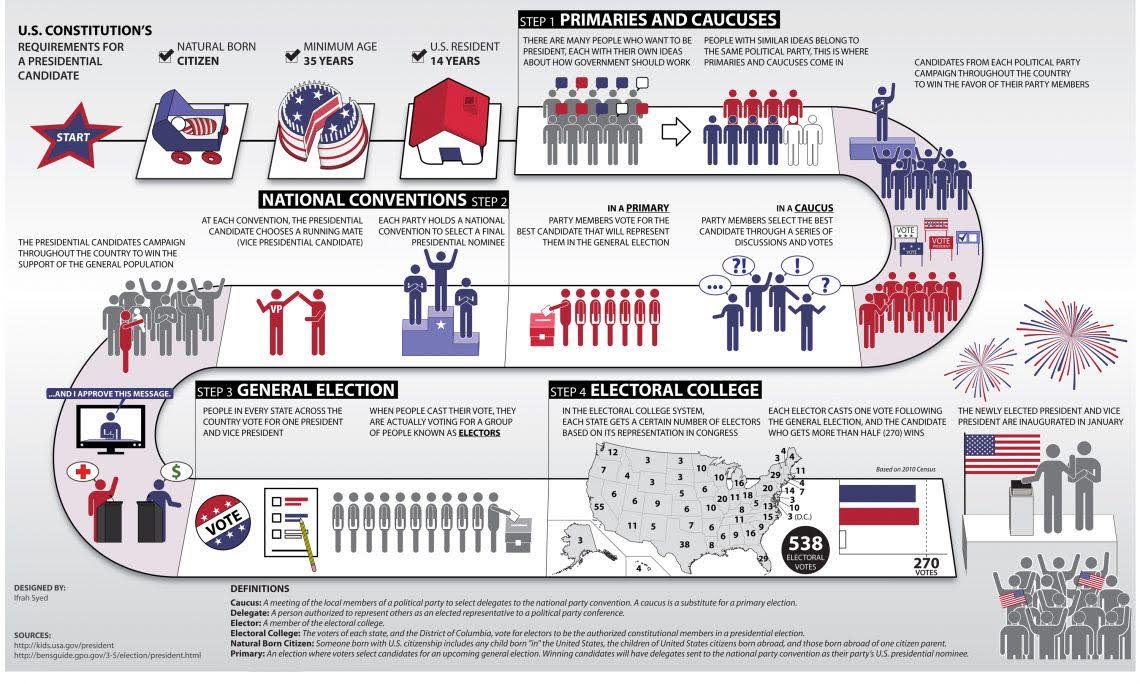
Ever wondered what running for President has in common with marketing? This chart of the U.S. election process shows it perfectly: turning millions of people into one “yes” vote takes a well-structured funnel.
Marketing analysis
Every step—primaries, conventions, general election—narrows the audience from loyal fans to mass-market voters. Each phase requires tailored messaging, audience targeting, and brand positioning. It’s like a long, high-stakes sales funnel with different conversion points.
Why it works
- Breaks a complex system into simple visual chunks
- Shows clear progression from “awareness” to “conversion”
- Uses recognizable icons to make abstract ideas concrete
- Appeals to both visual and logical thinkers
Examples
- Apple launches teaser ads months before release (primaries)
- Political-style rallies = Tesla product unveilings (conventions)
- Final election push = product launch day marketing campaigns
Analyzed by Swipebot
Loading analysis...
