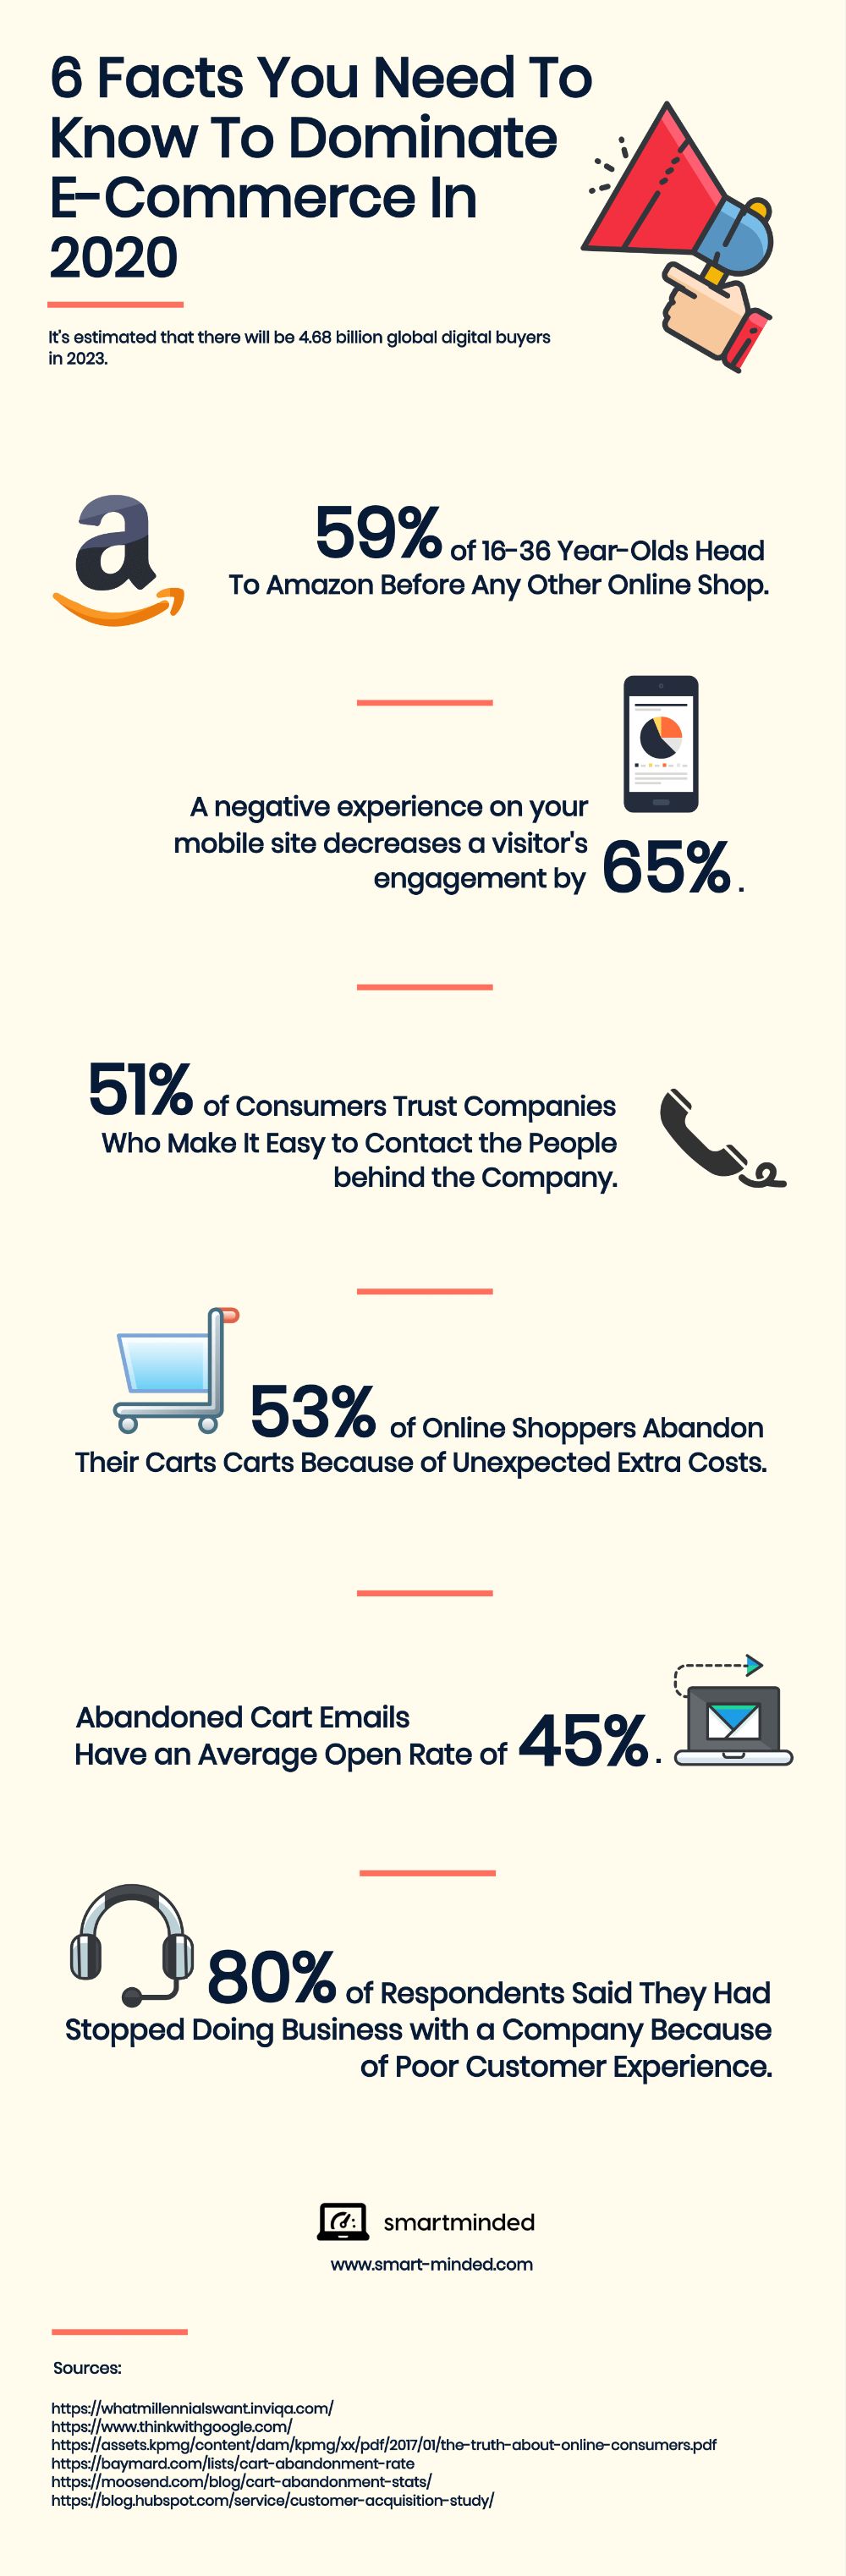
Most ecommerce stores lose money on tiny mistakes. This infographic from Smartminded nails six easy wins that can instantly level up your store performance.
Marketing Analysis
Each stat is a micro-conversion killer or booster. Fixing these adds compounding results: faster checkouts, more trust, and higher lifetime value. For example, 53% of shoppers ditch carts due to surprise costs. Add transparency and your checkout rate climbs.
Why It Works
- Removes friction at key buying moments
- Builds trust through easy communication
- Turns frustration into loyalty via better mobile UX
- Recovers lost sales with abandoned cart follow-ups
Examples
- ASOS shows delivery costs upfront—cuts cart drop-off.
- Casper sends follow-up emails to reclaim 19% of abandoned carts.
- Zappos wins loyalty with 24/7 human support lines.
- Amazon’s one-click checkout keeps impulse buyers locked in.
Analyzed by Swipebot
Loading analysis...
