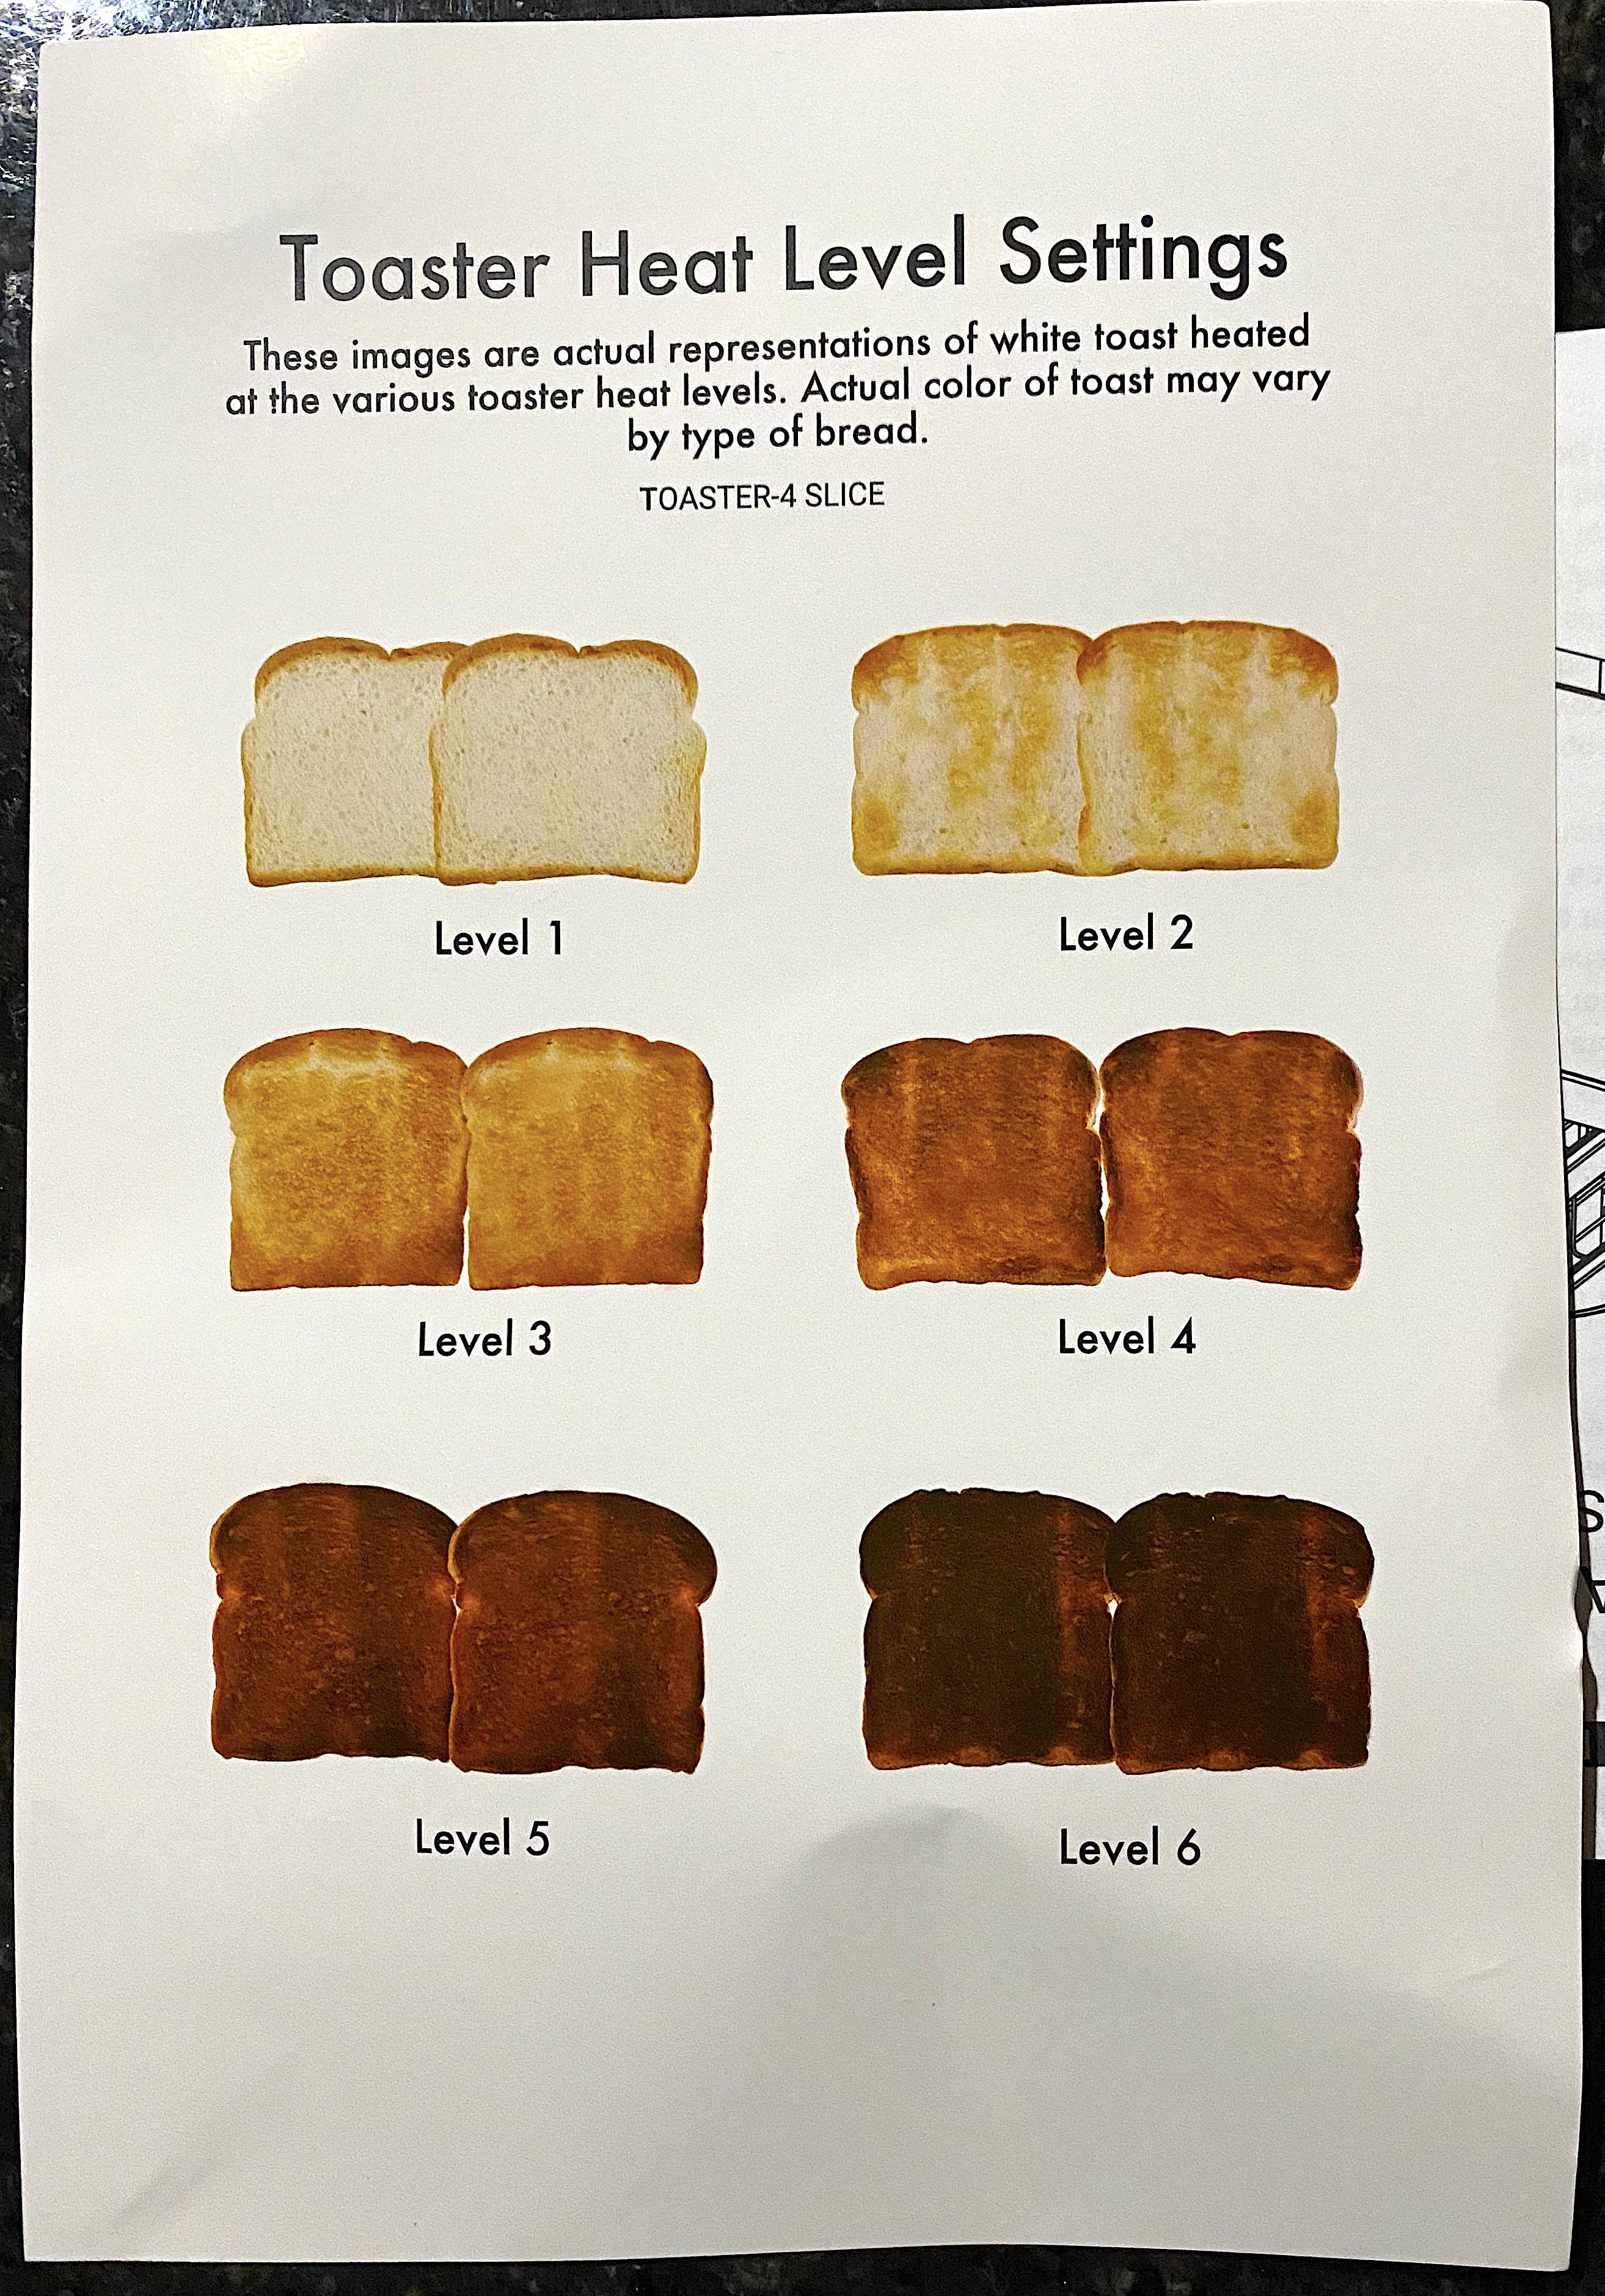
Ever wonder what those toaster numbers actually mean? This chart ends the confusion. It shows six slices of toast, each matching a heat level from 1 to 6. Instantly clear, no guessing, no reading the manual.
Marketing analysis
This is a genius use of visual labeling. Instead of abstract numbers, it uses real images to show actual results. That triggers instant understanding and confidence in the product.
Why it works
- It removes decision friction
- It shows reality, not theory
- It’s visual, fast, and universal
- It builds trust through transparency
Examples
- Coffee shops show cup sizes visually (grande, venti)
- Netflix previews show a thumbnail instead of text blurbs
- Paint brands display real color swatches, not color names
- Food delivery apps use photos instead of menu item descriptions
Analyzed by Swipebot
Loading analysis...
