Visual guide to different types of chocolate chip cookies
Updated on
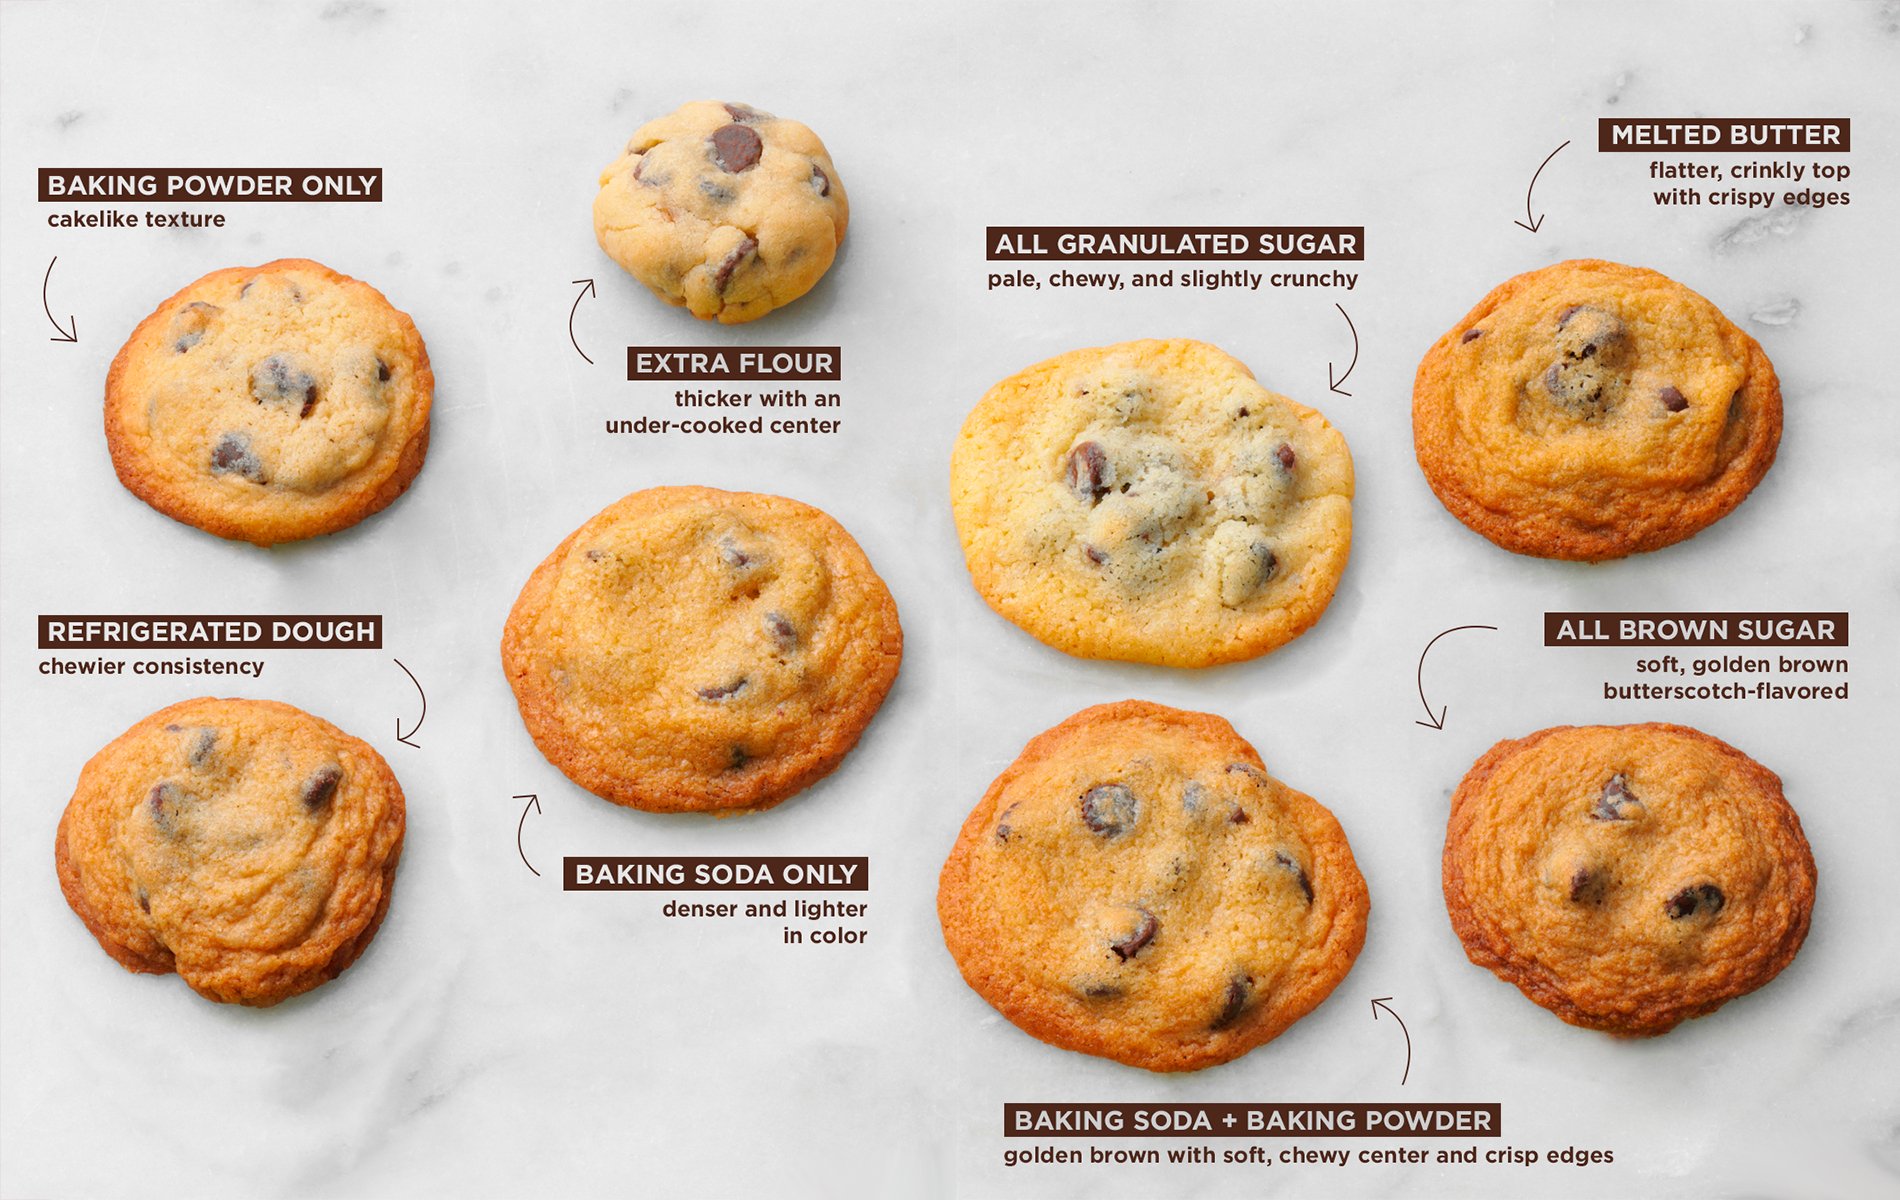
Ever wonder why your homemade cookies never match your grandma’s? This image breaks it down visually — showing how small recipe tweaks change the look, texture, and flavor of every batch.
Marketing analysis
This chart works because it turns a complicated, trial-and-error process into a simple visual guide. Each cookie looks different, instantly teaching you the “why” behind the result. That’s exactly what great marketing should do — show transformation clearly and visually.
Why it works
- Visual contrast grabs attention fast
- Clear labeling explains without fluff
- Side-by-side comparisons teach intuitively
- Turns abstract lessons into tangible results
- Makes you want to experiment
Examples
- HubSpot’s email A/B test graphics show how tiny subject line tweaks boost opens.
- Canva tutorials use side-by-side designs to explain design principles.
- Airbnb listings compare “before” and “after” photos to show home upgrades.
Analyzed by Swipebot
Loading analysis...
