
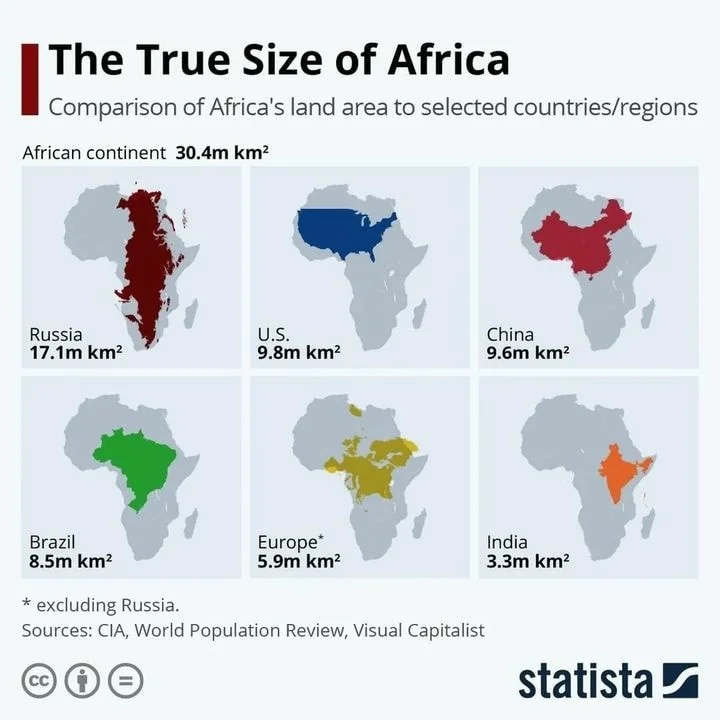
Interesting visual of the countries with the most people. The USA looks so tiny in comparison to the big two.


To me, an image like this packs in a lot of data in a very easy-to-understand method.
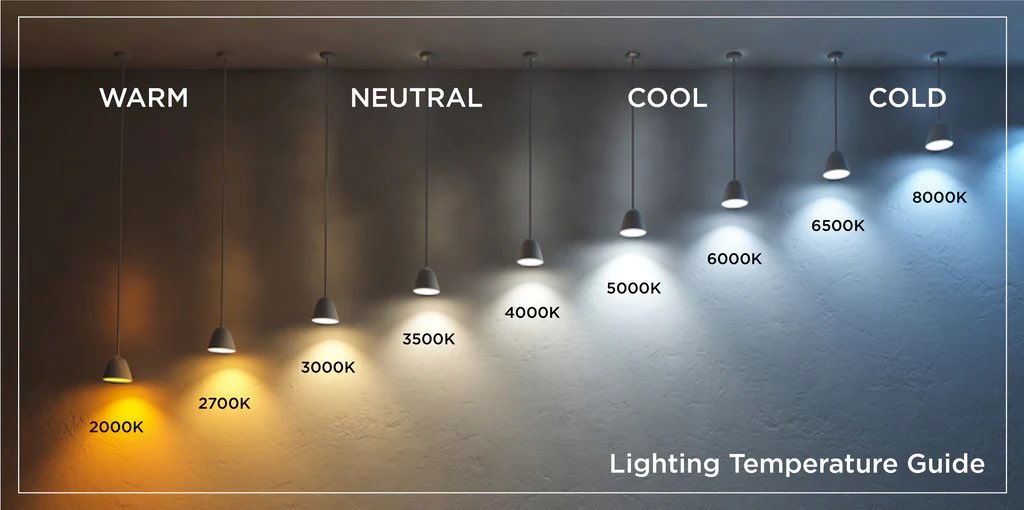
This is a very simple yet very cool guide that shows the difference between warm, neutral, cool, and cold lighting....

This was an interesting way to show data of the most common jobs by AGE.The data showed:16 to 24 years:...
I love when a single graph or chart can update how you think about something. It's quite shocking to know...

This chart shows how American went from bringing in revenue from manufacturing in 1990 to bringing in revenue from healthcare...

Love how this chart takes data from the top 7 movie ranking sources, then tallies them up for a final...
Search for a command to run...