What Gives Energy? -vs- What Drains Energy?
Updated on
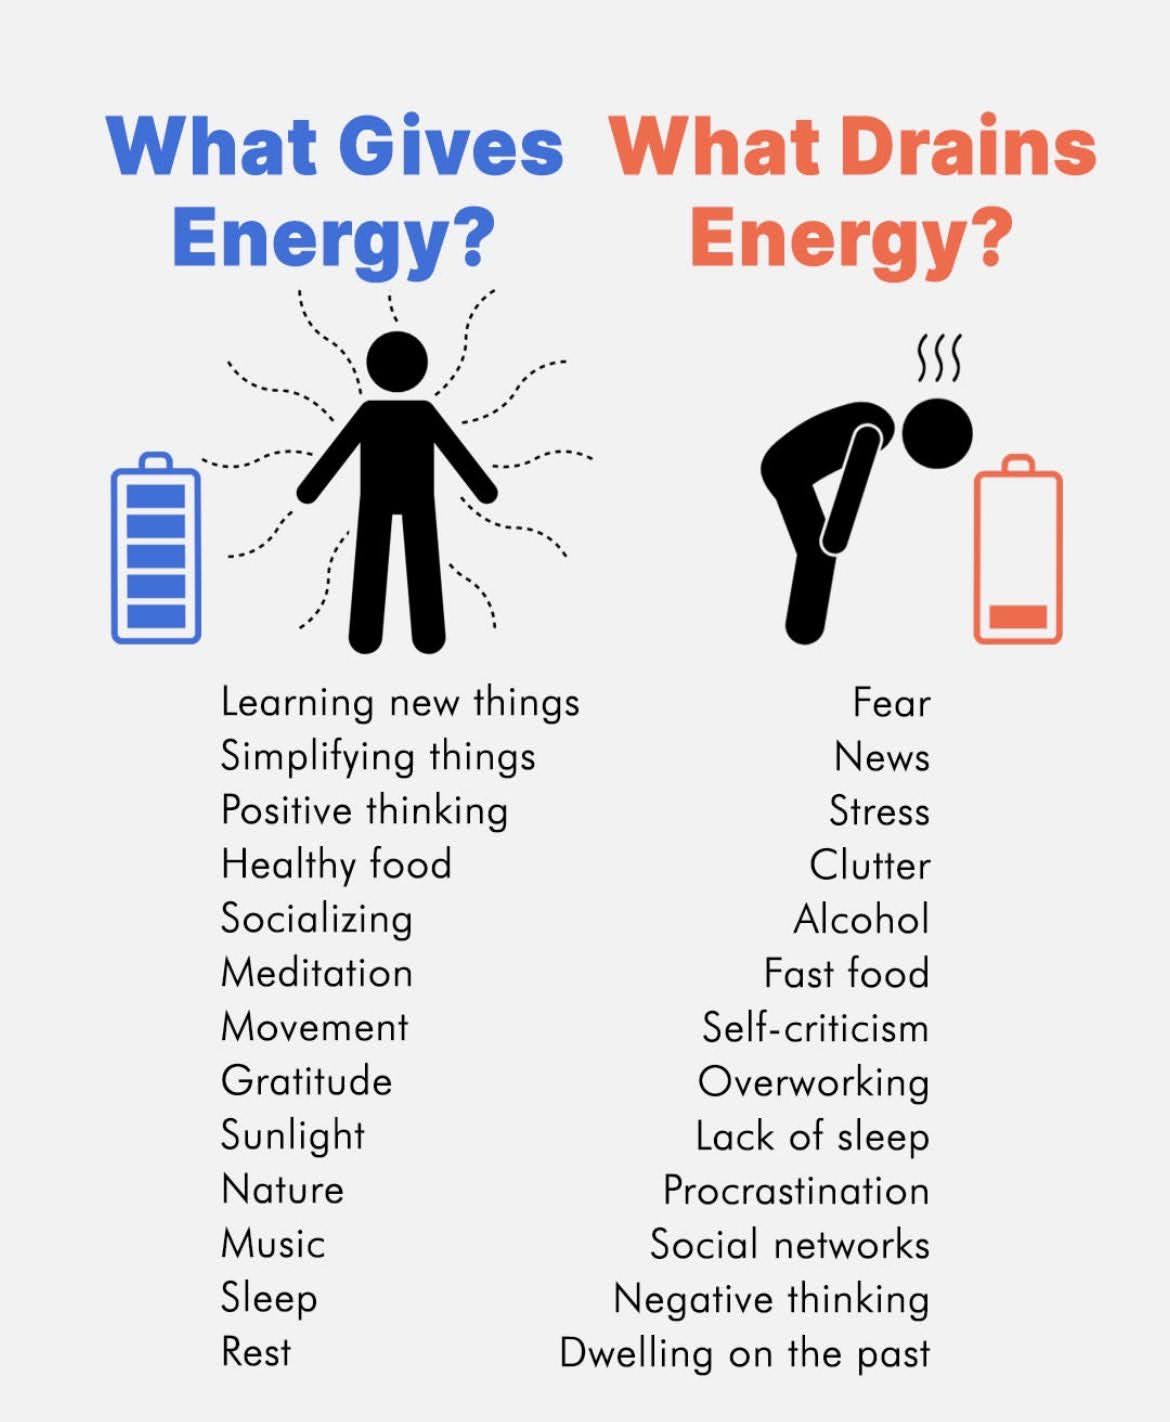
This chart hits hard: creativity isn’t about more hours, it’s about better energy. If your tank’s empty, no hack will save you. Manage what fuels you and what drains you, and your marketing gets sharper fast.
The Visual Power Move
The split layout — blue for “Gives Energy,” red for “Drains Energy” — makes it brain-friendly. Even at a glance, you feel which side you want to be on. Icons make it emotional, not just informational.
Why It Works
- Visual opposites = instant clarity
- Strong color contrast sticks in memory
- Simple text lists invite quick saves and shares
- It taps emotions instead of analytics
Examples
- HubSpot’s “Do’s vs Don’ts” infographics use the same layout for clarity
- Calm app posts two-column visuals for mindset tips
- LinkedIn tip lists like this often get 3–5x more shares than plain text posts
Analyzed by Swipebot
Loading analysis...
.png?width=3840&quality=80)