96 Interesting Examples
Explore our Friday S.W.I.P.E.S. Email where we uncover a wealth of intriguing insights. From innovative ideas to compelling content, get your weekly dose of inspiration and stay ahead in the world of email marketing.

What kids wanna be when they grow up graph
Gen Alpha doesn’t dream of white coats or corner offices. They dream of ring lights and followers. According to this...

This guy invented the Smile Face in 1963
In 1963, a merger tanked morale at an insurance company. So they hired freelance artist Harvey Ball to make something…...
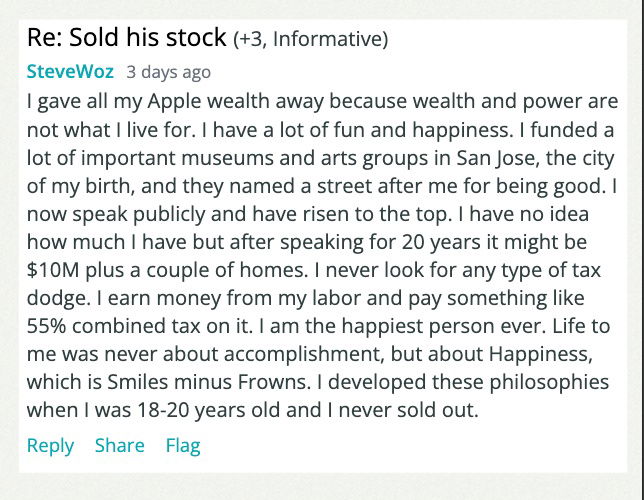
Steve Wozniak (co-founder of Apple) on his $10M net worth
Most people chase more—more money, more fame, more followers. But Steve Wozniak, co-founder of Apple, reminds us that enough can...
Media is going to be more “winner-takes-all” as time goes on
Naval Ravikant nailed it: in an AI-saturated world, no one wants average. When anyone can churn out decent content with...
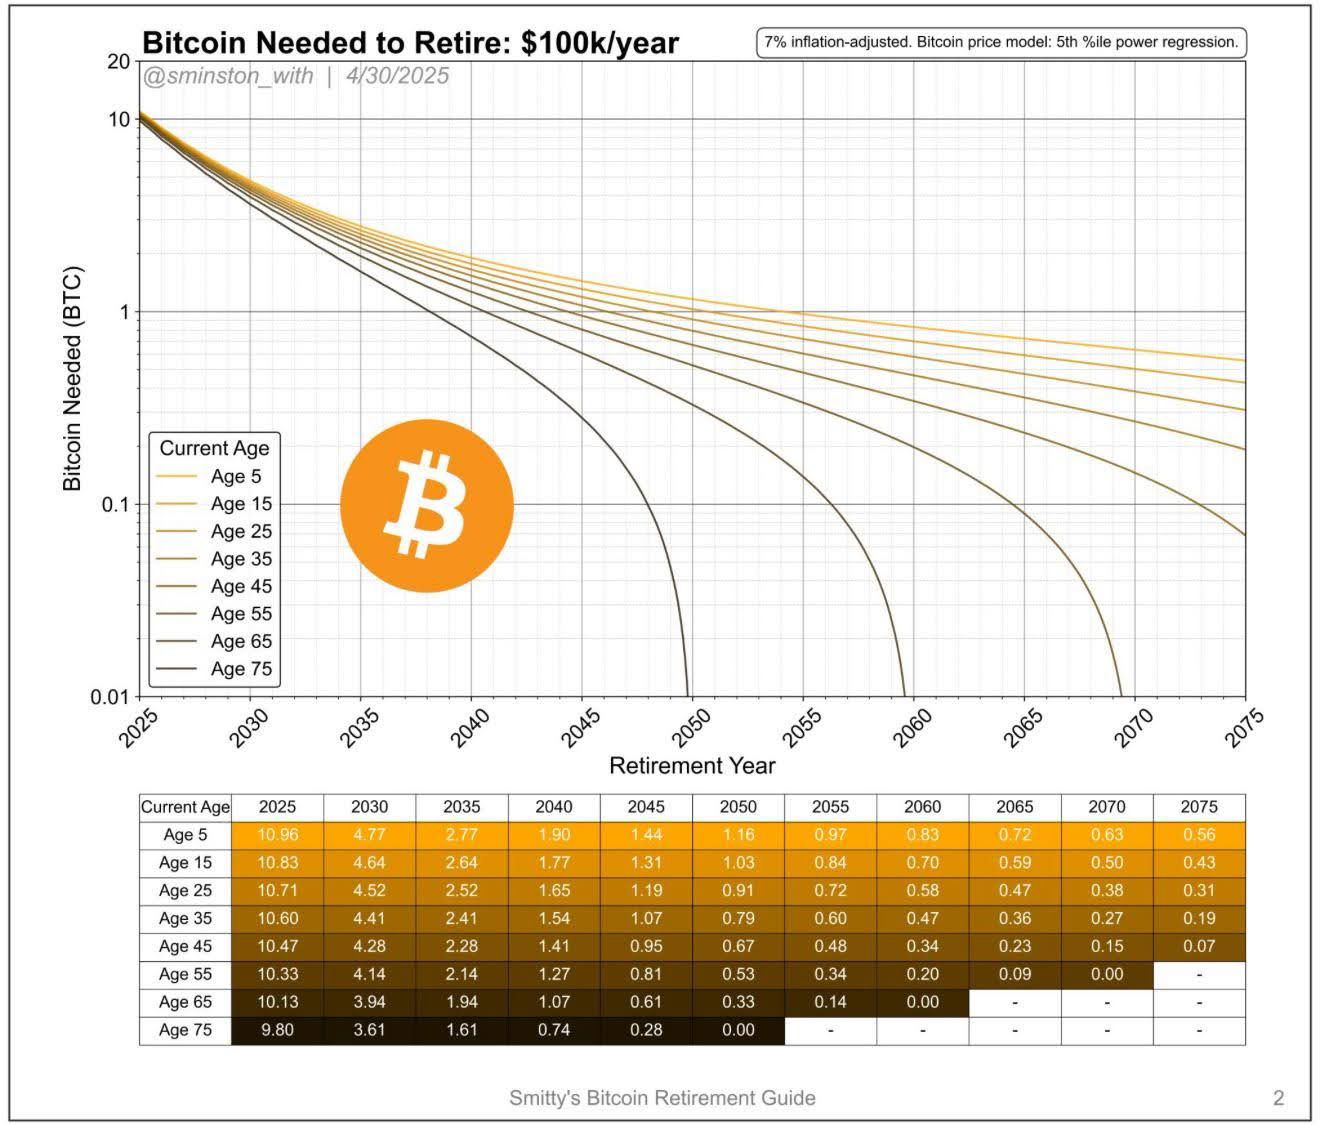
Bitcoin needed to retire on $100,000/year
This chart hits people where it hurts (and dreams) — financial freedom. It shows how much Bitcoin you’d need to...

Most companies are actually started by people in their 40s
This tweet shows how stories shape beliefs more than stats do. Everyone hears about the Zucks and Musks, so we...
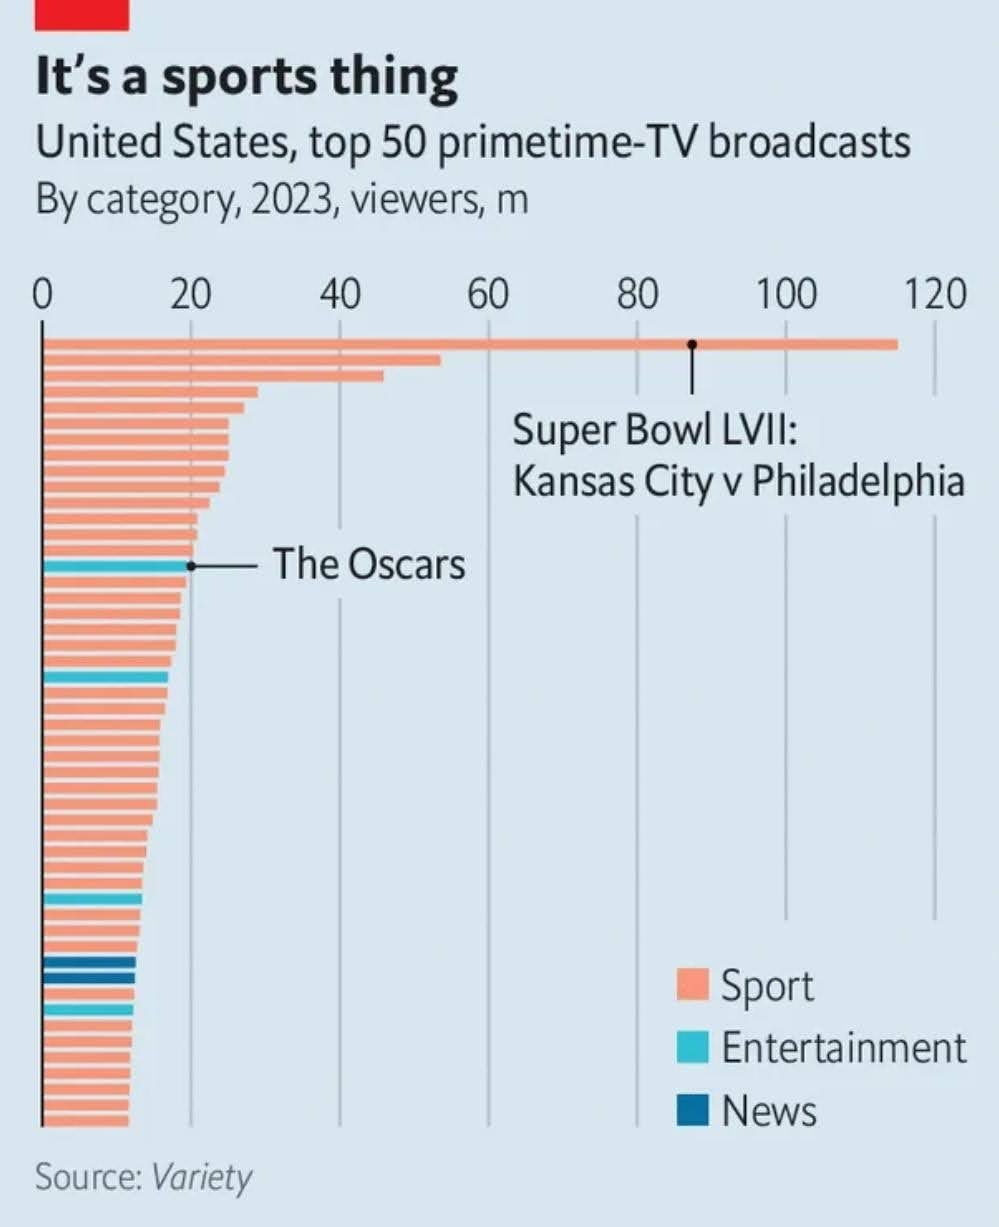
Live sports dominates TV
Look at that chart. The top 50 primetime TV broadcasts in 2023 are almost all sports. The only non-sport standout?...

Turns out many people aren’t depressed, they just don’t have something worthy to work on.
Dr. Nicholas Fabiano shared a study titled A Wandering Mind Is an Unhappy Mind with a great insight: people are...

How to Solve a Rubix's Cube Cheat Sheet
This Rubik’s Cube cheat sheet isn’t just about solving puzzles. It’s a masterclass in simplifying complexity. Every step, color, and...
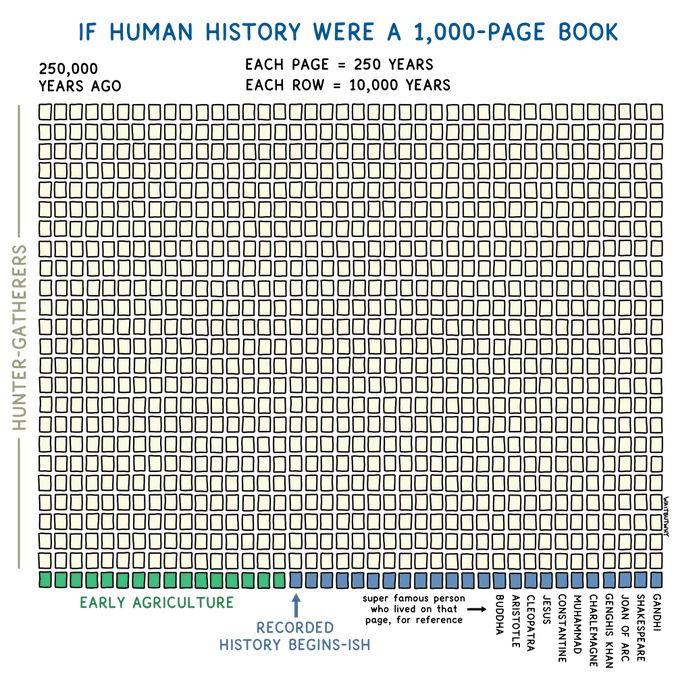
Human History Chart
Ever feel like marketing isn’t moving fast enough? This chart from Wait But Why crushes that illusion. It shows human...

Jaguar declining sales after disastrous ad campaign.
Jaguar’s 2025 rebrand tried to be bold and artsy—but forgot to actually sell cars. The result? A jaw-dropping 97.5% sales...

Number of accidents: Normal Driving -vs- Waymo -vs- Tesla
A tweet showing accident rates per million miles made big waves: Tesla at 0.15, Waymo at 1.16, and the US...

Simple 2-Item Menu
This Banh Mi shop does something few businesses have the guts to do. Their entire menu? Just two items: a...
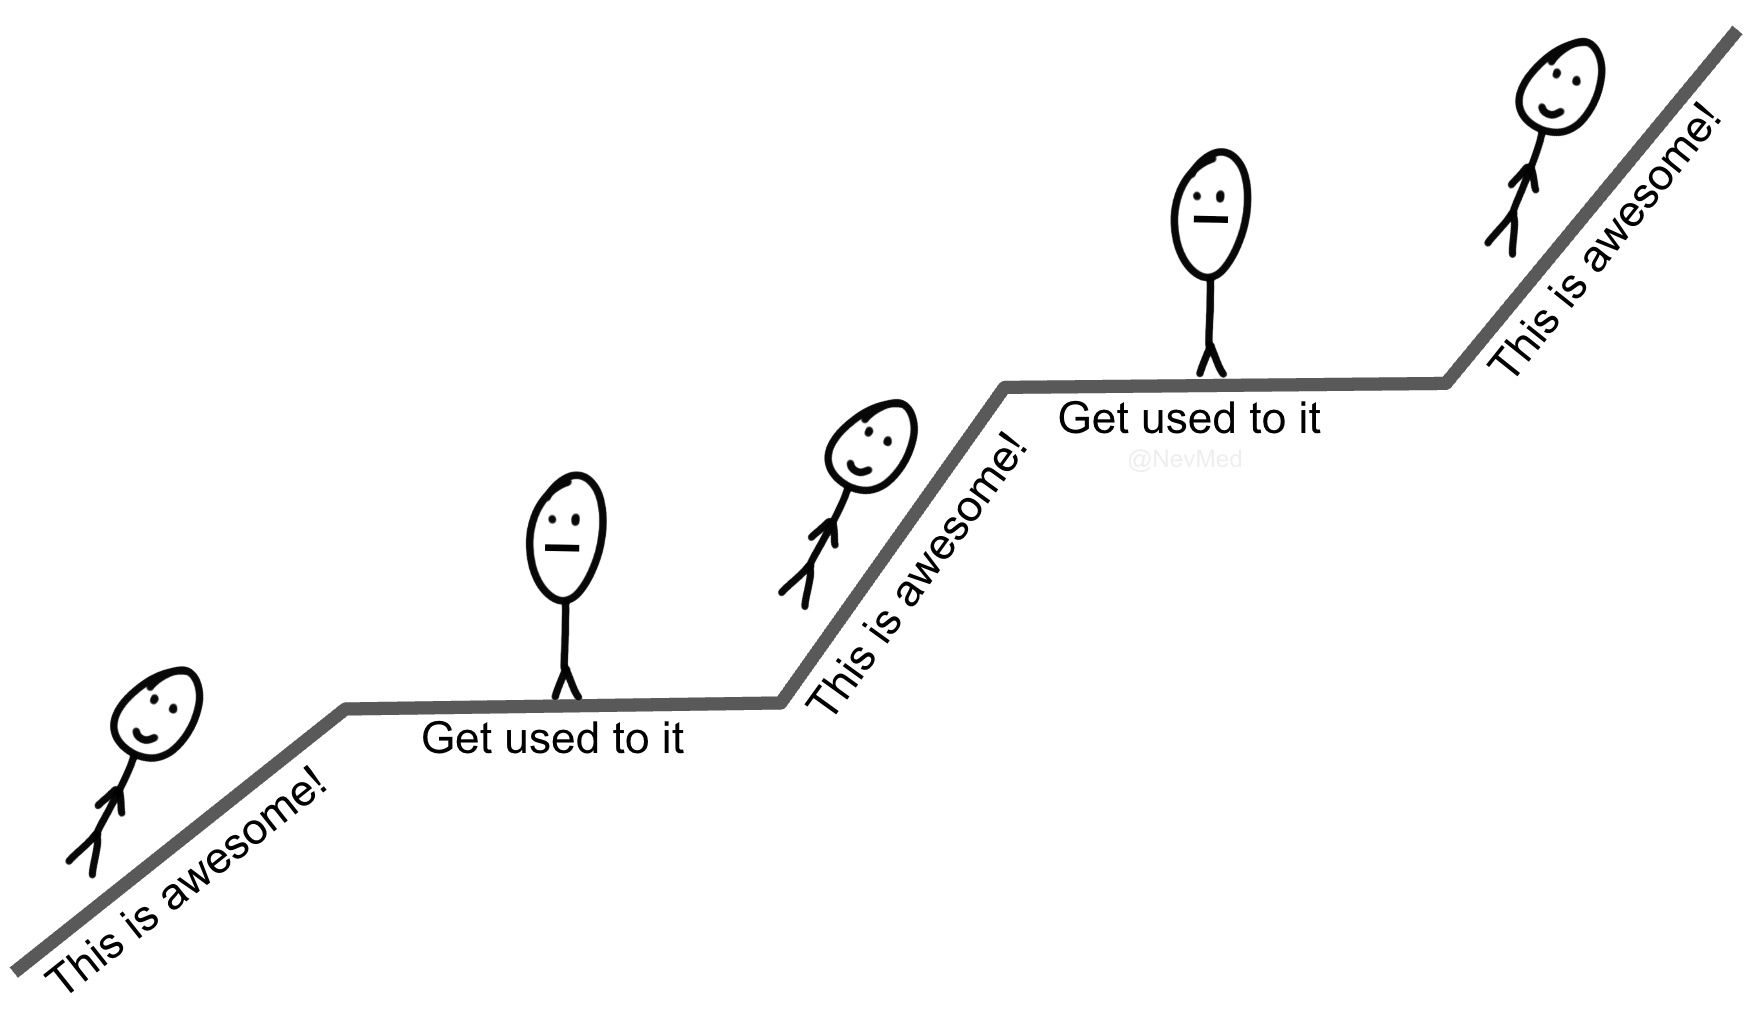
This is awesome ! --> Get used to it --> Repeat
Marketers can learn a ton from this stick figure chart. It’s the “hedonic treadmill” in action — that human tendency...

The Proof Economy - Hiring Builders not Bachelors
Look at that image. Tombstones for GPA, Dean’s List, SAT scores—all buried. Front and center? A sign that reads, “Now...
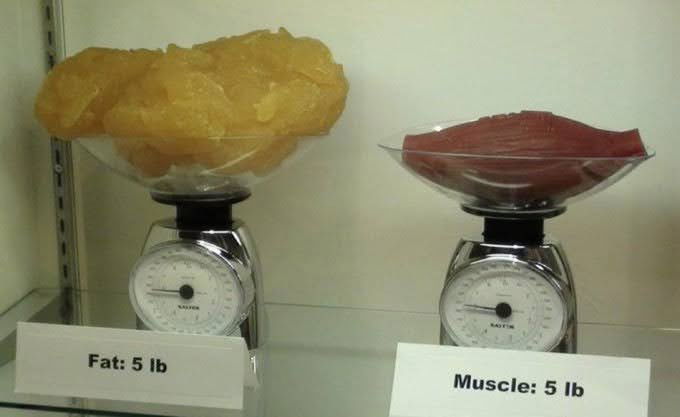
Fat vs Muscle visualization
Here’s a photo that fitness marketers have nailed for years. Two identical scales. Both hold five pounds. One’s filled with...

Simple social proof
This ad from Allied Outdoor Solutions nails what most marketers overcomplicate. Clean photo. Clear promise. One simple line: “The #1...

Sky King Mental Playground Podcast Studio
Sky King went from “generic podcast setup” to a full-on Japanese dojo vibe. The neon lights, wooden lattice ceiling, and...
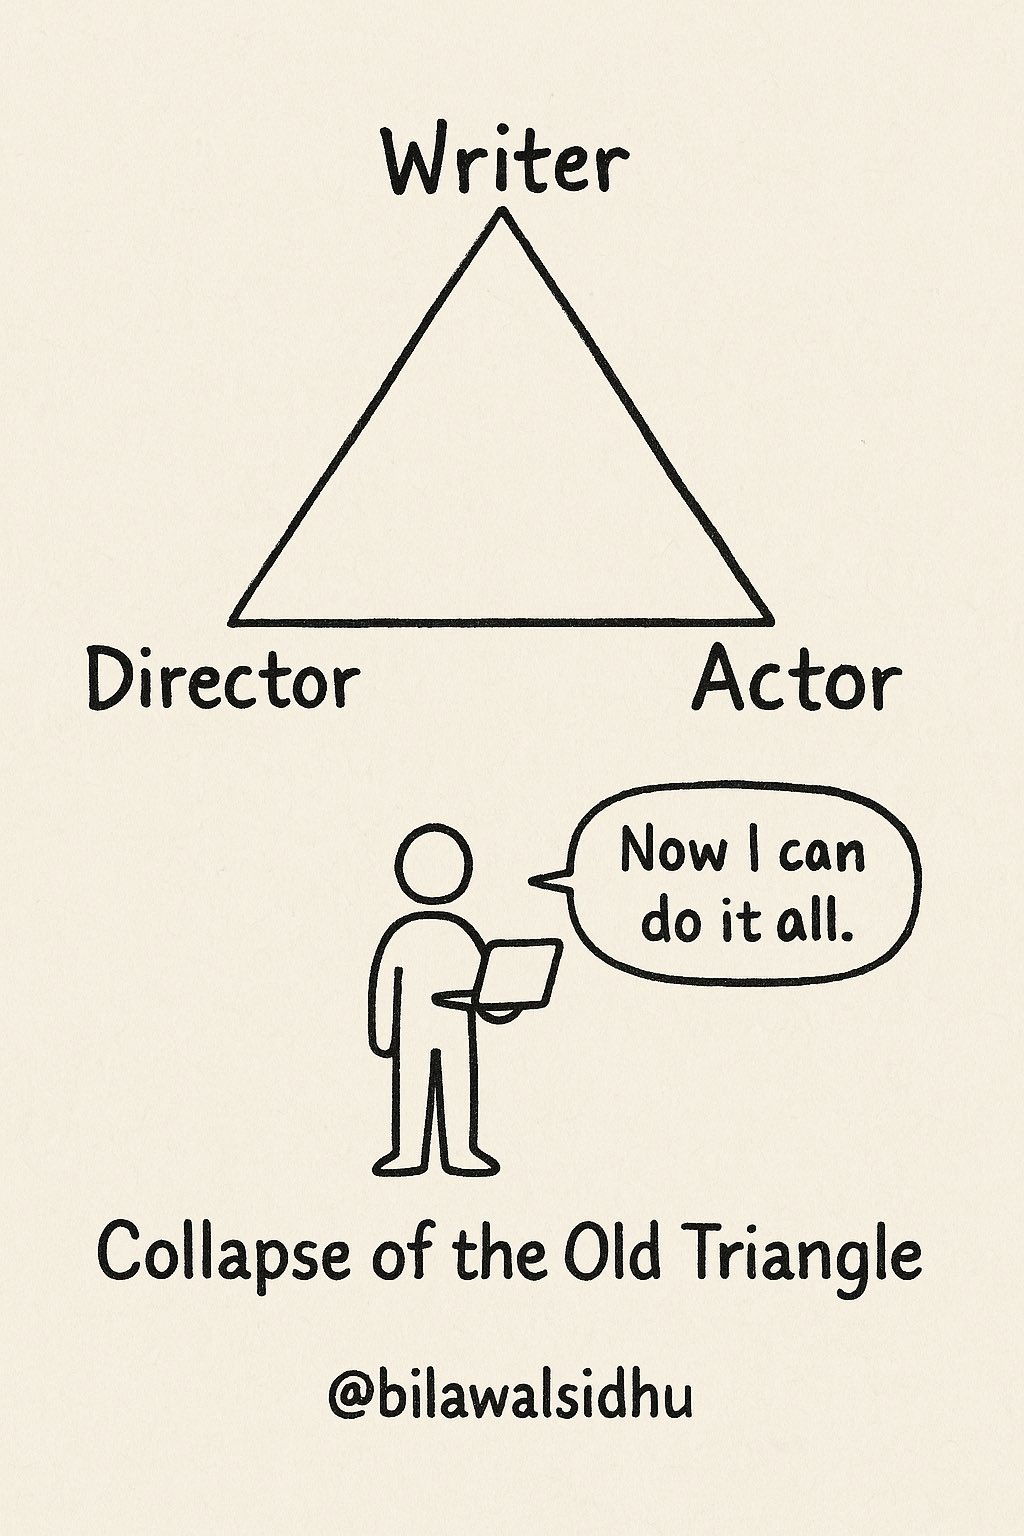
AI let’s anyone become the Director, Writer and Actor all in one
Remember when making a short film meant you needed a team—writer, director, actor? This sketch nails how AI is breaking...

Ethereum’s Roadmap
Vitalik Buterin’s roadmap for Ethereum’s privacy evolution is a lesson in how to communicate complex change without losing your audience....
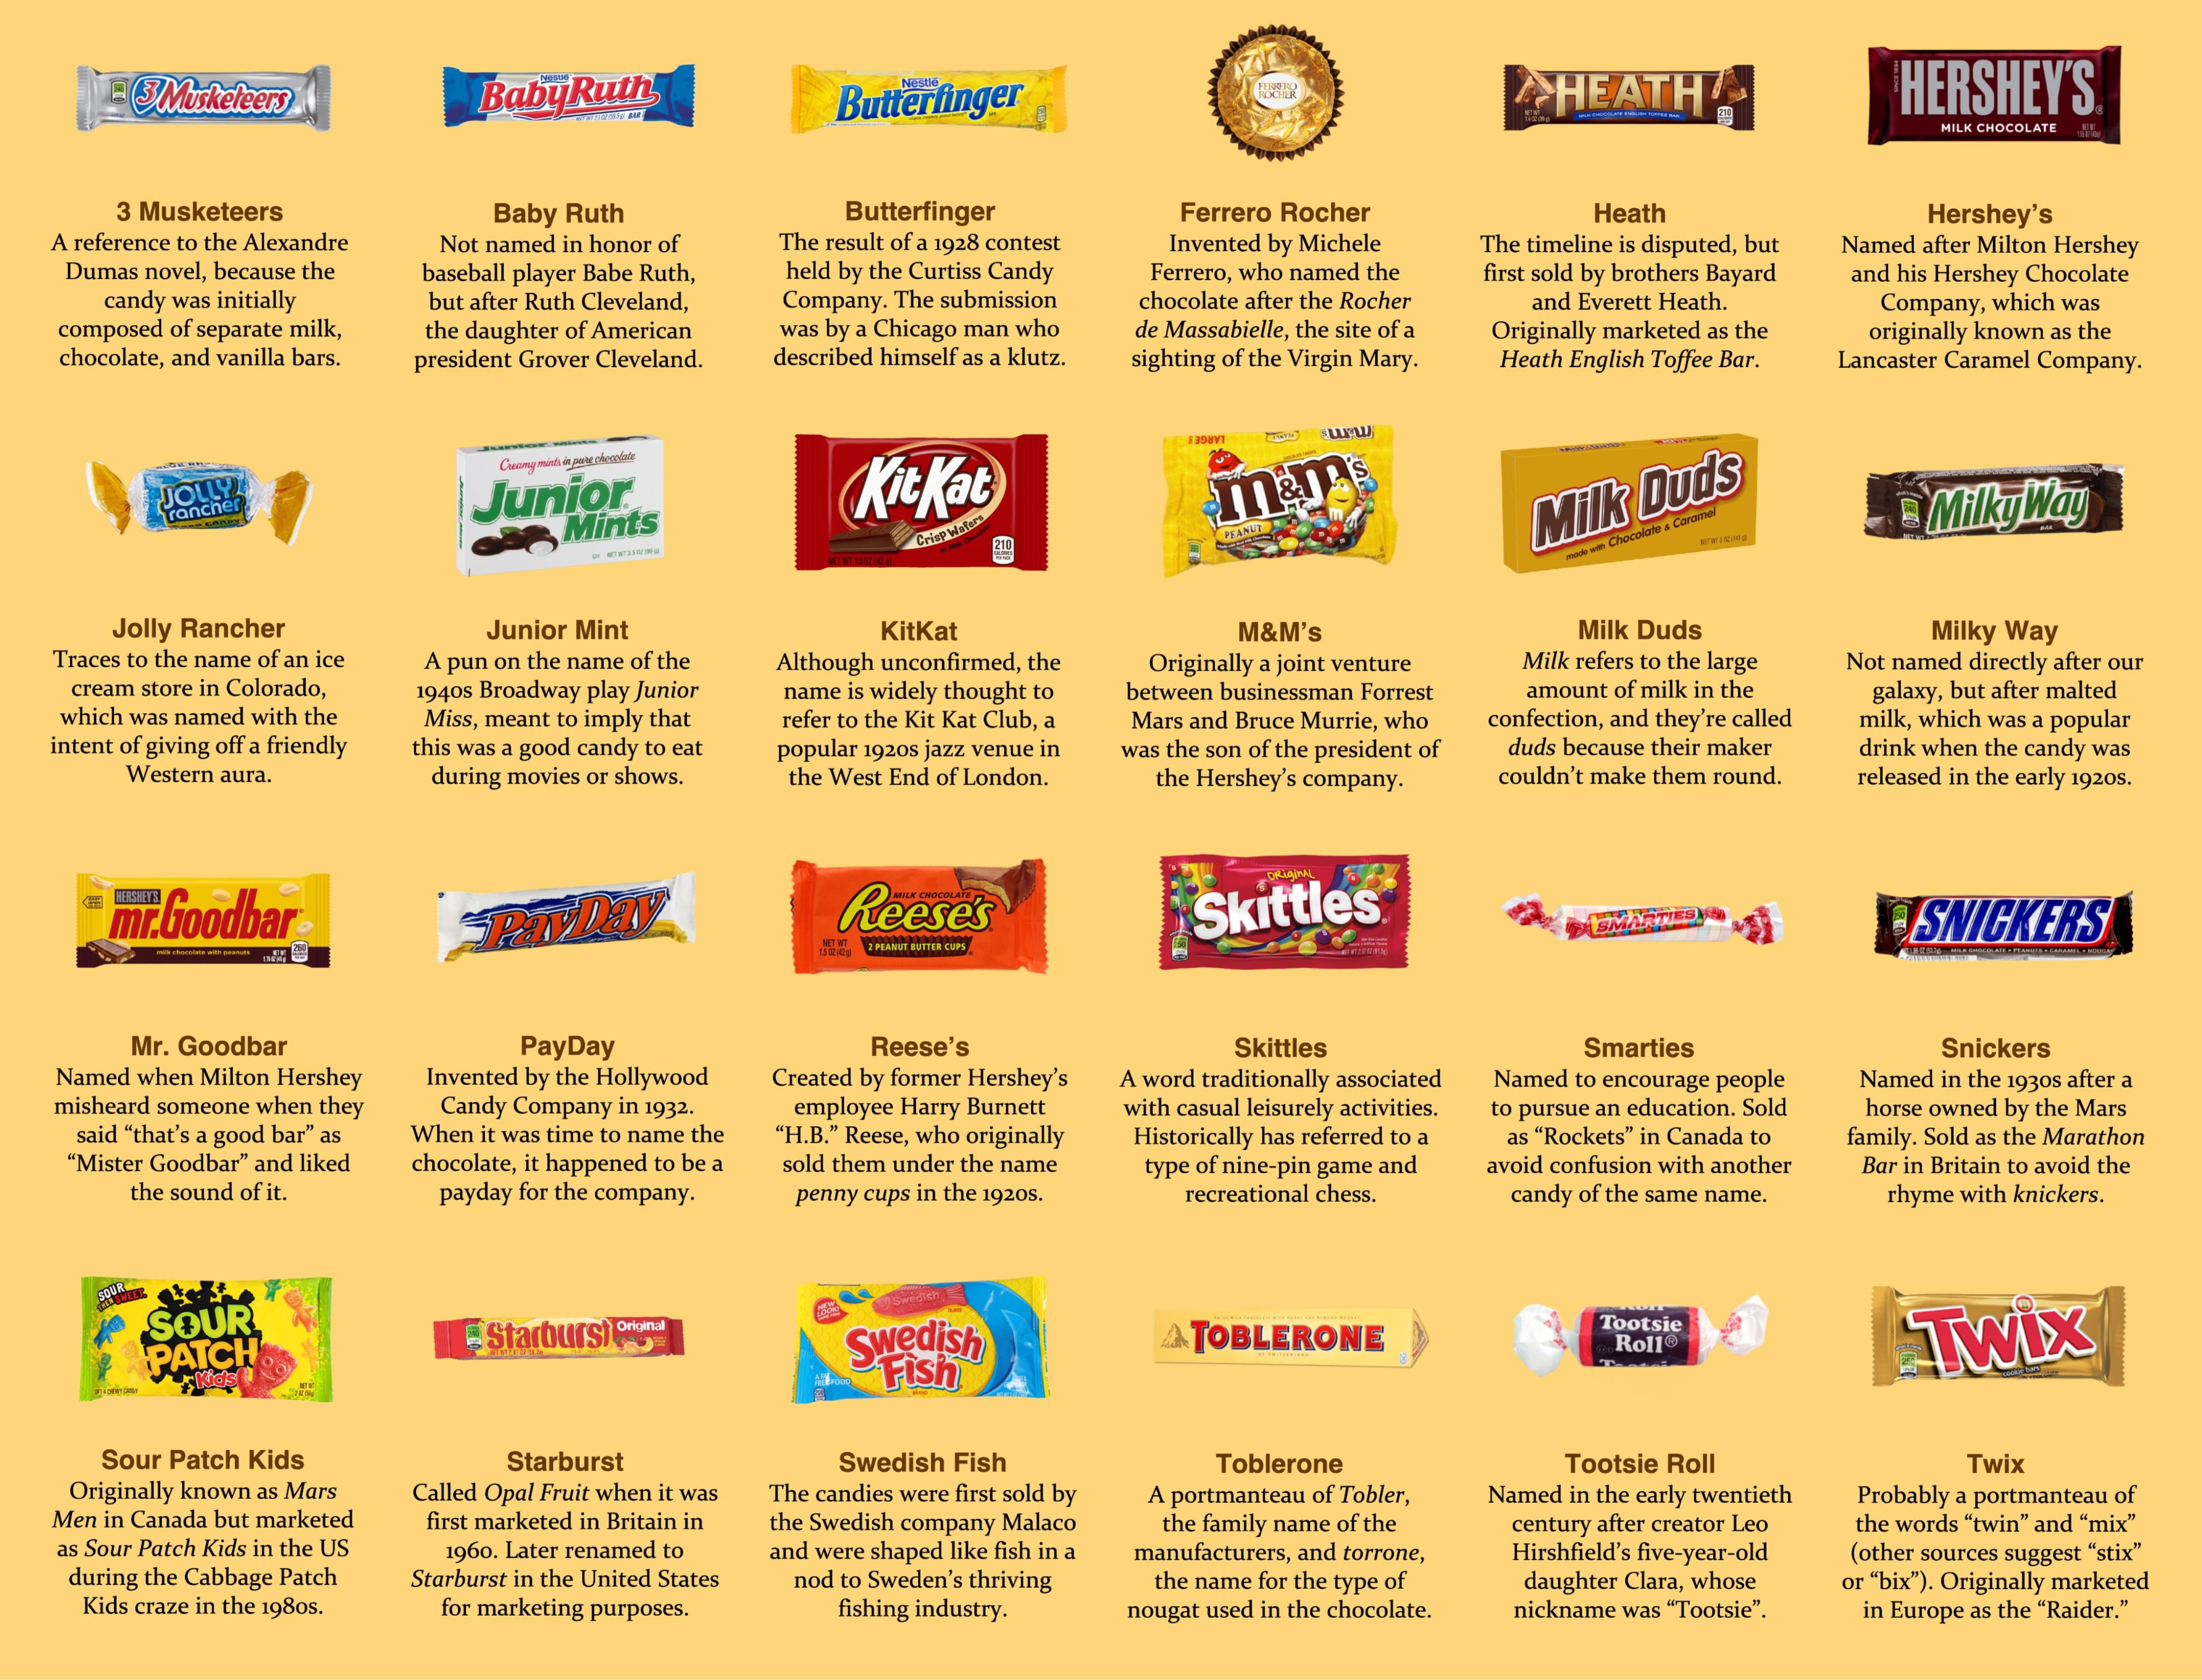
How popular candies got their name
Ever wonder why your favorite candy has its name? The secret is, those names weren’t random. Each one hides a...

DaxaBot Security Robot
Spotted this tiny “security bot” patrolling a construction site. It doesn’t talk, chase thieves, or call the cops. But it...

Every generation thinks kids are too distracted
Thomas Jefferson once warned that novels were rotting young minds. He called them a “poison” that made kids reject reason...
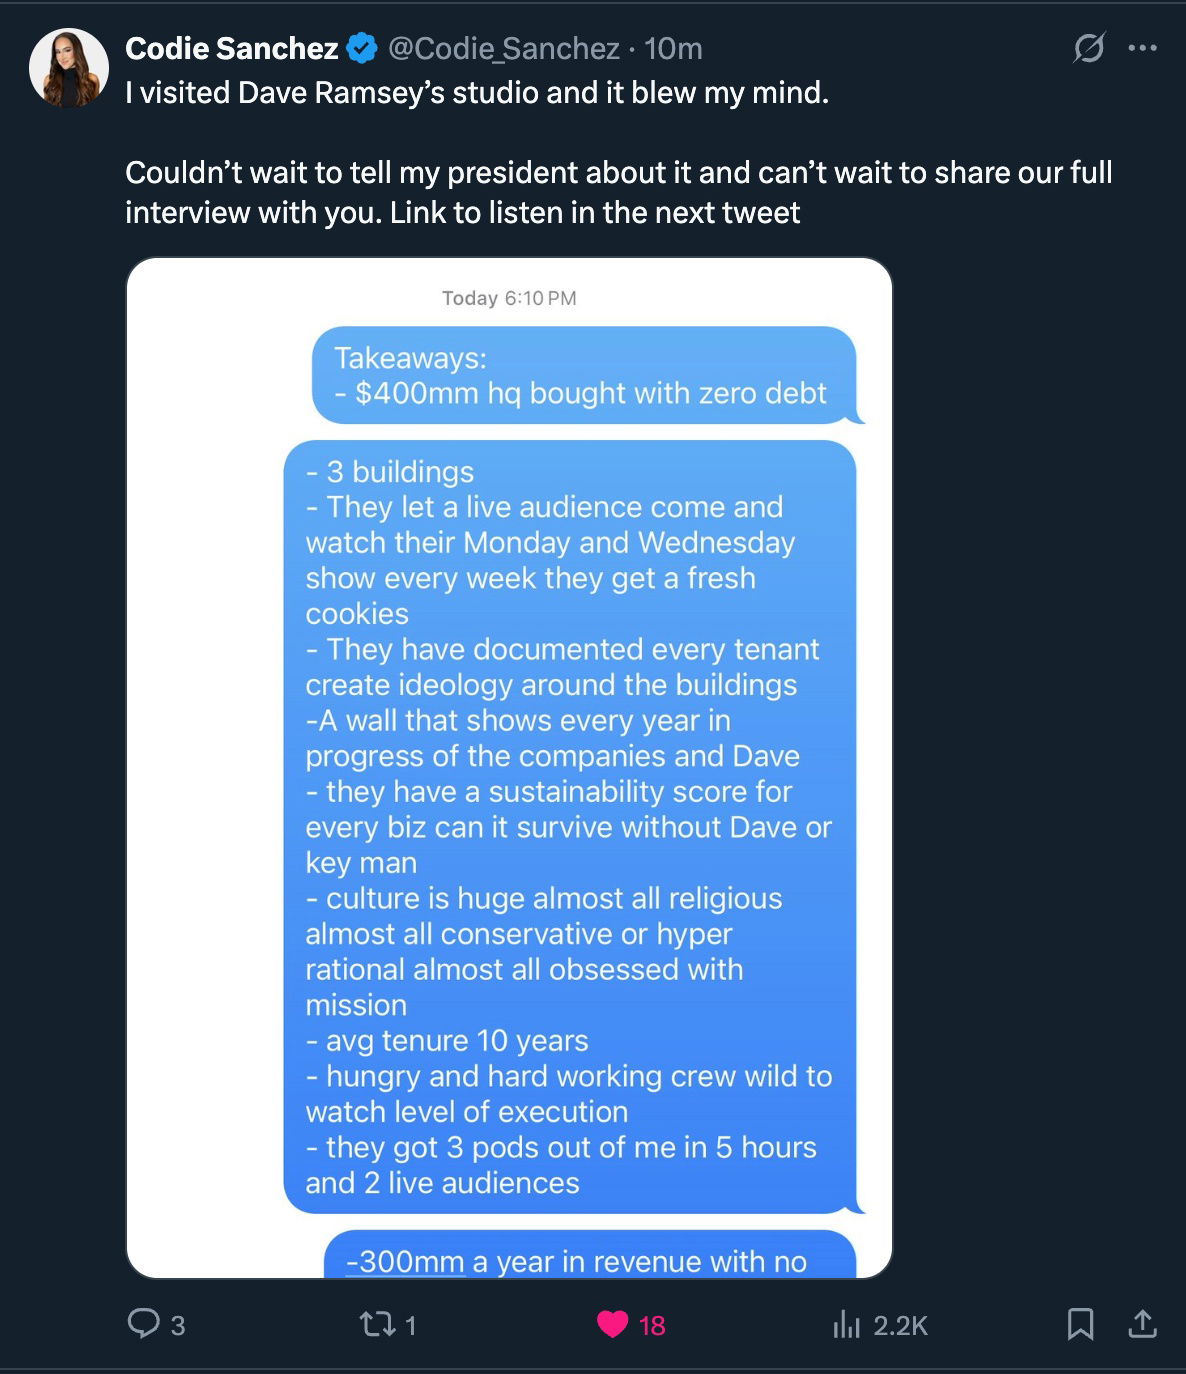
Codie Sanchez’s thoughts on how Dave Ramsey’s studio works
Codie Sanchez visited Dave Ramsey’s HQ and shared what she saw — a masterclass in mission-driven execution. Three buildings, live...

.png?width=3840&quality=80)