Black Friday + Cyber Monday Sales Graph
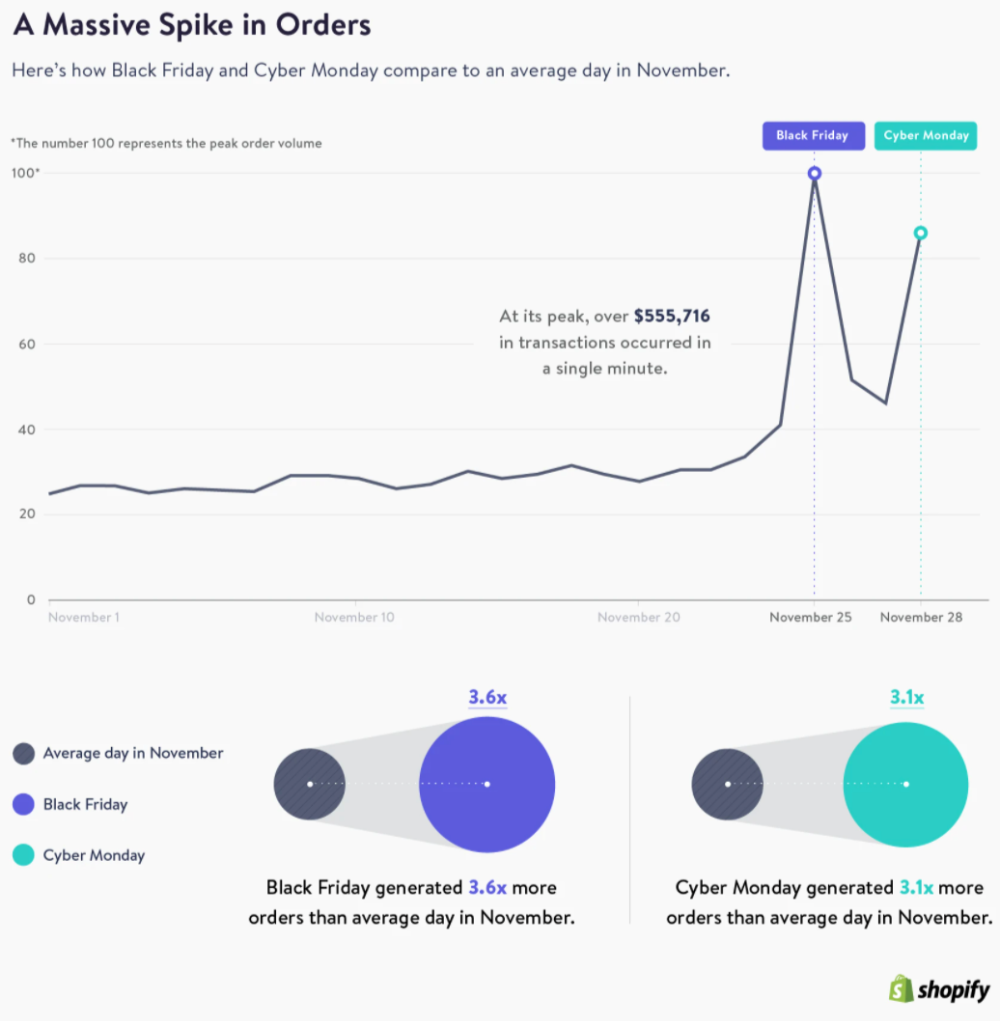
This graph shows the spikes in Shopify store sales seen on Black Friday and Cyber Monday compared to the rest of the month. Crazy!


For social proof sections I love the concept of showing a BIG NUMBER and smaller text explaining it. Like this...

Eight Sleep turns the Fourth of July into a clear buying moment with $200 off the Pod. Straightforward, timely, and...
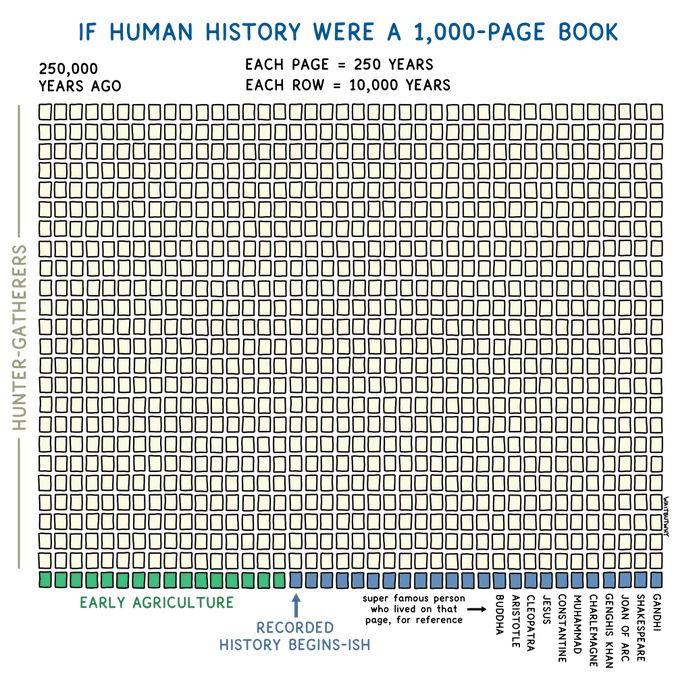
This cool chart from Wait But Why shows that if human history were a 1000 page book, only the bottom...

Here's a big ole list of all those weird holidays, one for each day of the year!

This treemap chart illustrates the proportions of chocolate exports from various regions around the world.
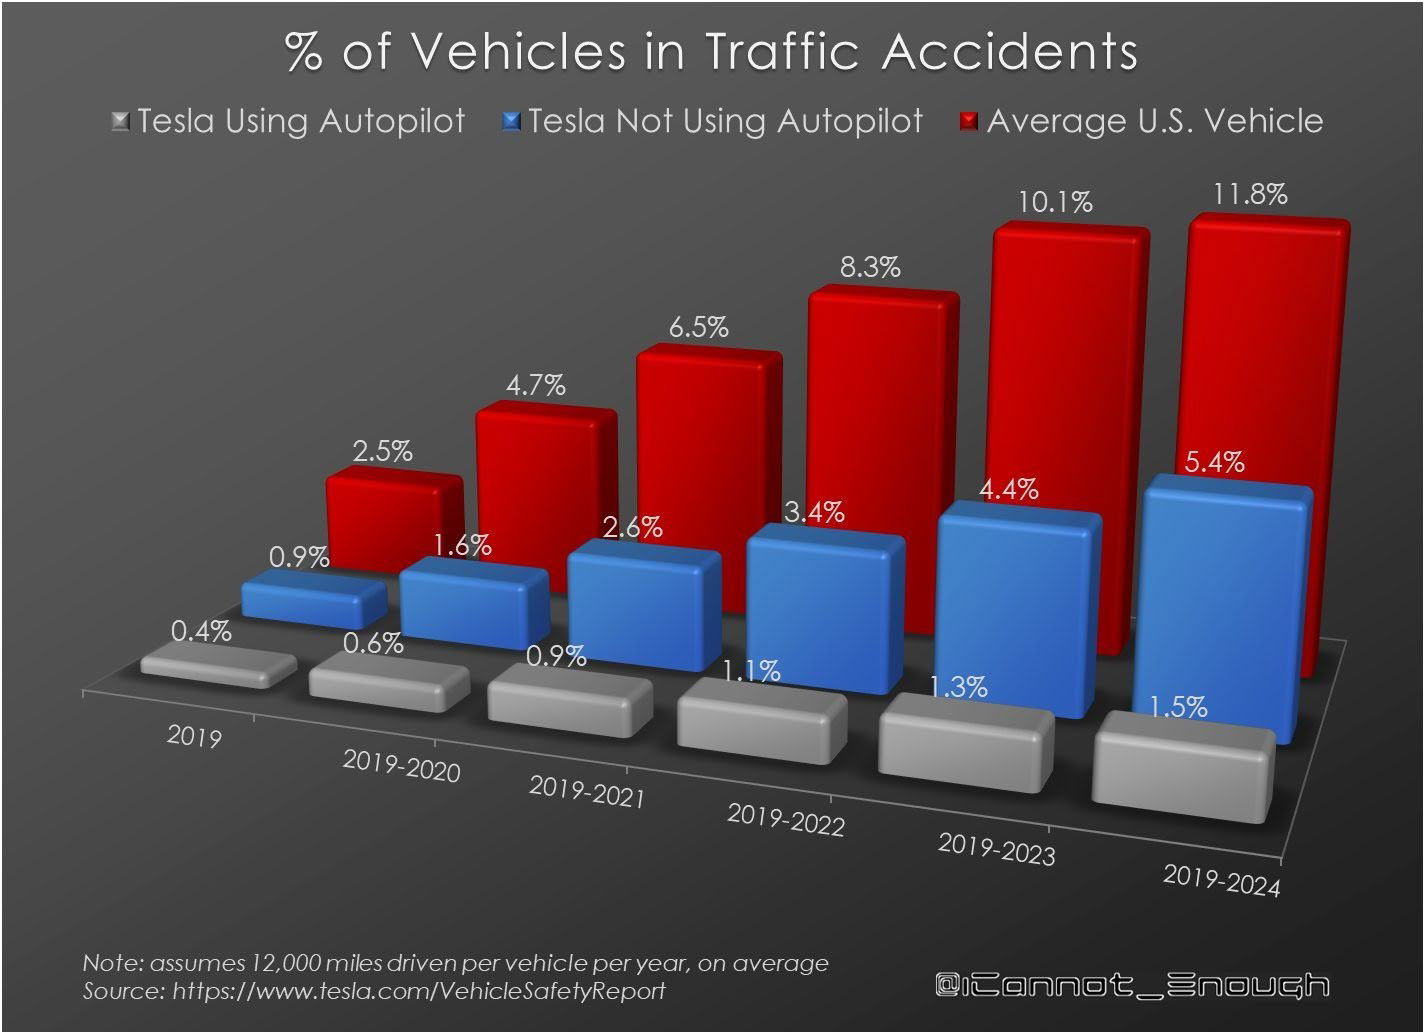
Sorted out by year this is the percentage of cars that get in traffic accidents while:- Normal driving (highest)- Driving...
Search for a command to run...