Dinner plate comparison sizes over the years
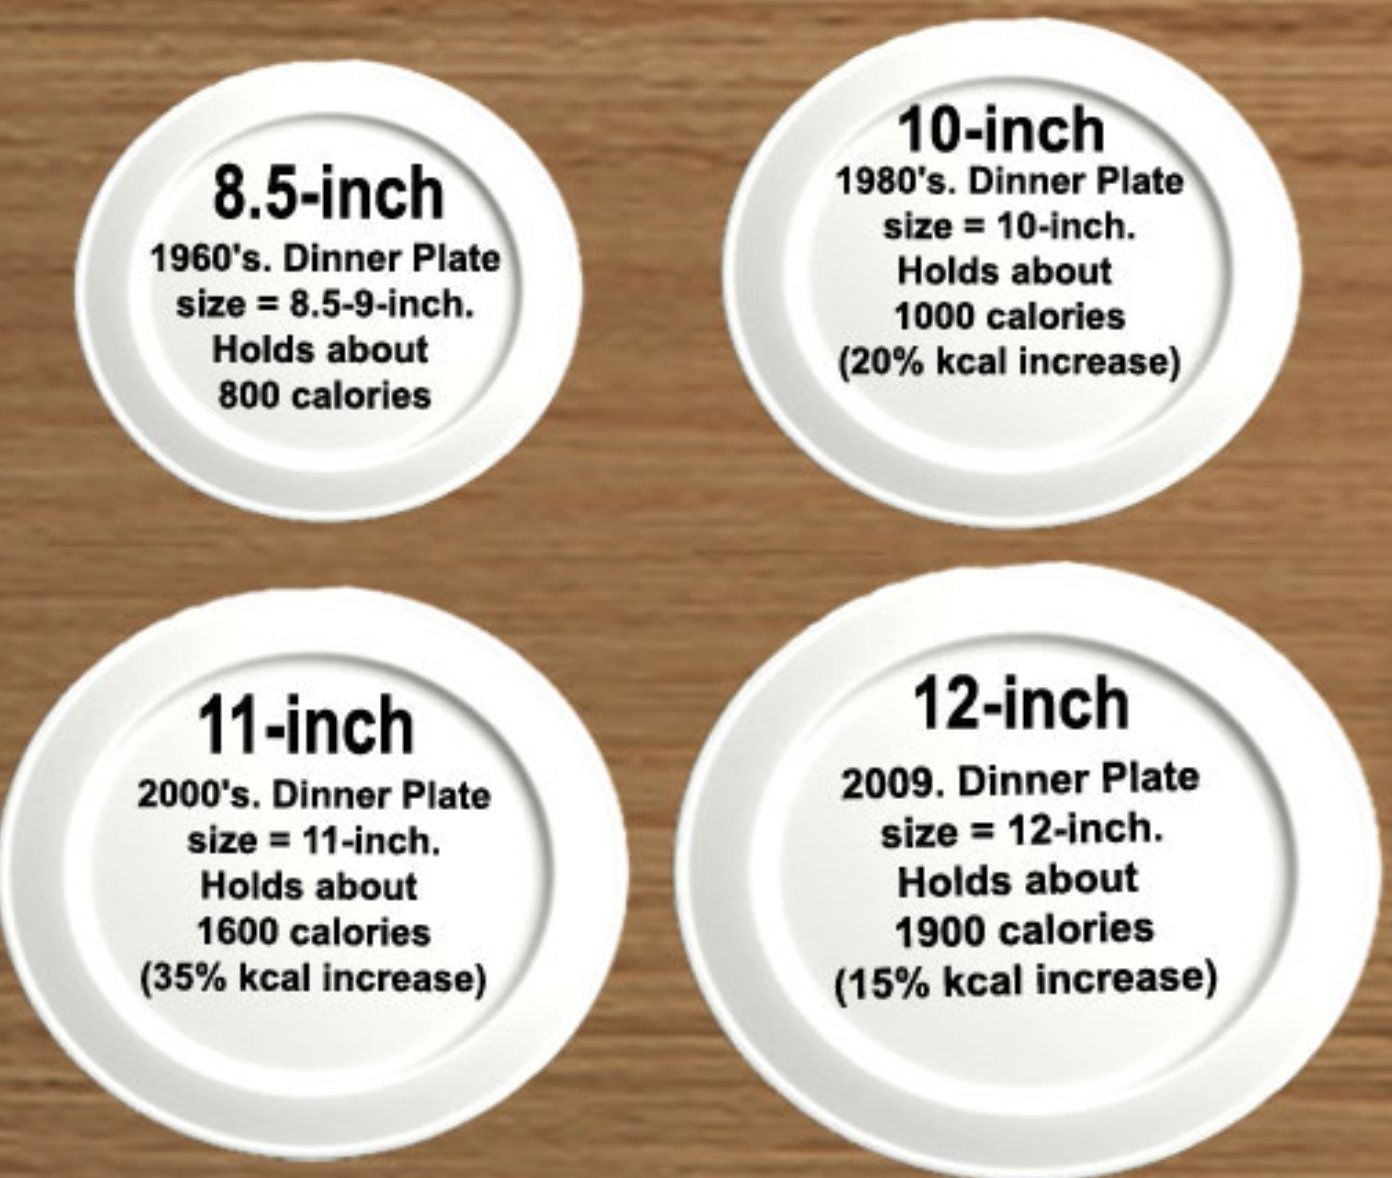
Look at this image: dinner plates have grown from 8.5 inches in the 1960s to 12 inches today. Calories nearly tripled just because plates got bigger.
The Marketing Analysis
This is Parkinson’s Law in action — the idea that something expands to fill the space available. In food, it's calories. In marketing, it's budgets, attention, and customer focus. Give yourself more room, and you’ll naturally fill it.
Why It Works
- People subconsciously fill “space,” whether it's a plate or an ad campaign.
- Constraints drive creativity.
- Bigger isn’t always better — it’s often just bloated.
- Visual framing changes perception of value and need.
Examples
- Twitter’s 280-character limit forces concise messages that hit harder.
- Apple’s product line stays tight — fewer options, stronger focus.
- Google’s homepage stays blank, focusing all attention on search.
Analyzed by Swipebot
Loading analysis...