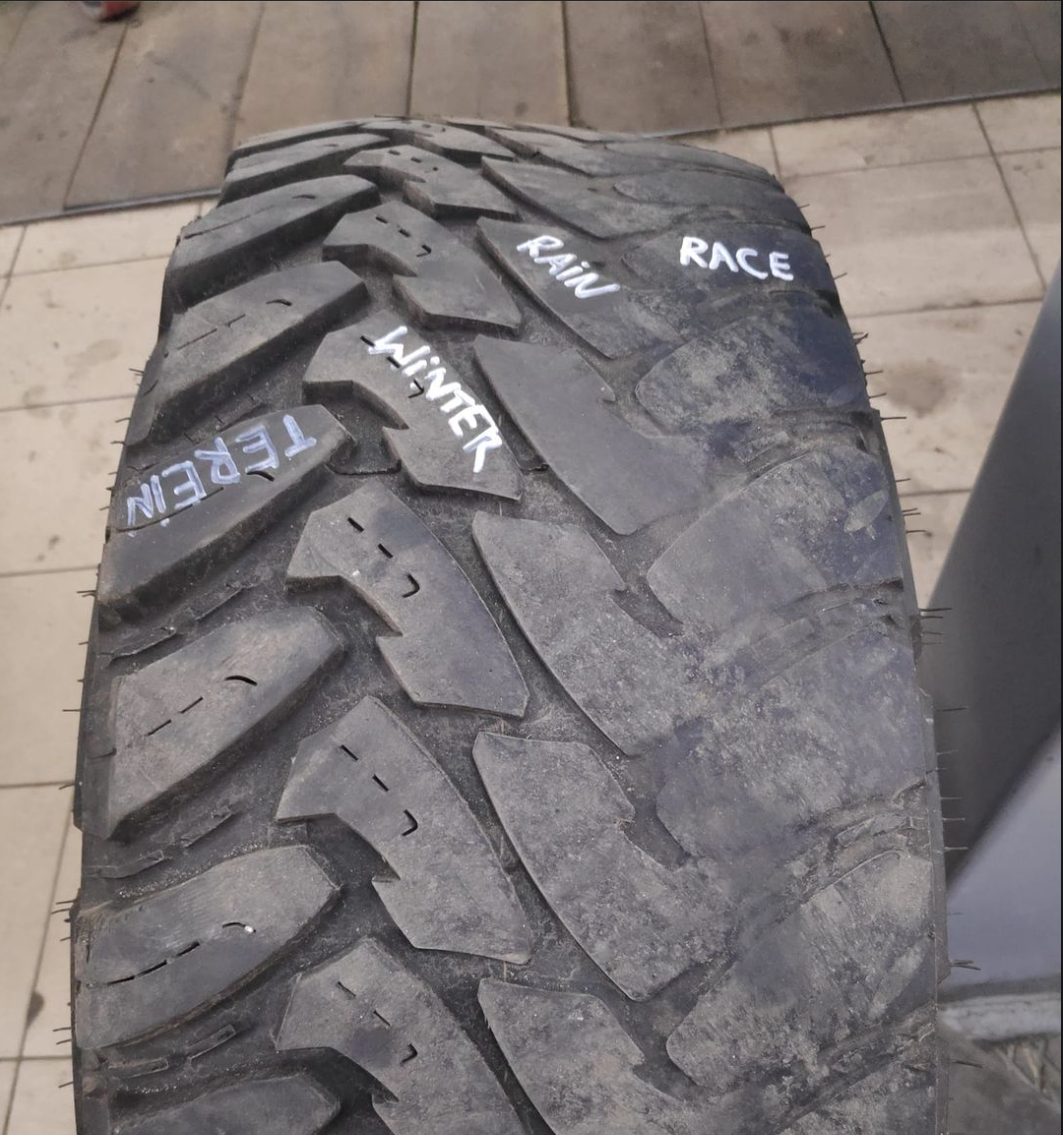
A mechanic labeled one tire with words like “Terrain,” “Winter,” “Rain,” and “Race.” Just one glance and you instantly get what each tread type does. No long article, no jargon. Just smart visual teaching.
Why it works
- Shows, doesn’t tell — visual beats verbal every time
- Simplifies a complex topic into one clear image
- Uses contrast: rugged vs smooth textures = clear comparison
- Instant comprehension = shareable content
Real-world examples
- Apple product shots: show features with lighting, not paragraphs
- Airbnb: uses photos to demonstrate the “feeling” of staying there
- Dollar Shave Club: video demo makes “cheap but quality” obvious
- IKEA manuals: pictures guide assembly, no language barriers
Simple visuals + clear labeling = instant understanding.
Analyzed by Swipebot
Loading analysis...
