Impactful Timeline of Events
Updated on
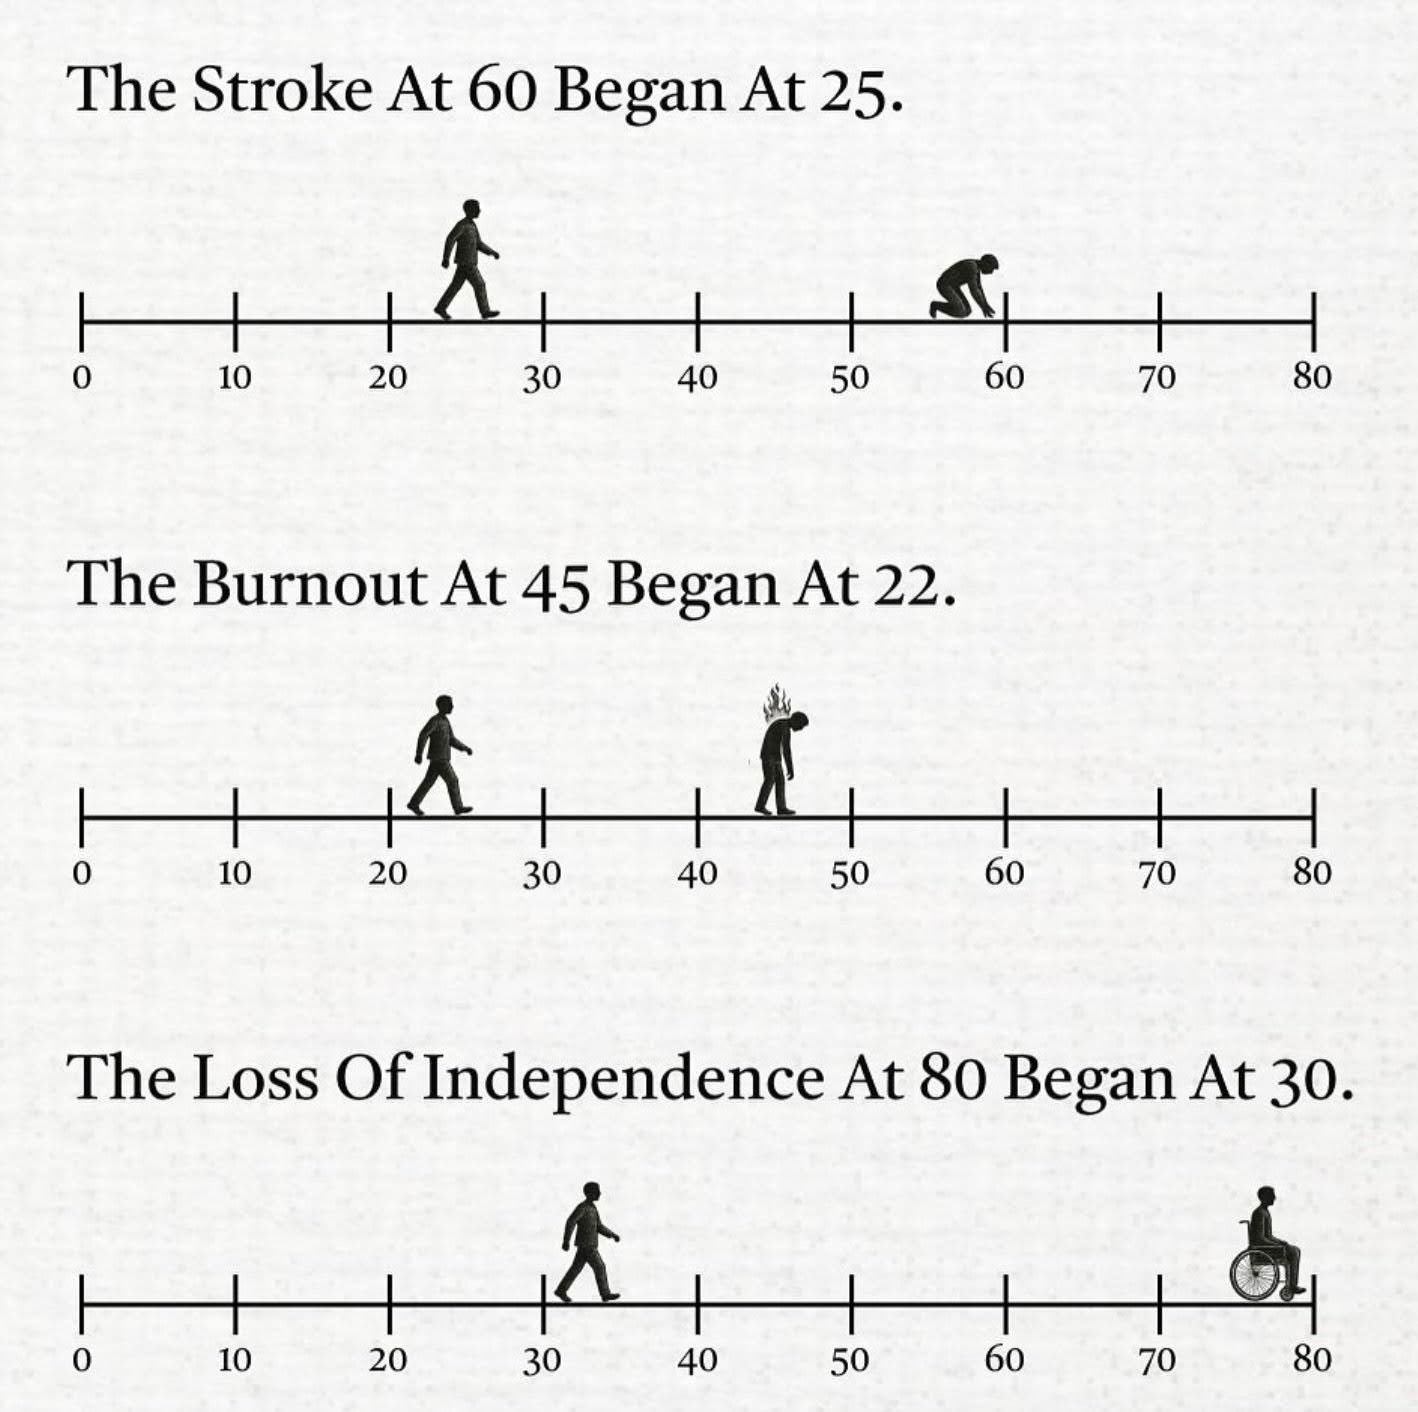
This graphic hits hard because it reveals a simple truth: problems don’t start when we see them—they start way earlier. That same logic works in marketing, health, or business.
The Visual Lesson
Each timeline shows a long-term consequence traced back to early habits. A stroke at 60 starts at 25, burnout at 45 starts at 22. The hook? It's not fear—it’s awareness. The design makes the delay between cause and effect painfully obvious.
Why It Works
- Visual storytelling makes the abstract (time) feel real
- Contrast between age points builds tension
- Simple design focuses attention on the takeaway
- Implied urgency without shouting “Do this now!”
Real-World Parallels
- Financial apps show how early investing compounds decades later
- Fitness brands use “start now” timelines to illustrate longevity gains
- SaaS onboarding flows highlight cost savings over time
Analyzed by Swipebot
Loading analysis...
.png?width=3840&quality=80)