When Should I Replace My [Kitchen Stuff]
Updated on
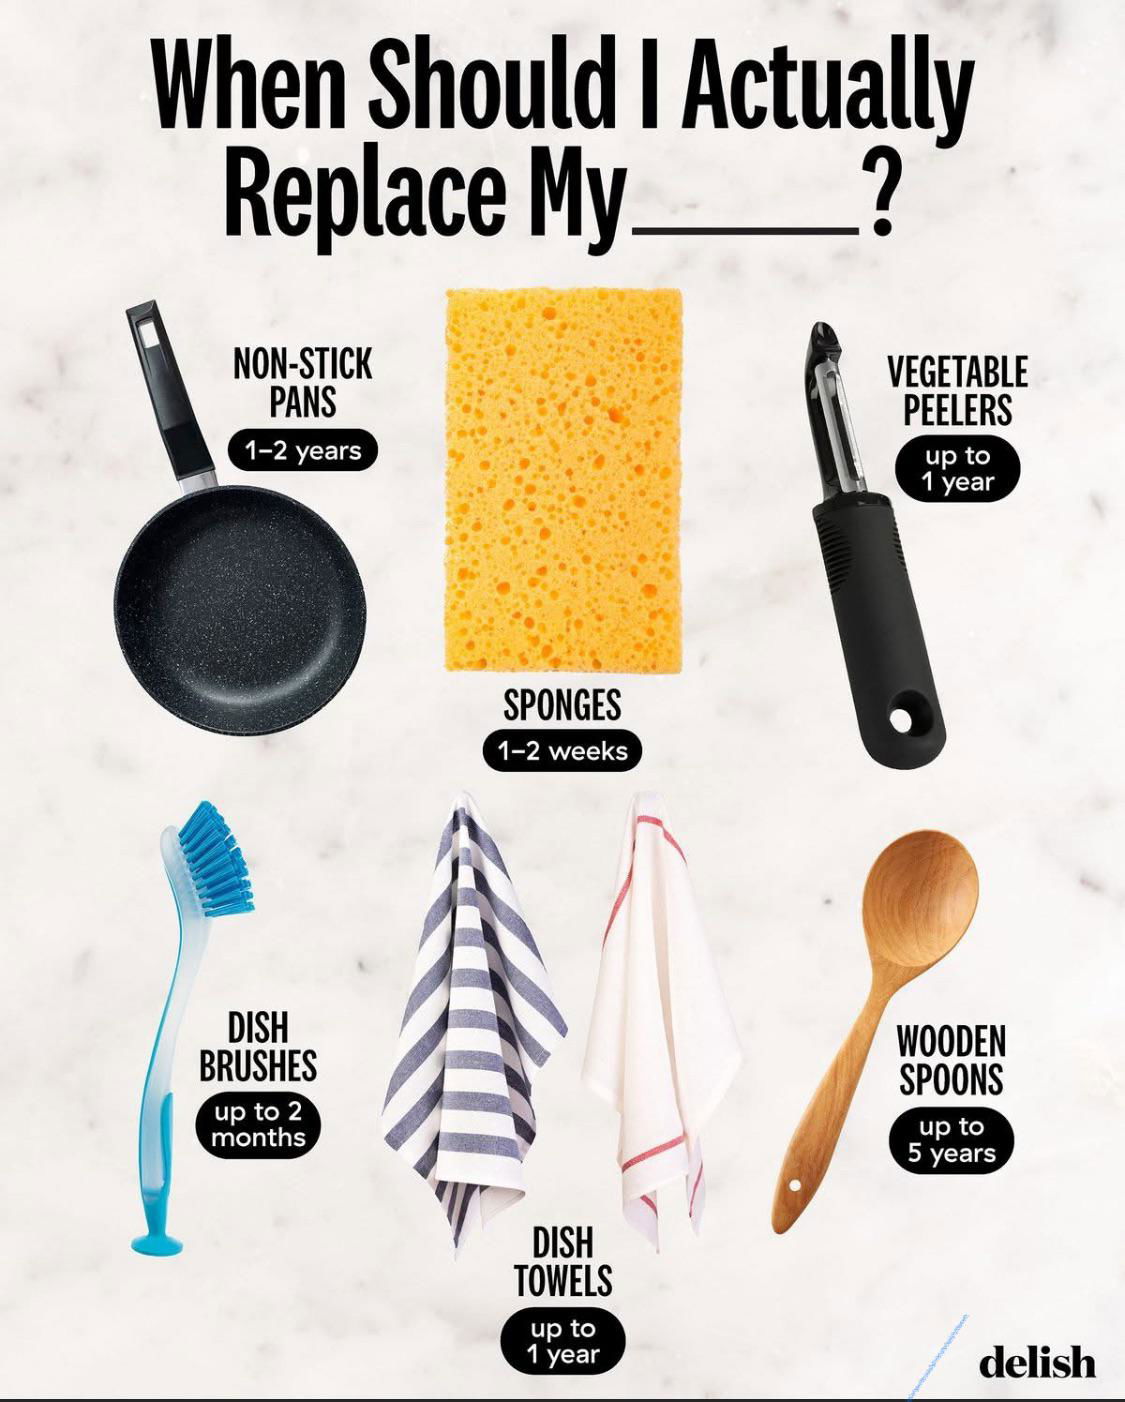
This simple graphic nails it: it answers a question people actually have, fast. No text walls. No fluff. Just clear visuals + quick data. Perfect swipeable content.
Why It Works
- Answers a real question: People literally Google “how often should I replace my sponge.”
- Visual clarity: Each item gets its own spot, no reading required.
- Time-based hook: “When to replace” adds urgency and practicality.
- Evergreen info: Always relevant, easy to reshare.
Examples
- BuzzFeed uses list graphics to turn mundane facts into viral posts.
- Healthline simplifies nutrition tips using clean charts.
- IKEA posts timelines for product care, driving repeat engagement.
- Whole Foods shares “how long food lasts” grids that rack up saves.
Analyzed by Swipebot
Loading analysis...