This graphic taught me a lot….I didn’t realize what young men the Founding Fathers of the United States were. Kind of mind blowing!


This chart shows that the top 50% of New Yorkers paid 99.8% of income taxes in 2023.

To me, an image like this packs in a lot of data in a very easy-to-understand method.

A simple chart with unemployment and "underemployment" rates by college major makes this data visually interesting by making the bar...

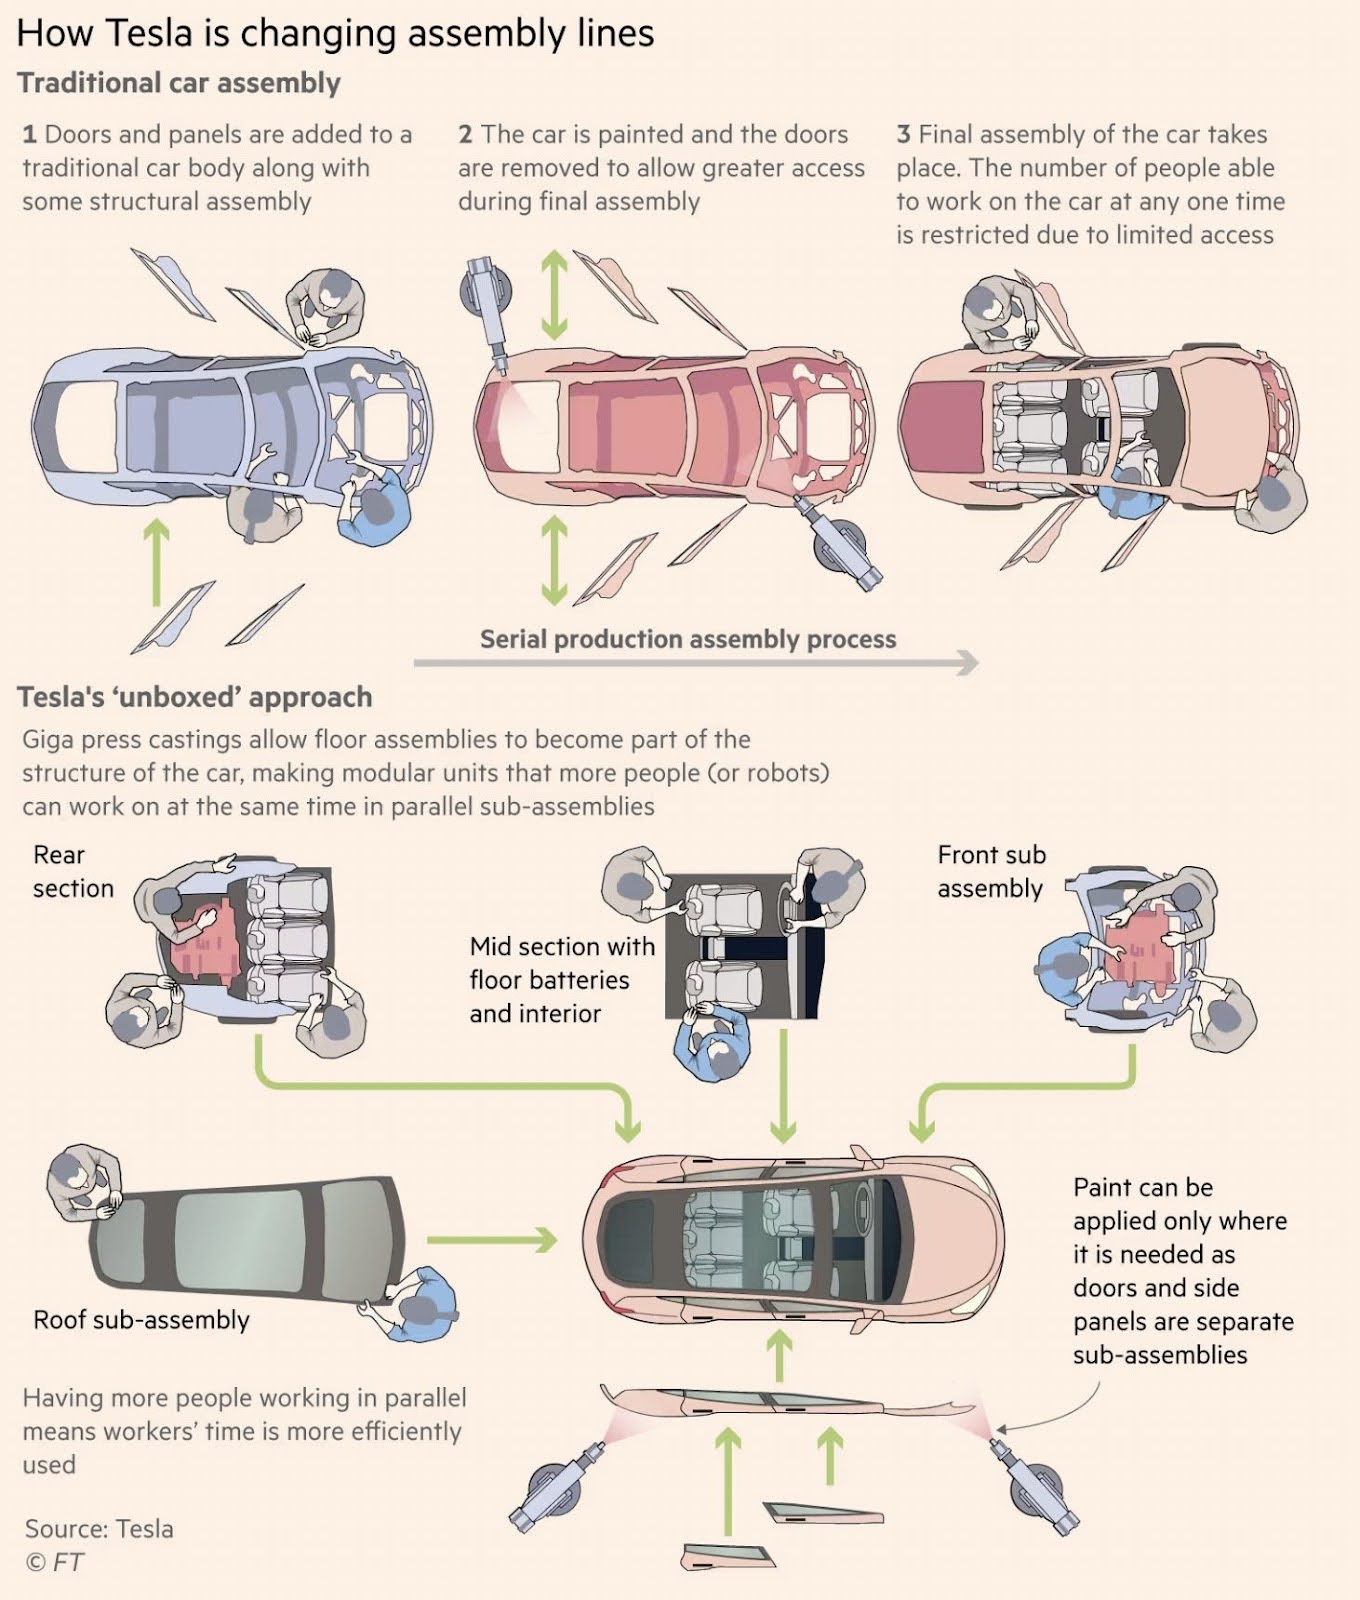
Illustrations showing difference between traditional assembly lines and Tesla "unboxed" approach.

This treemap chart illustrates the proportions of chocolate exports from various regions around the world.

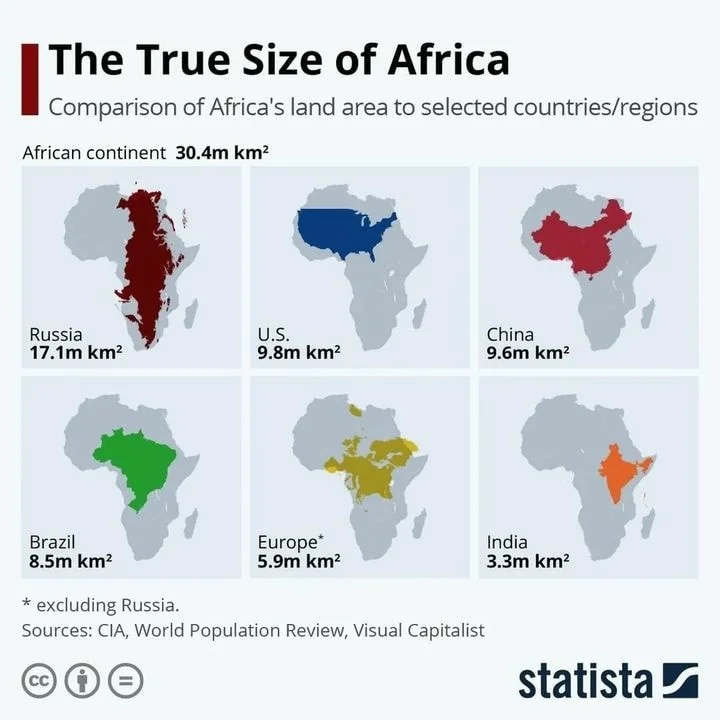
I love when a single graph or chart can update how you think about something. It's quite shocking to know...
Search for a command to run...