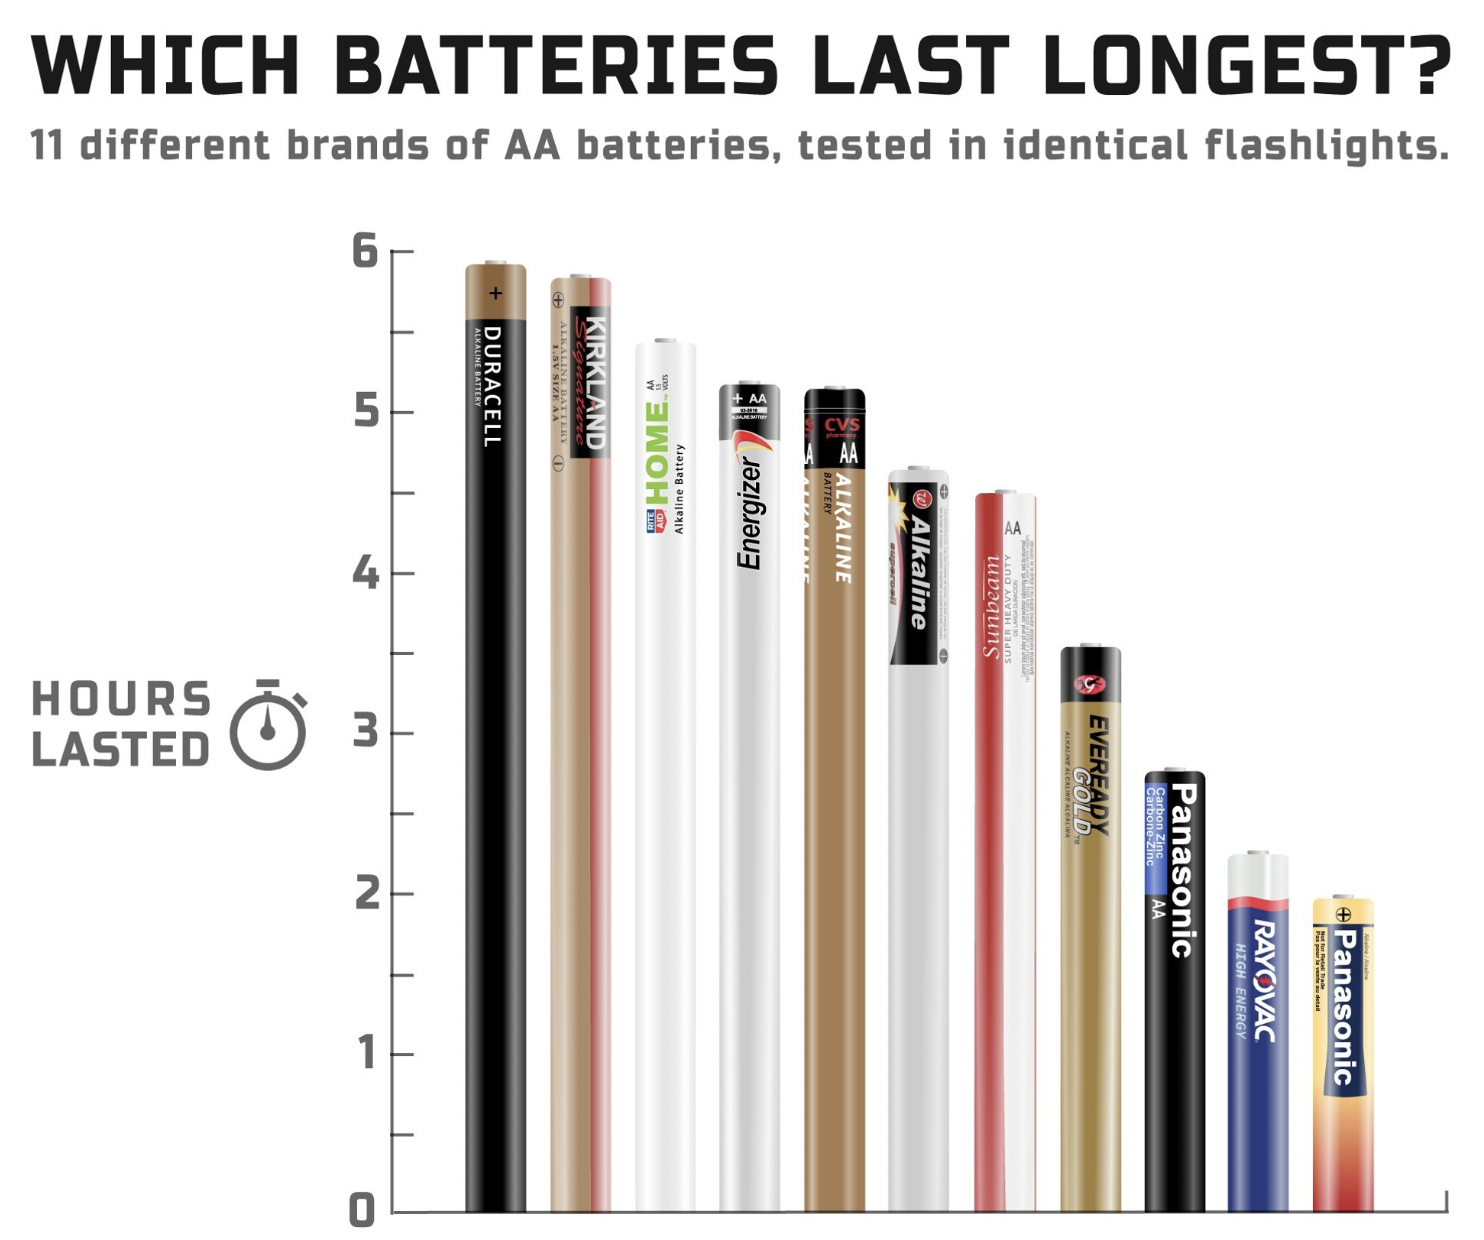
This “Battery Bar Chart” turns a dull stat graphic into something you instantly get. Instead of colored bars, it uses the actual AA batteries as the bars. Genius.
Why it works
- Visual metaphor makes data instantly understandable
- Real product images grab attention faster than abstract bars
- Easy comparison drives the viewer’s curiosity
- Fun twist gives a dry test some personality
Examples
- Apple uses real product shapes in performance comparisons (iPhone speeds, chip charts).
- Spotify Wrapped turns plain listening data into colorful stories worth sharing.
- Google Trends visualizes data with relatable graphics (spike illustrations, icons).
- Gatorade often shows charts shaped like bottles to highlight endurance results.
Simple tweak, big impact.
Analyzed by Swipebot
Loading analysis...
