
Easy to see a timeline showing the history of innovation along with a graph illustrating the global average GDP per capita over the long term.


This treemap chart illustrates the proportions of chocolate exports from various regions around the world.

This chart shows how American went from bringing in revenue from manufacturing in 1990 to bringing in revenue from healthcare...
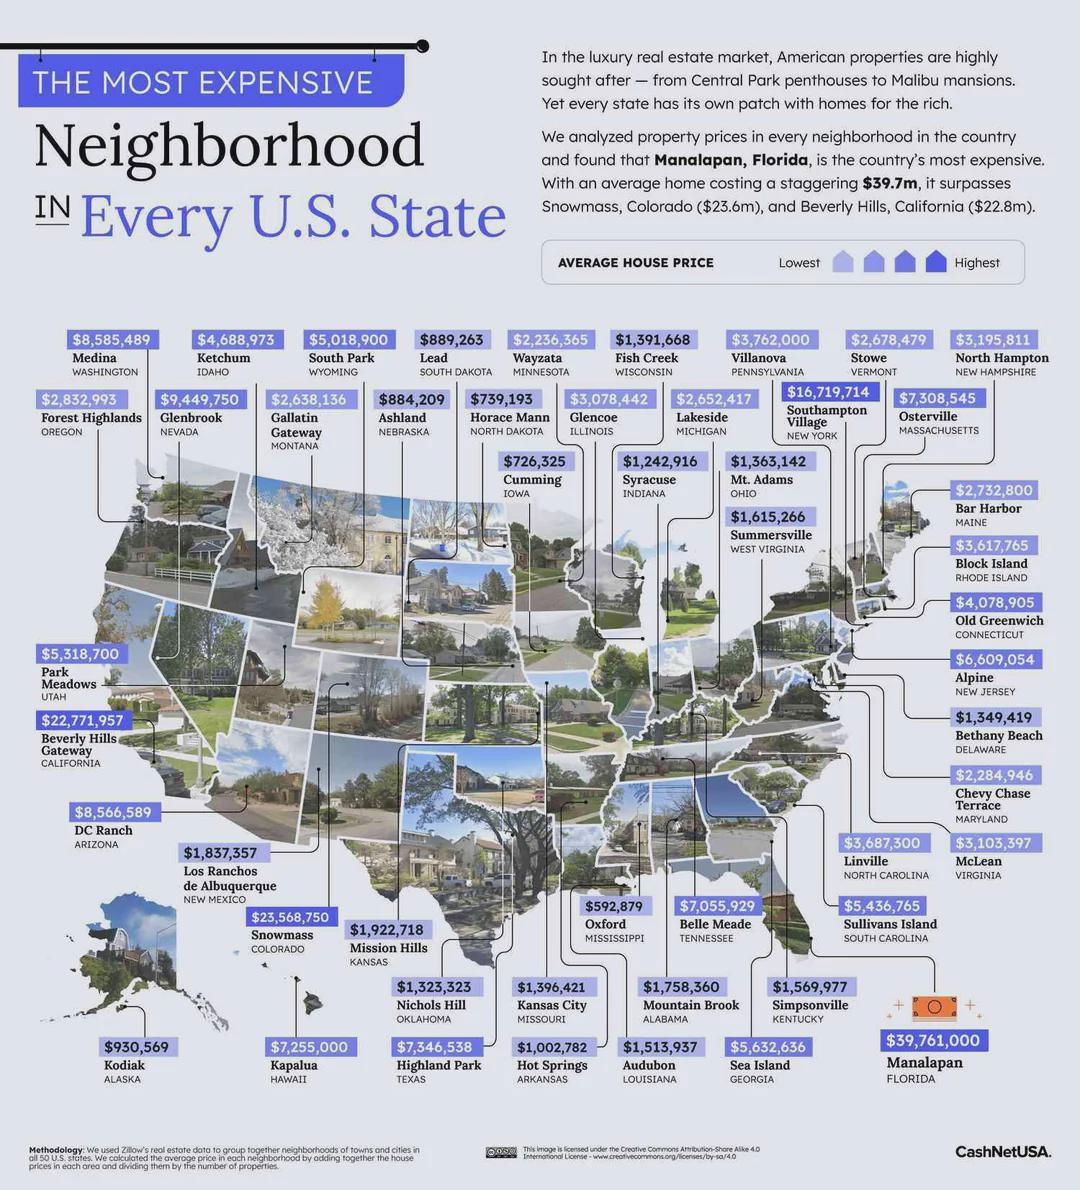
This is an interesting approach to listing out the most expensive neighborhoods in each state: By showing a map but...
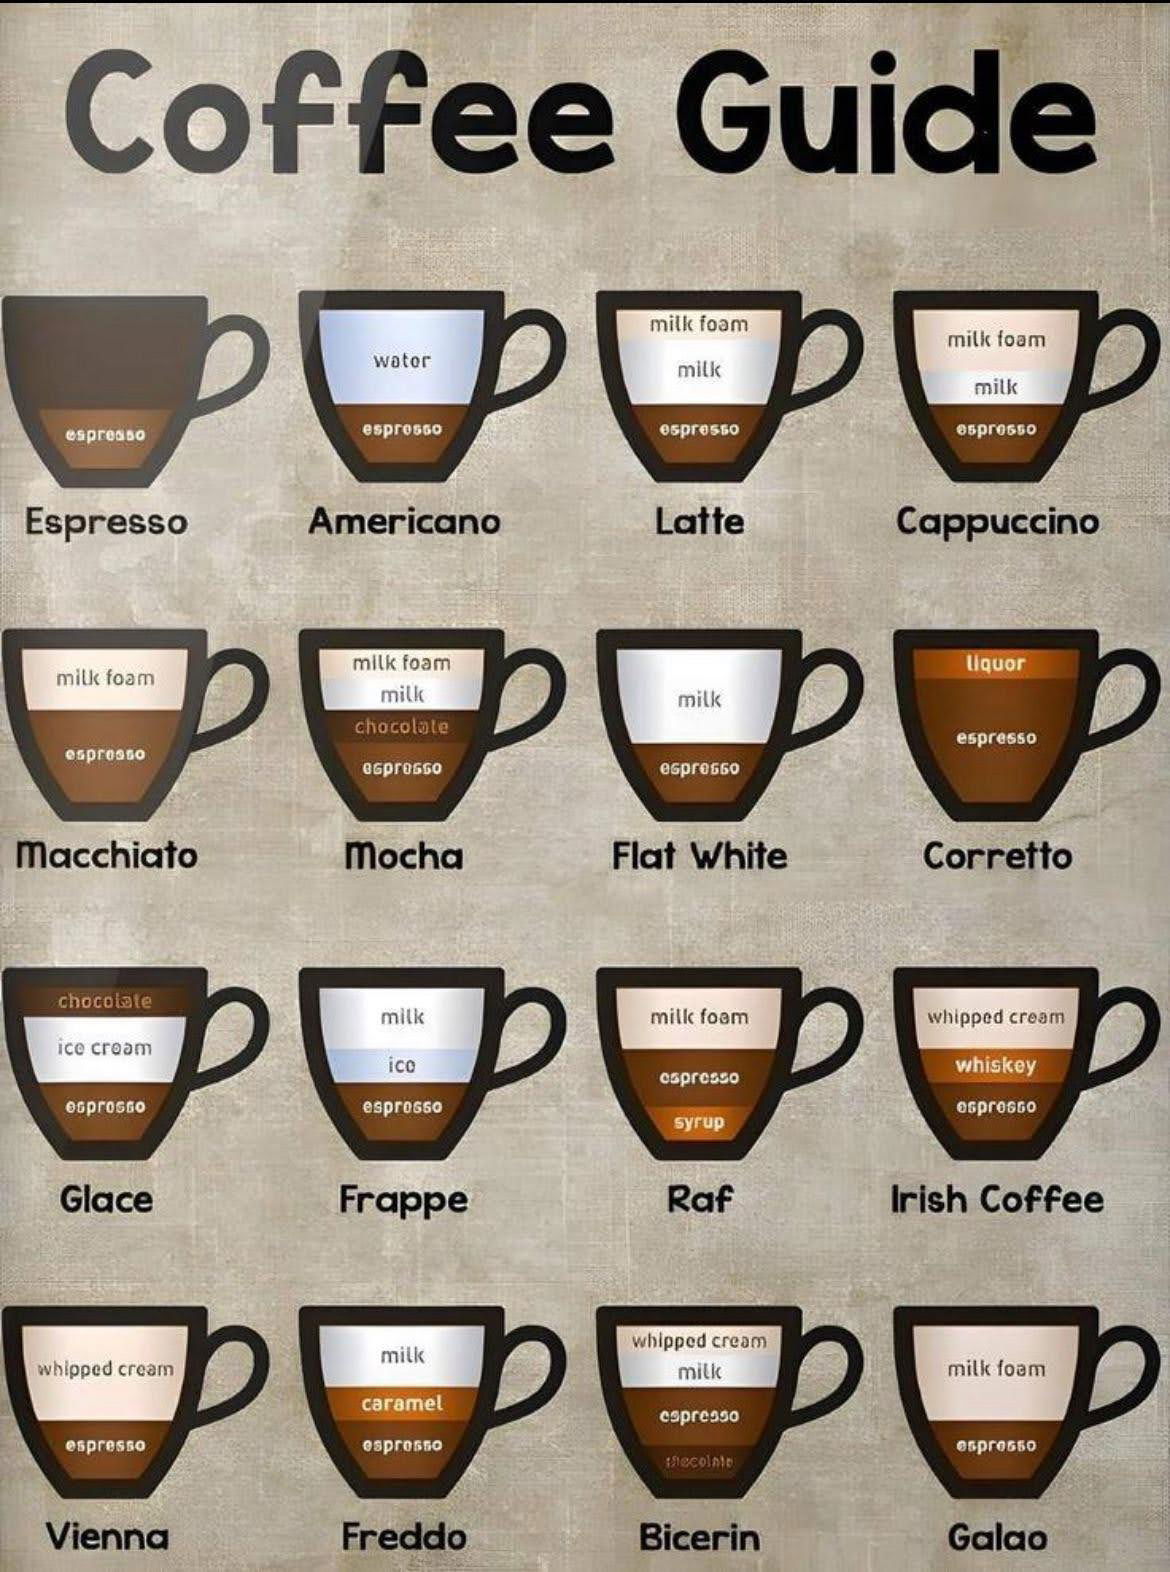
A simple, visual breakdown of 16 popular coffee drinks. This chart helps anyone order (or make) their perfect cup
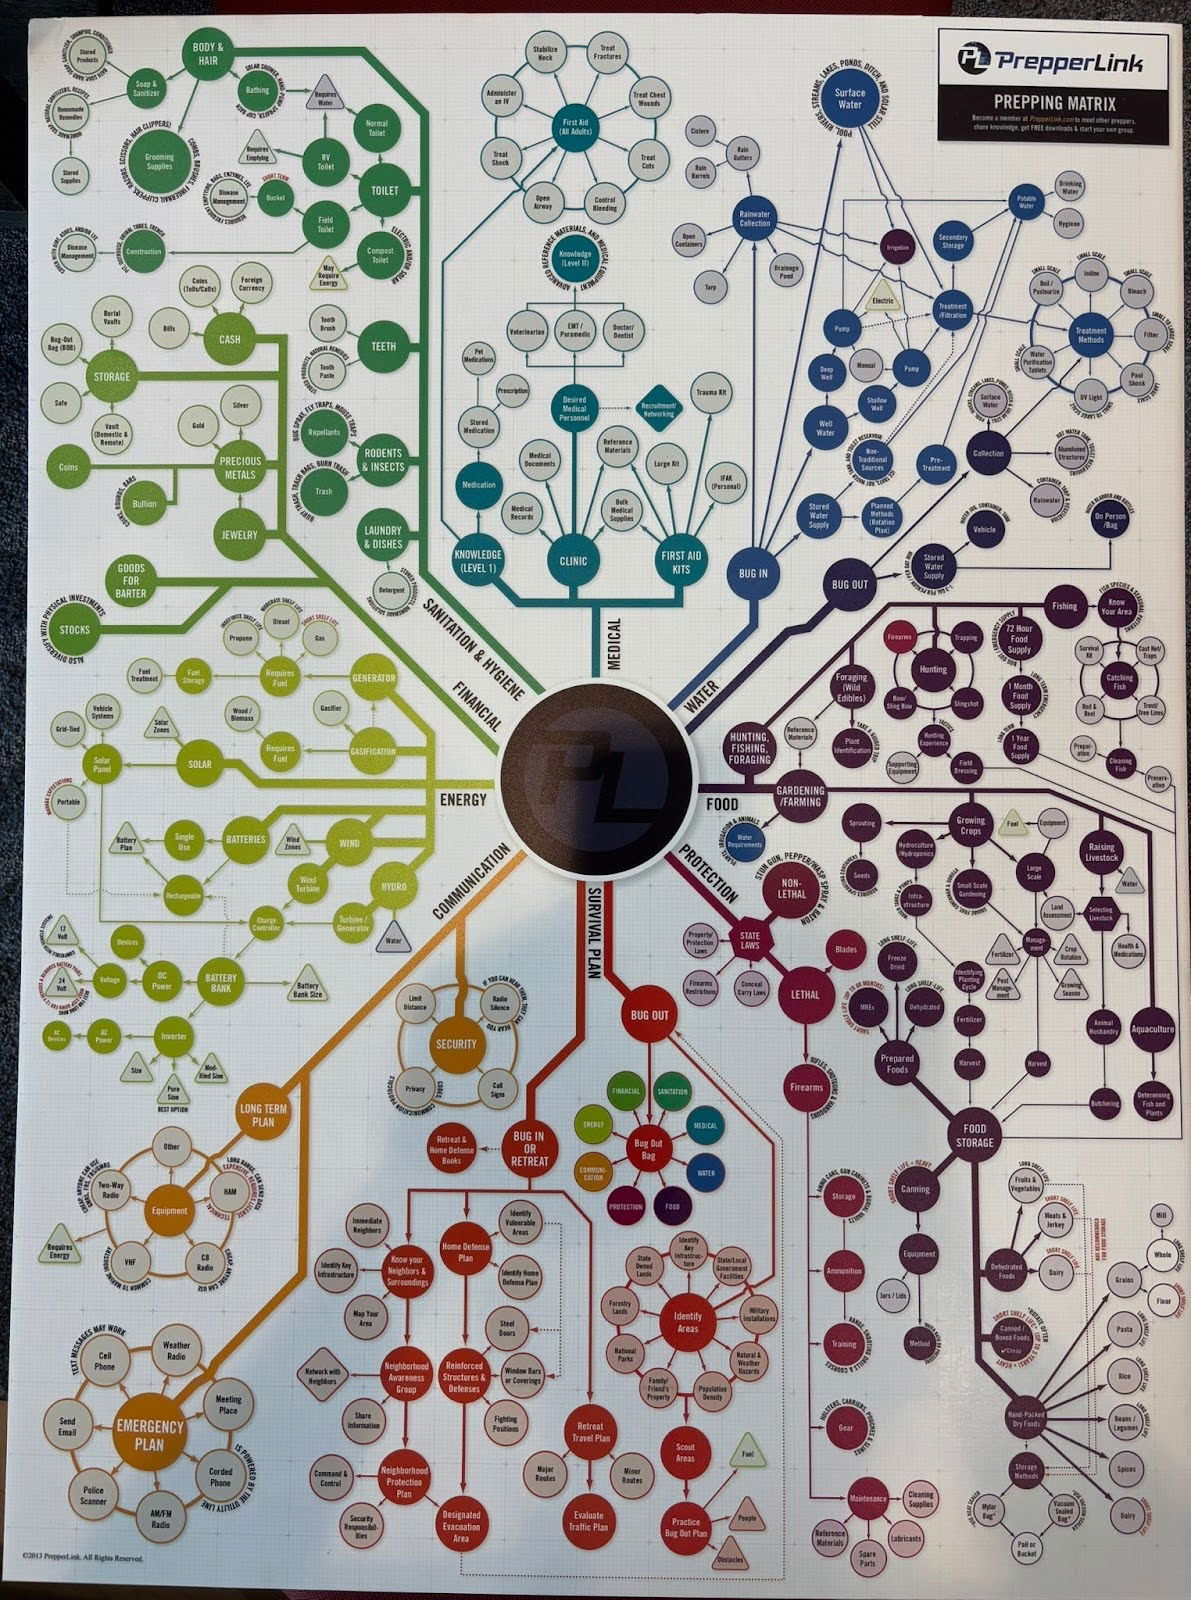
I didn't actually read through all of these different scenarios, but this is a cool graph for a prepper (someone...

This is a cool way to show the data of most popular grocery stores by state. Rather than a bar...
Search for a command to run...