Black Friday + Cyber Monday Sales Graph
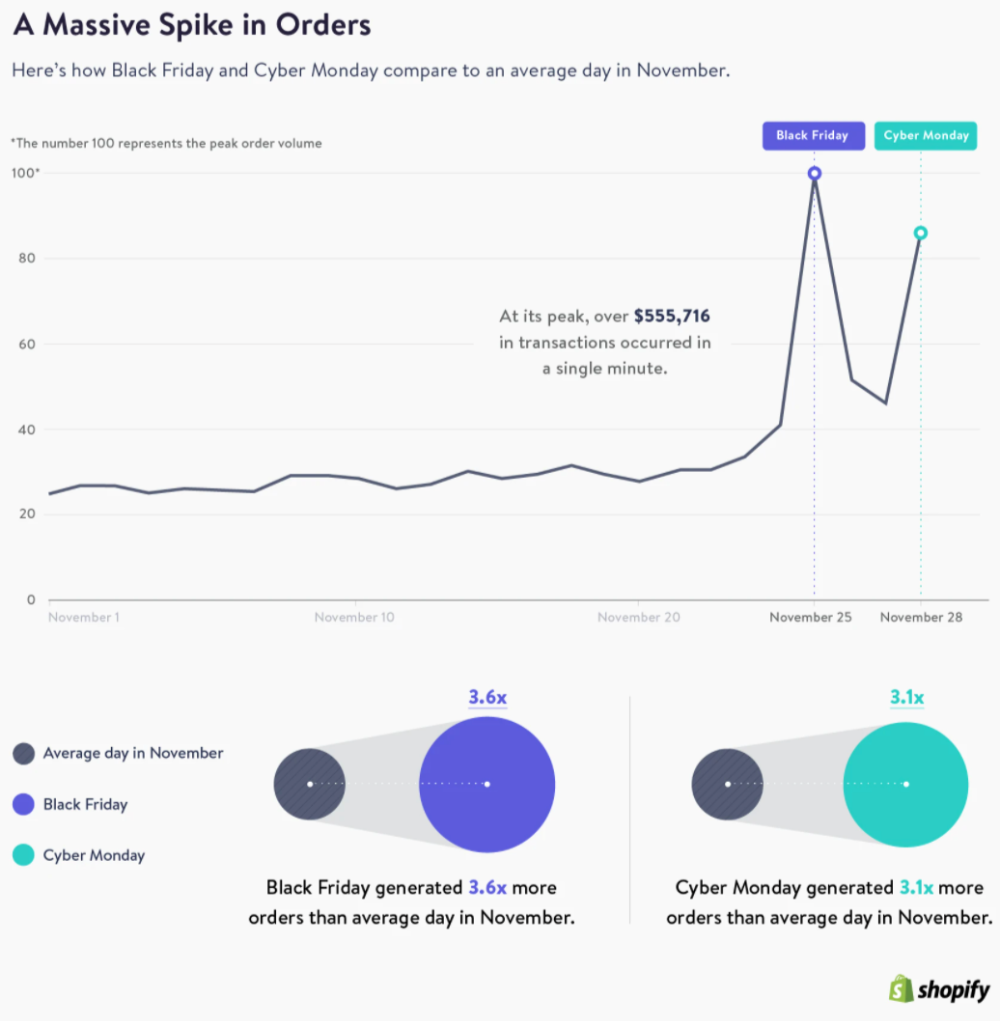
This Shopify chart tells a wild story. On regular November days, sales are steady… then Black Friday hits and order volume skyrockets 3.6x higher. Cyber Monday trails close at 3.1x.
Why this works
- Scarcity + urgency: Shoppers hate missing out, so time-limited deals drive fast action.
- Anchoring: Regular prices make discounts feel irresistible.
- Social proof: Everyone shops these days—no one wants to be the only one not scoring a deal.
- Event-based habit: Consumers are trained to expect the big sale weekend.
Real-world examples
- Amazon moved over $9B on Cyber Monday 2023.
- Target and Walmart saw 2-3x traffic spikes during Black Friday week.
- Shopify merchants processed $555K per minute at peak.
The clear takeaway: engineer urgency, and your “ordinary” can turn into a blockbuster day too.
Analyzed by Swipebot
Loading analysis...
.png?width=3840&quality=80)