Black Friday + Cyber Monday Sales Graph
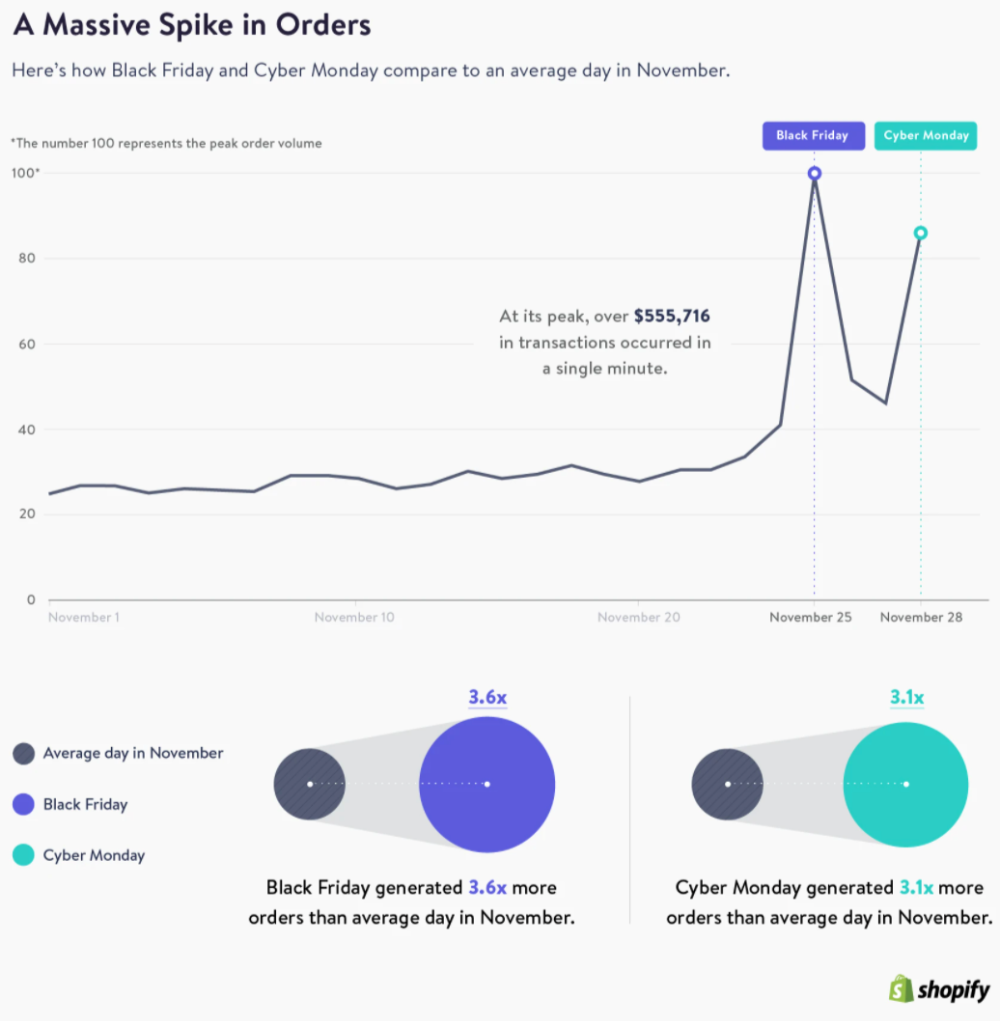
This graph shows the spikes in Shopify store sales seen on Black Friday and Cyber Monday compared to the rest of the month. Crazy!


This shows the difference between Waymo and Tesla cameras. It shows that Waymo has a lot more cameras (29), five...
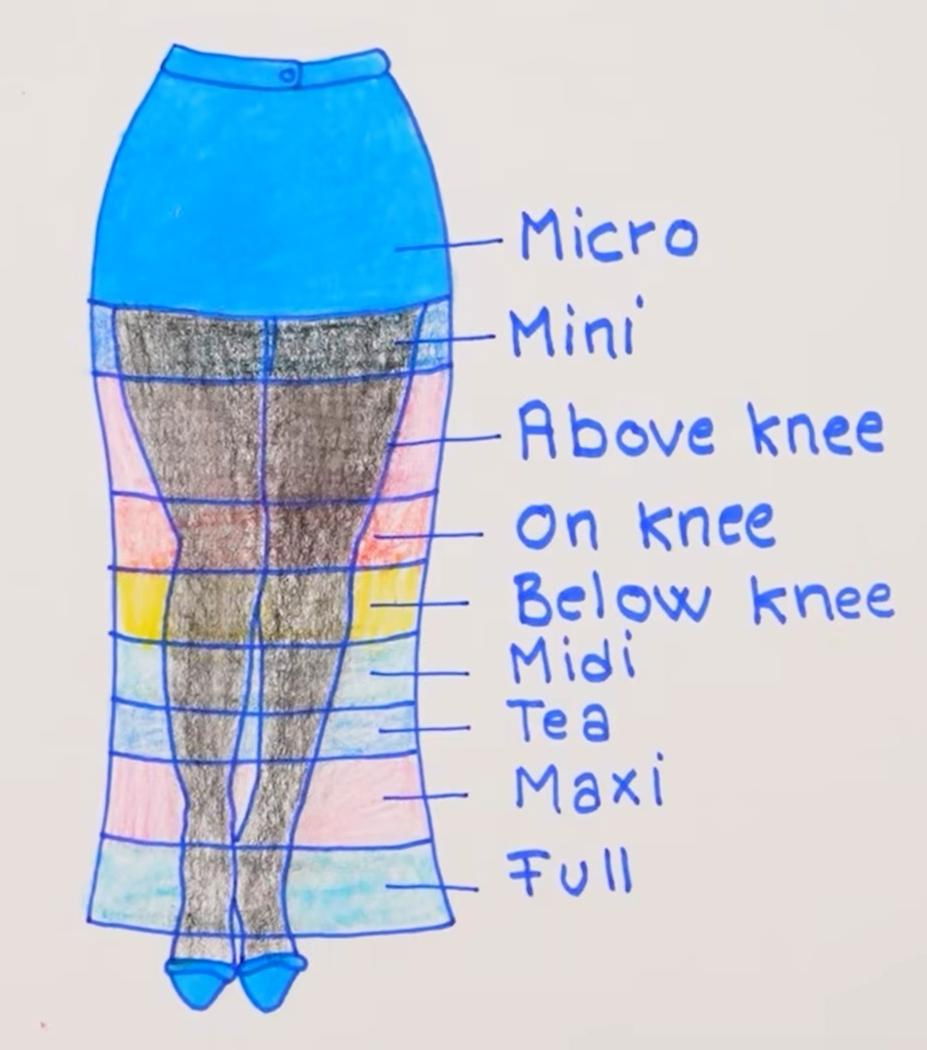
A simple hand-drawn chart shows all the different lengths and categorizations of different skirts. A cool way to display all...

This ad stacks urgency, social proof, and a freebie. “Don’t be the guy who goes bald” a fear-based hook that...
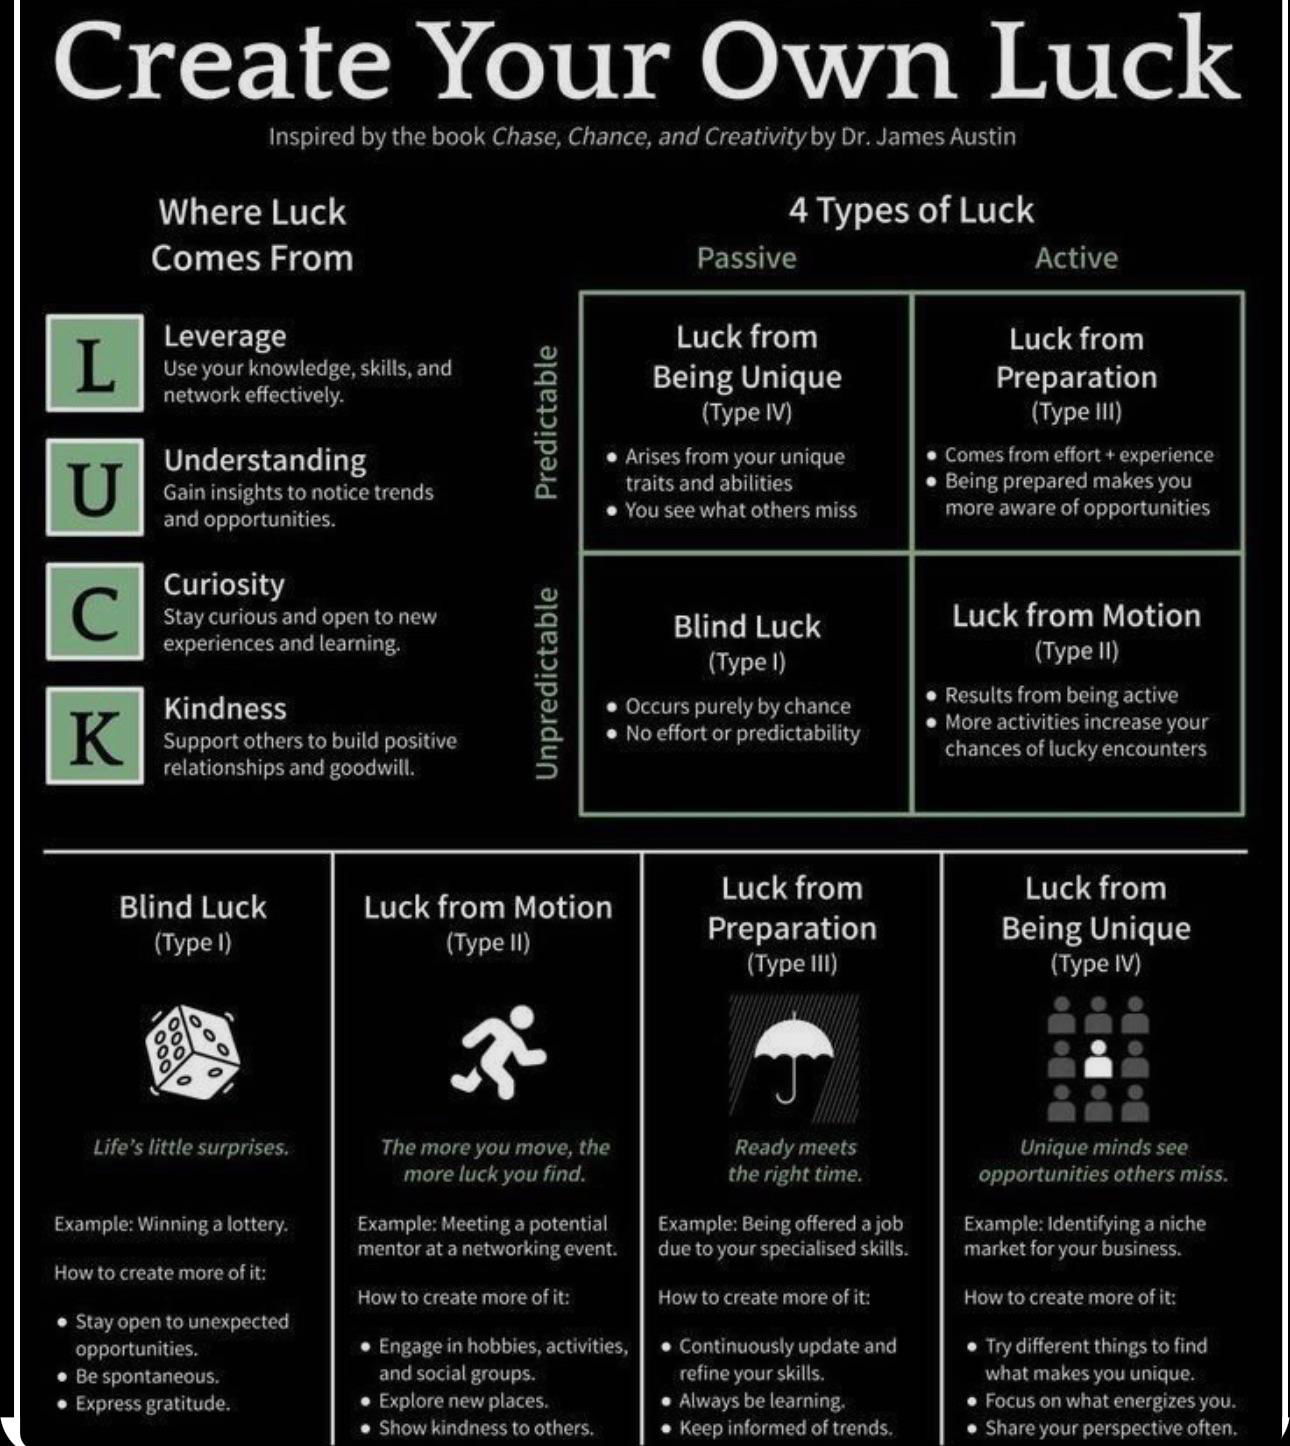
This is a simple little "Luck" chart that shows the different ways luck is created, and you can see how...
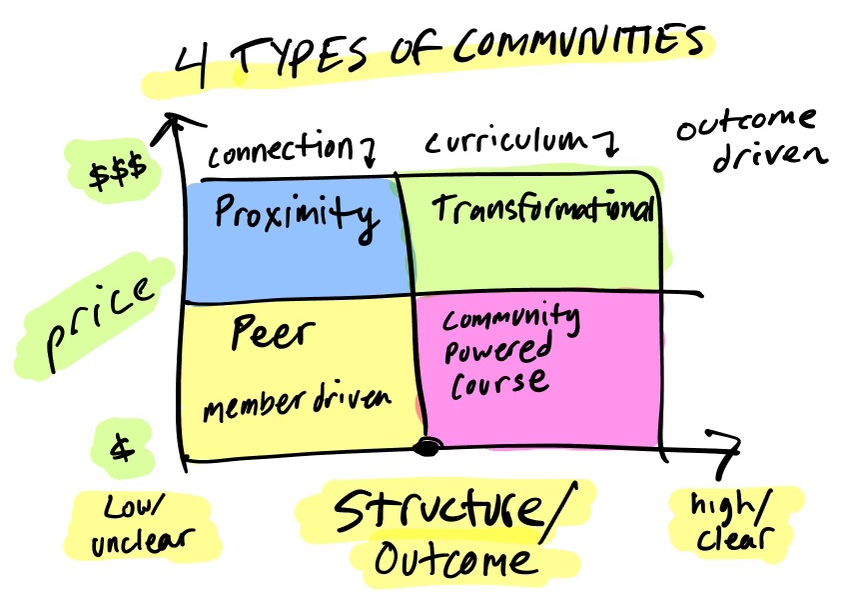
This is a cool graph by Jordan Godbey that shows the four different types of communities you can have and...

Great image showing an eye as an iceberg to highlight hidden dangers. Most eye diseases, aren’t visible until it’s too...
Search for a command to run...