Life of a project timeline chart
Updated on
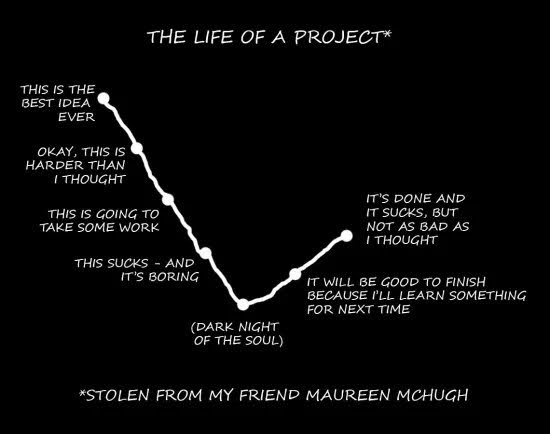
Every marketer knows this chart is too real. You start out thinking your campaign idea is genius... then halfway in, it feels like you’ve created a dumpster fire. But push through, and suddenly it all comes together.
What’s going on here
This chart nails the creative process: excitement, frustration, despair, recovery, and relief. It’s not just “how projects go,” it’s how our brains handle uncertainty and creative risk.
Why it works
- Normalizes the messy middle that kills most projects
- Encourages persistence when motivation dips
- Reminds you the emotional low point is actually progress
- Builds realistic expectations for creative teams
Real-world examples
- Apple’s “Think Different” campaign went through 100+ script drafts.
- Pixar rewrites most films 5+ times before release.
- Dollar Shave Club’s viral video looked “too rough” until it blew up with 12,000 orders in 48 hours.
- Marketers who iterate win—those who quit in the dip don’t.
Analyzed by Swipebot
Loading analysis...
.png?width=3840&quality=80)