Text-length styled PE ratio chart
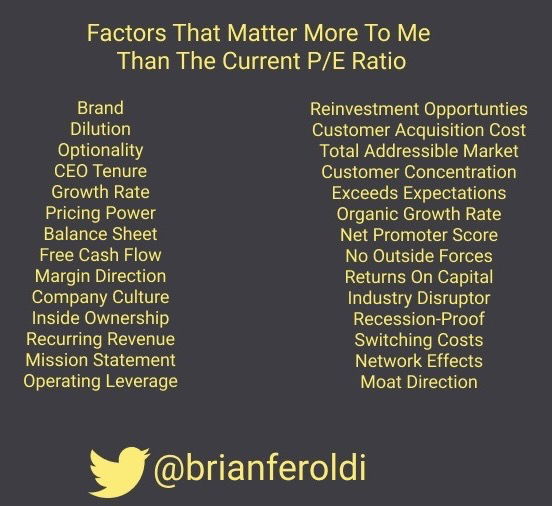
Big block paragraphs? Snooze fest. But a clean, balanced list that looks great? Instant scroll-stopper.
Brian Feroldi nails this: his chart splits a long list into two neat columns, turning dense ideas into visually satisfying chunks. The eye flows naturally down each side, and the centered headline gives it authority.
Why It Works
- Breaks complexity into snackable bits
- Uses symmetry to guide attention
- High readability = more engagement
- Bold text adds clarity and hierarchy
Examples
- Apple’s feature comparison charts use similar visual symmetry to make choices simple.
- HubSpot’s pricing page uses aligned columns for easy scanning.
- McKinsey’s report visuals often use symmetric lists to make dense topics digestible.
Analyzed by Swipebot
Loading analysis...
