The most playful cities in the US
Updated on
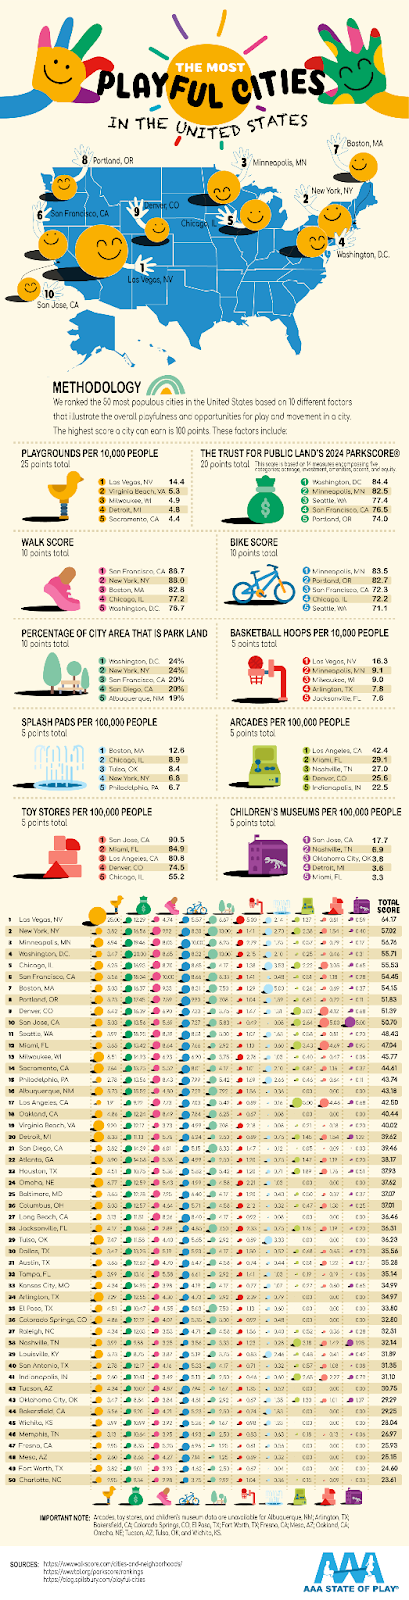
This infographic ranks U.S. cities by playfulness—based on playgrounds, parks, splash pads, toy stores, and more. It’s bright, fun, and instantly makes you want to explore or move somewhere with more bikes and bubbles.
Marketing analysis
The design nails one thing marketers often forget: emotion before information. It takes dry stats and wraps them in fun, kid-like graphics that make data feel alive. Even though it’s data-heavy, your brain doesn’t glaze over—it smiles along the way.
Why it works
- Data visualized in a story format
- Emotional visuals (smiling cities, playful icons) increase recall
- Simple icons help readers scan quickly
- Strong hierarchy of information—easy to follow
- Turns a research piece into shareable content
Examples
- Spotify Wrapped makes listening stats playful and personal.
- Google’s Year in Search uses color and emotion to bring data to life.
- Airbnb’s city guides turn local facts into inspiring journeys.
Analyzed by Swipebot
Loading analysis...
