
This incredibly detailed image instruction set gives the full instructions on how to make ~40 drinks. It’s kind of cool how much data is easy visualized in this one image.


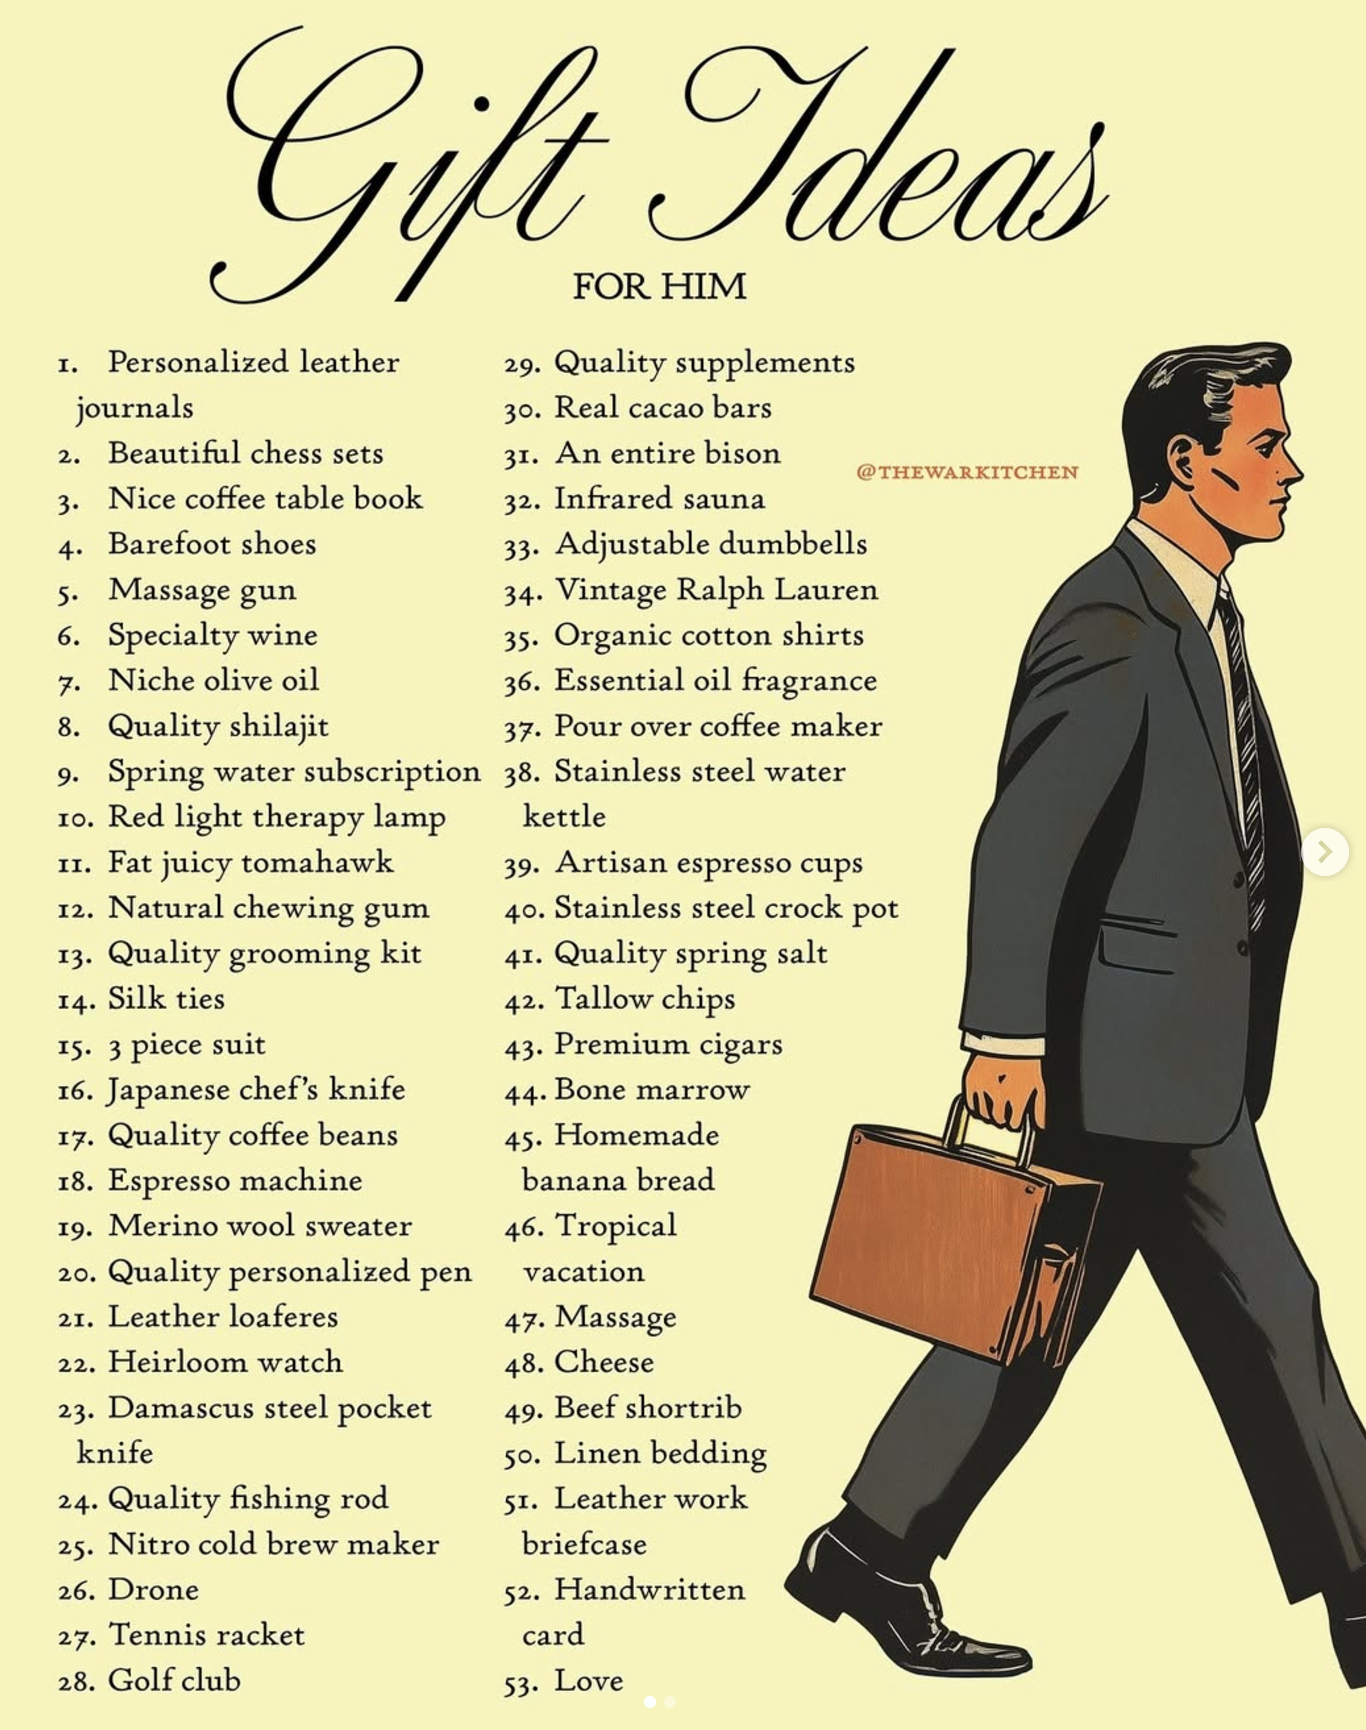
Here's a cool gift list for men from @thewarkitchenHere's a list of products I've previously gifted people for Christmas:• Air...
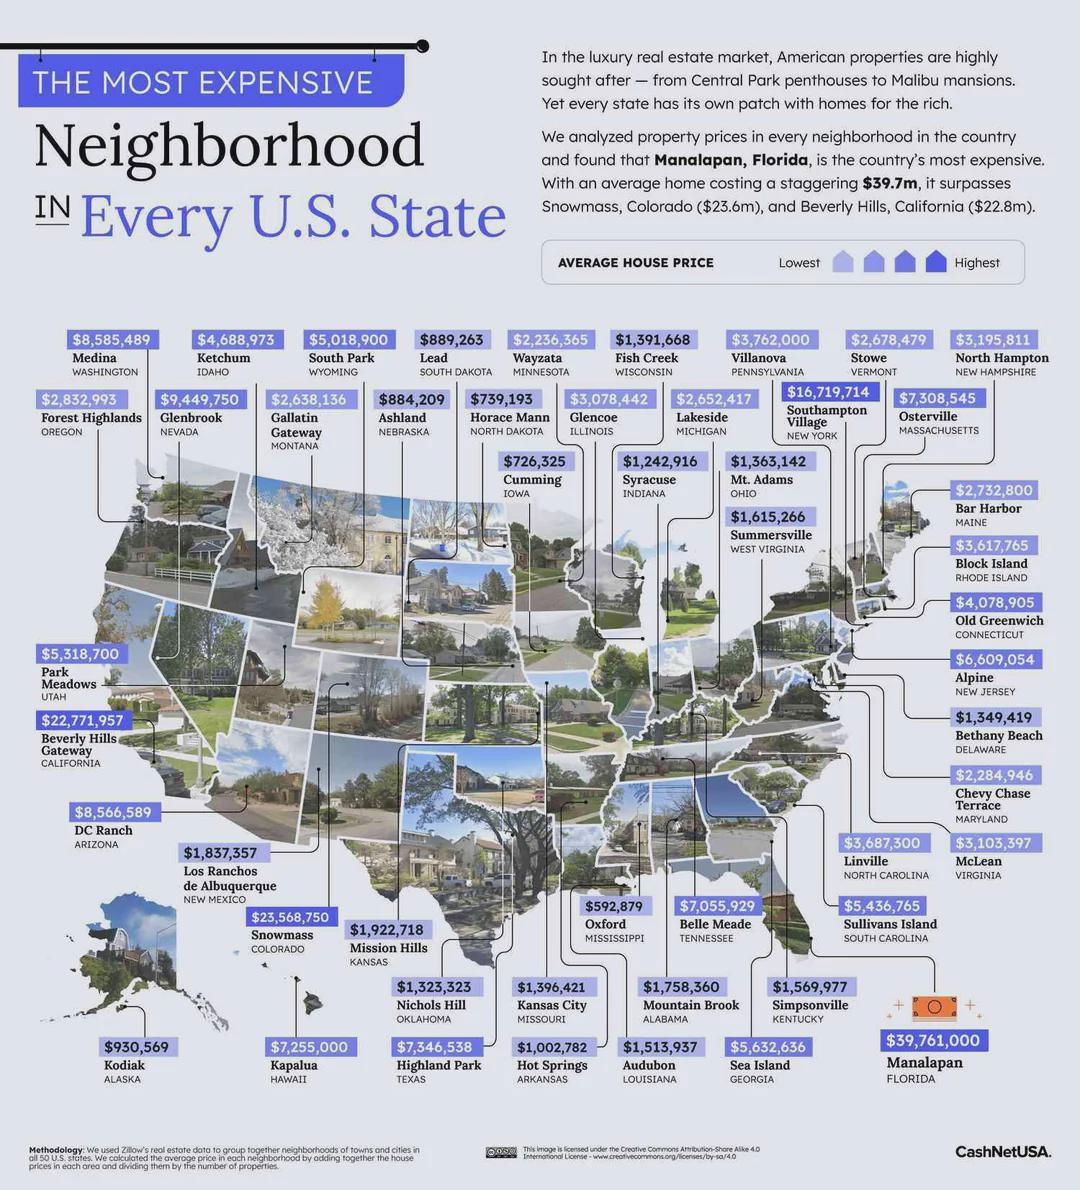
This is an interesting approach to listing out the most expensive neighborhoods in each state: By showing a map but...
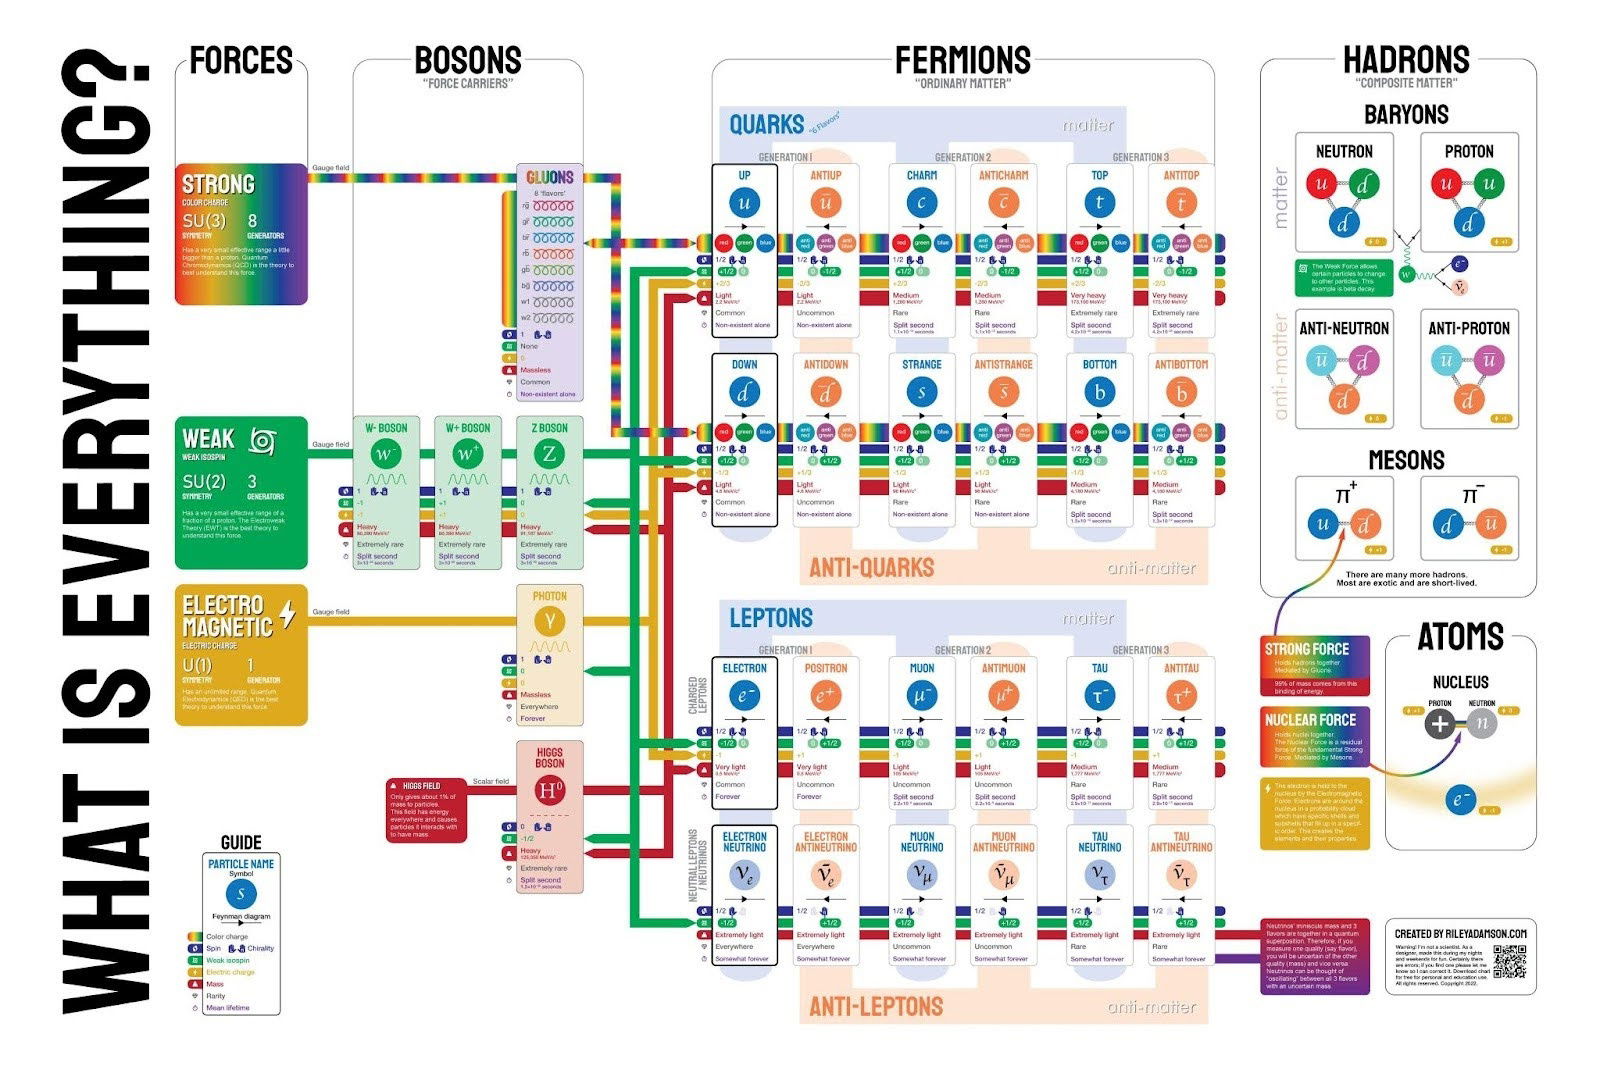
This isn't a very simple graphic, but it shows what everything is based down to the fundamental particles that we...
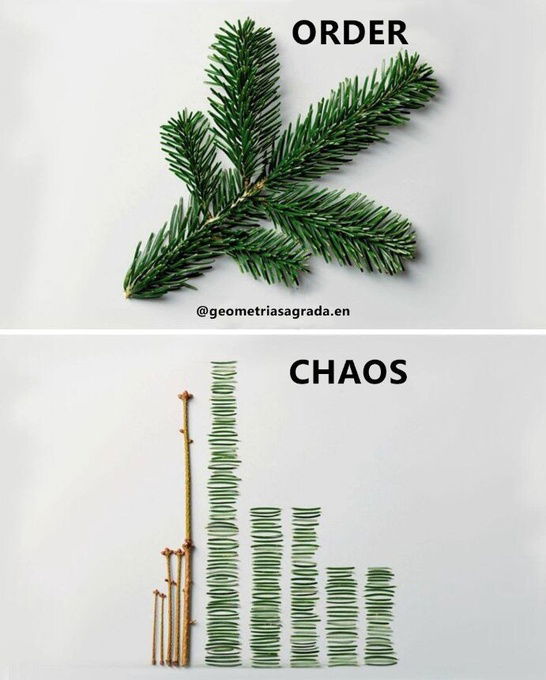
This is a cool visualization of an assembled plant in complete order, but then disassembled it looks like just random...
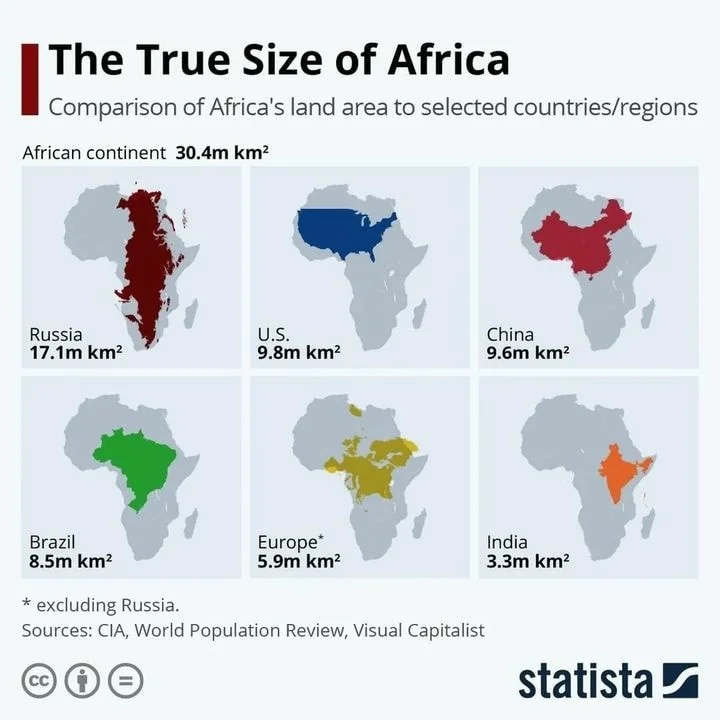
I love when a single graph or chart can update how you think about something. It's quite shocking to know...

This is an awesome graph that takes all data from different ratings platforms and combines their scores to get the...
Search for a command to run...
Here's a cool gift list for men from @thewarkitchenHere's a list of products I've previously gifted people for Christmas:• Air...
This is an interesting approach to listing out the most expensive neighborhoods in each state: By showing a map but...
This isn't a very simple graphic, but it shows what everything is based down to the fundamental particles that we...
This is a cool visualization of an assembled plant in complete order, but then disassembled it looks like just random...
I love when a single graph or chart can update how you think about something. It's quite shocking to know...
This is an awesome graph that takes all data from different ratings platforms and combines their scores to get the...
Search for a command to run...