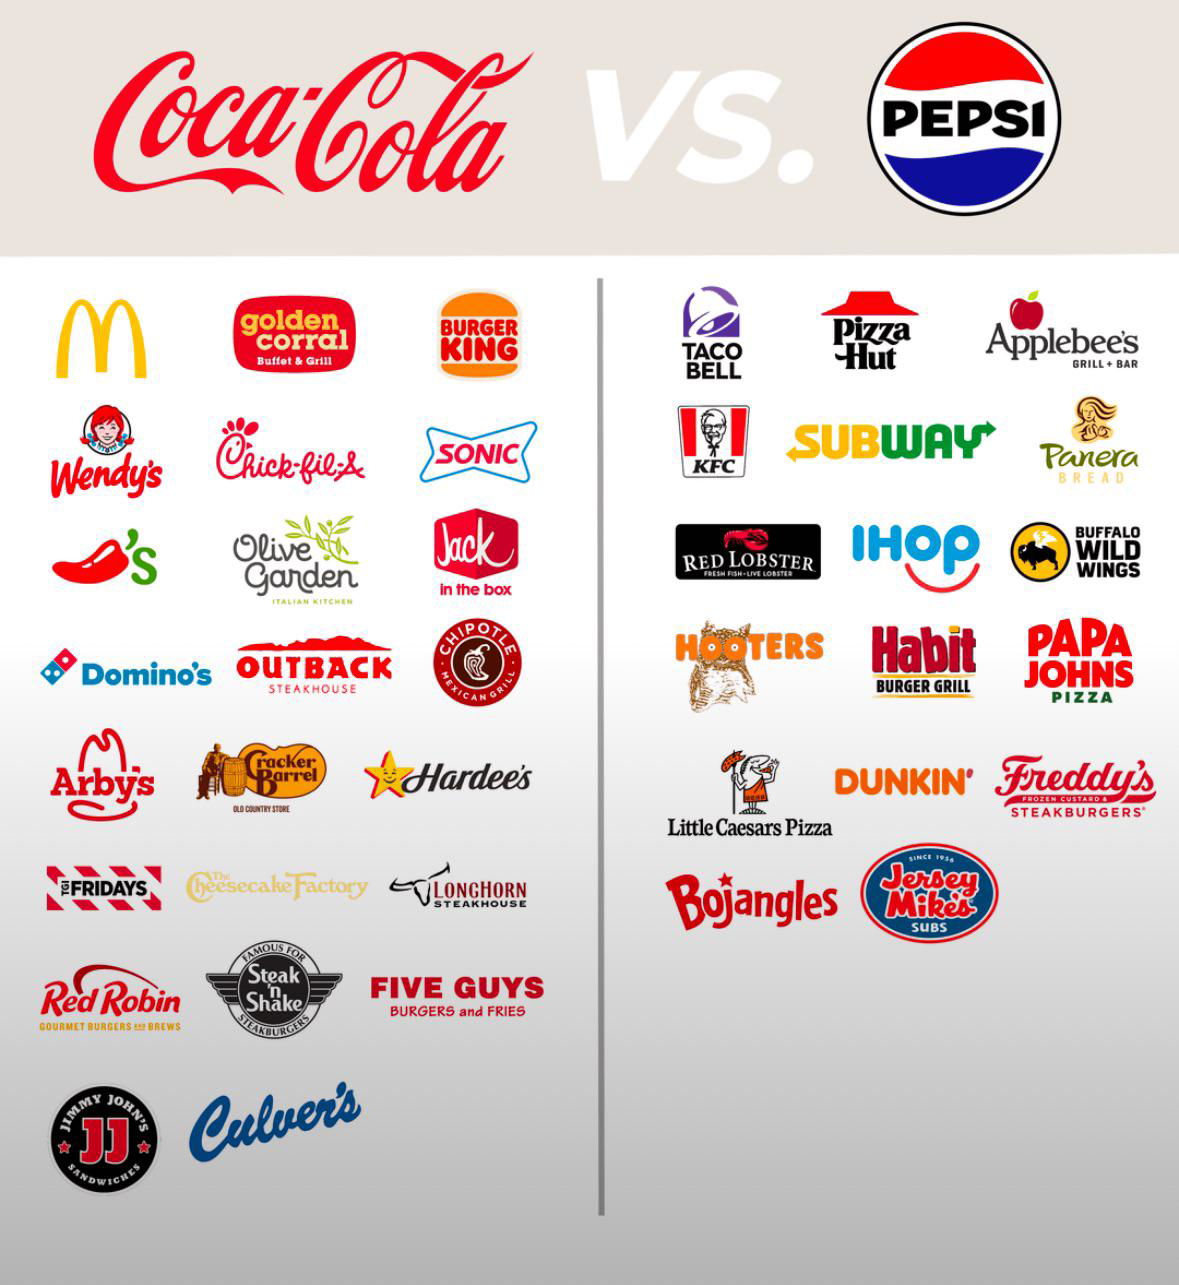
Coca-Cola -vs- Pepsi Exclusive Brand Deals
A major way Coca-Cola and Pepsi compete is by getting exclusive deals with different restaurant chains. It's why sometimes you...
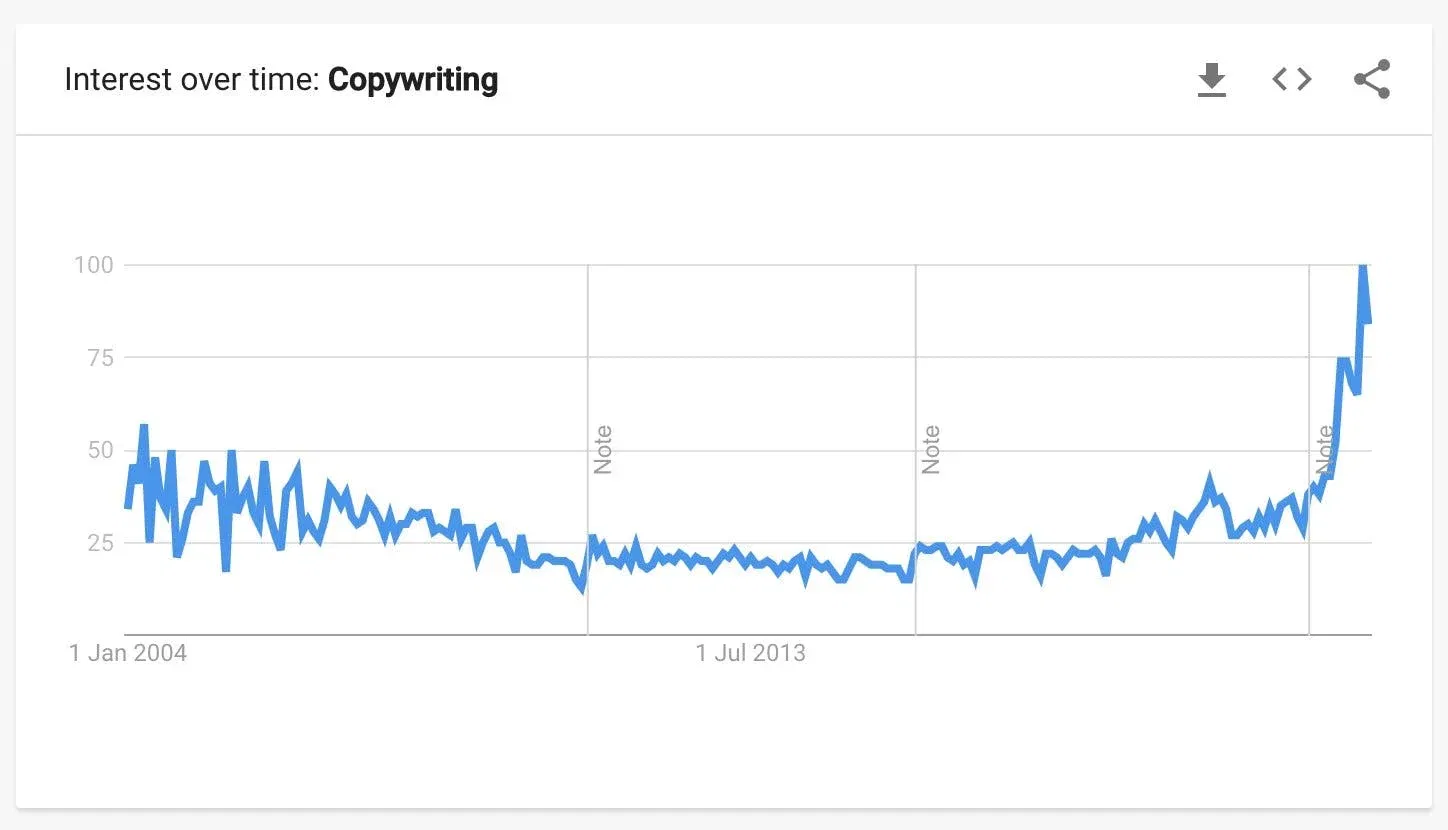
The keyword "Copywriting" from 2004 to now
Interest in the keyword "Copywriting" from 2004 to present has skyrocketed since January 2022. What's your explanation?

Dog Groomer Price Justification Chart
Every consultant or freelancer has had to justify their cost at times. This dog groomer was sick of people snarky...
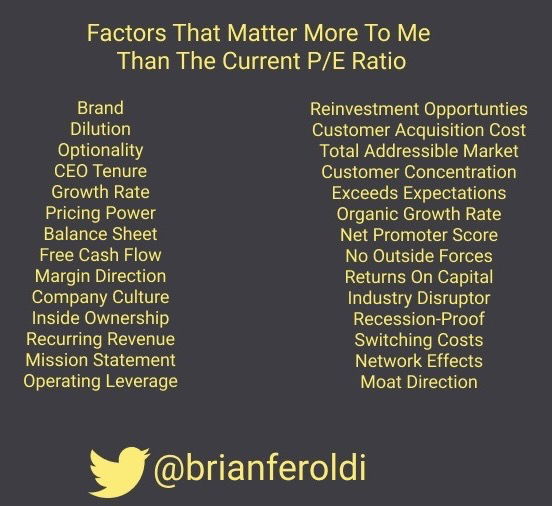
Text-length styled PE ratio chart
This chart uses text-styling by making a bullet point list that's kind of Angled downwards kind of like this to...

Black Friday Website Traffic Trends (Mobile vs Desktop)
If your website isn't optimized for mobile, Black Friday is a reason to optimize it. This graph shows that the...

Advertising Forecast for 2021
This graph shows a prediction of where companies will be spending their ad money in 2021.

Ecommerce Growing Share of Total Q4 Sales
Each year, the Ecommerce makes up a larger share of the total sales in Q4. Over the past 10 years,...

Helpful Stats for Ecommerce Sellers
This data shows a bunch of little tweaks Ecommerce sellers can make to their sites to increase conversions.
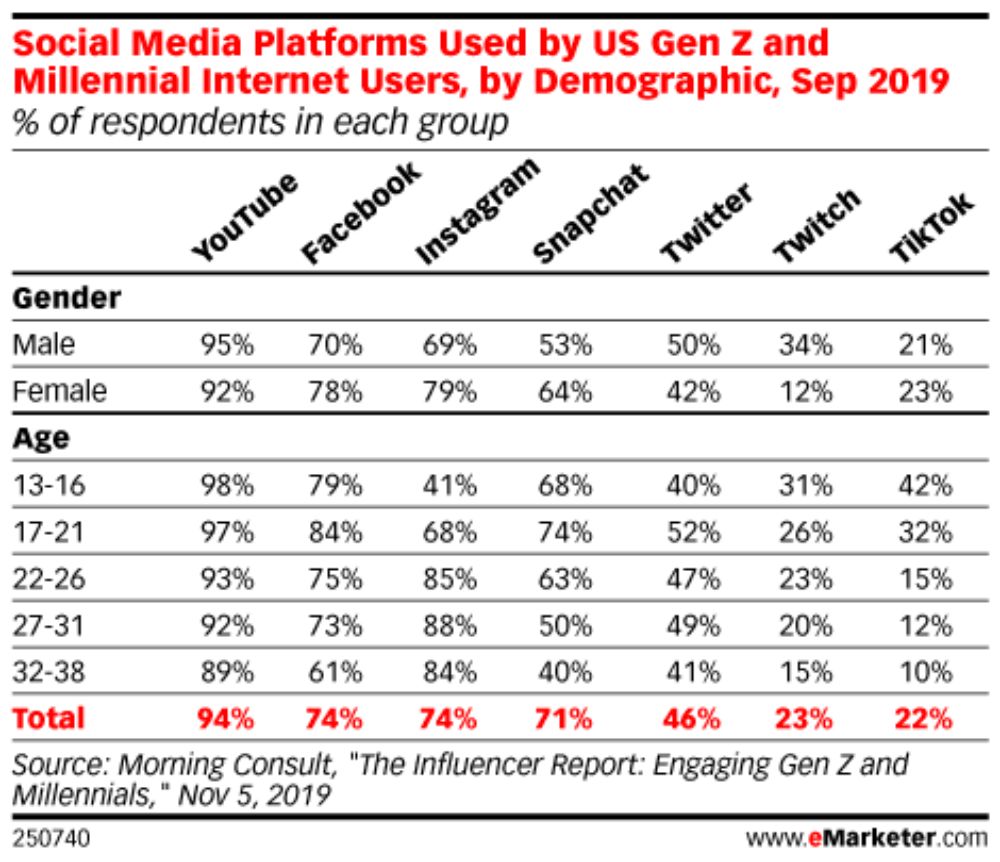
Gen Z and Millenial Social Media Platform Use
These stats are useful for deciding where to focus your marketing efforts. Are you marketing where your audience hangs out?
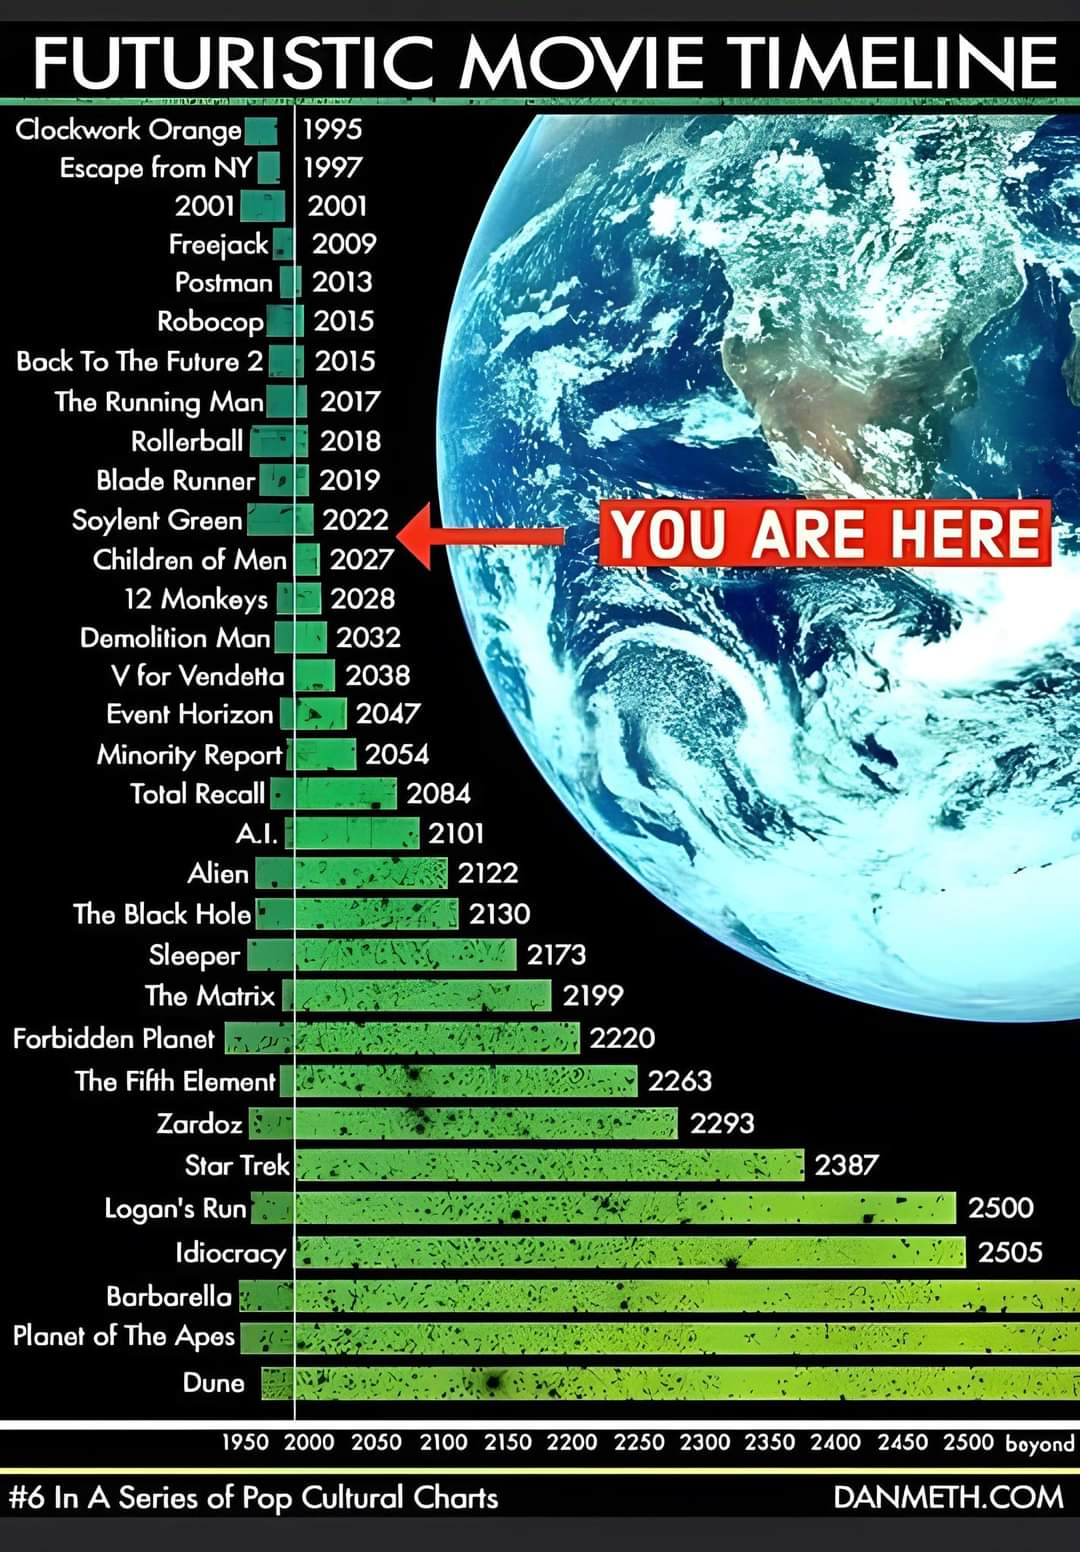
Future dates of movies in a timeline
This cool timeline shows where we currently are according to futuristic movies. We've already passed Back To The Future, but...

Visual demonstration of 400 calories of different foods
This clever image visually demonstrates how full your stomach would be with different types of food. You can easily see...
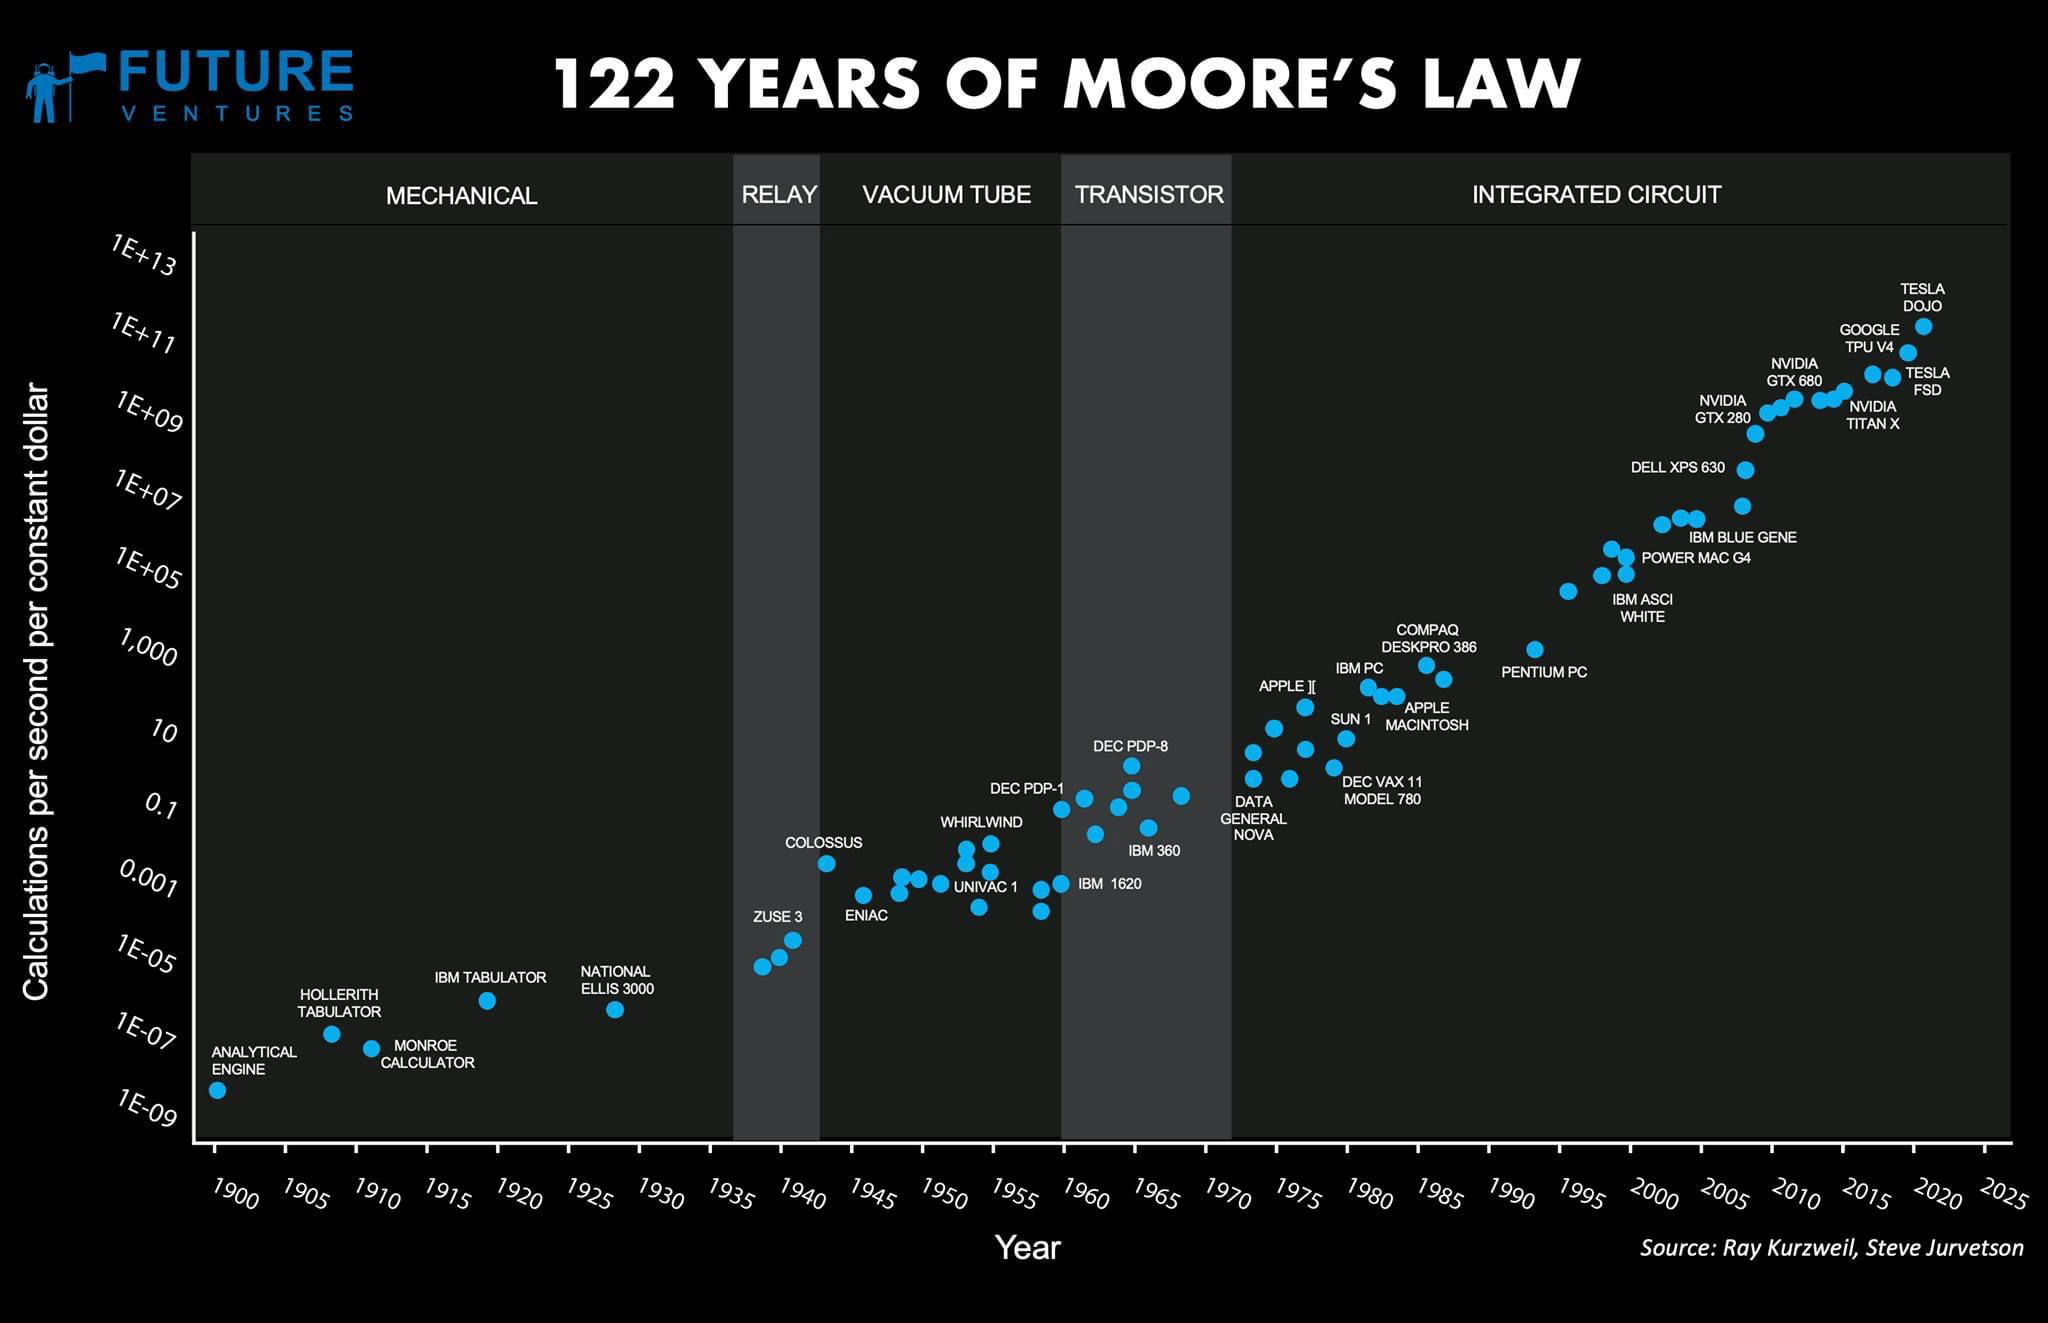
Moore's Law Data Plot
This is a wonderful chart showcasing price/performance of computing power over the last 122 years.

Percentage of Population on Faceebook (by Country)
You can look at this two different ways: #1.) That's a LOT of people on Facebook—maybe you should market there!...

Online vs. In Store Shopping Preferences
Online shopping is slowly taking over, but there are still several industries where people prefer to ship in person. That...
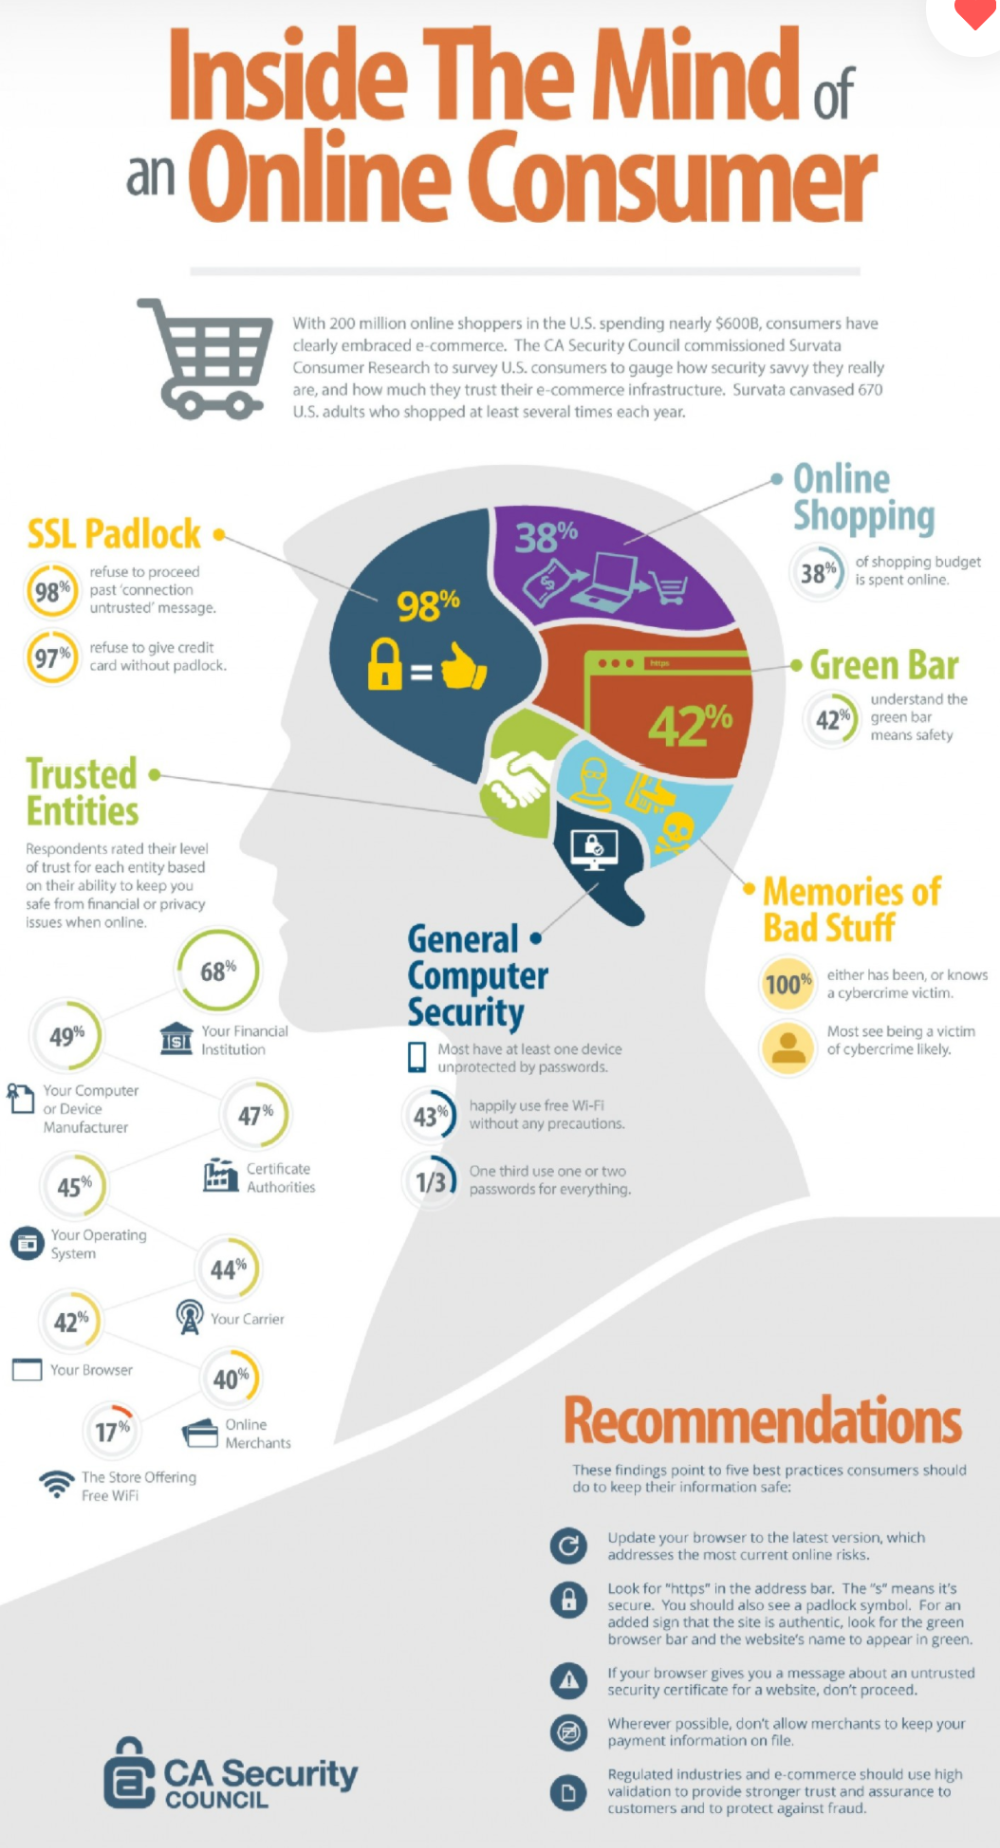
Consumer Cybersecurity Savviness Stats
Online shoppers are getting savvier about how to protect their information online. If your site doesn't give off a secure...
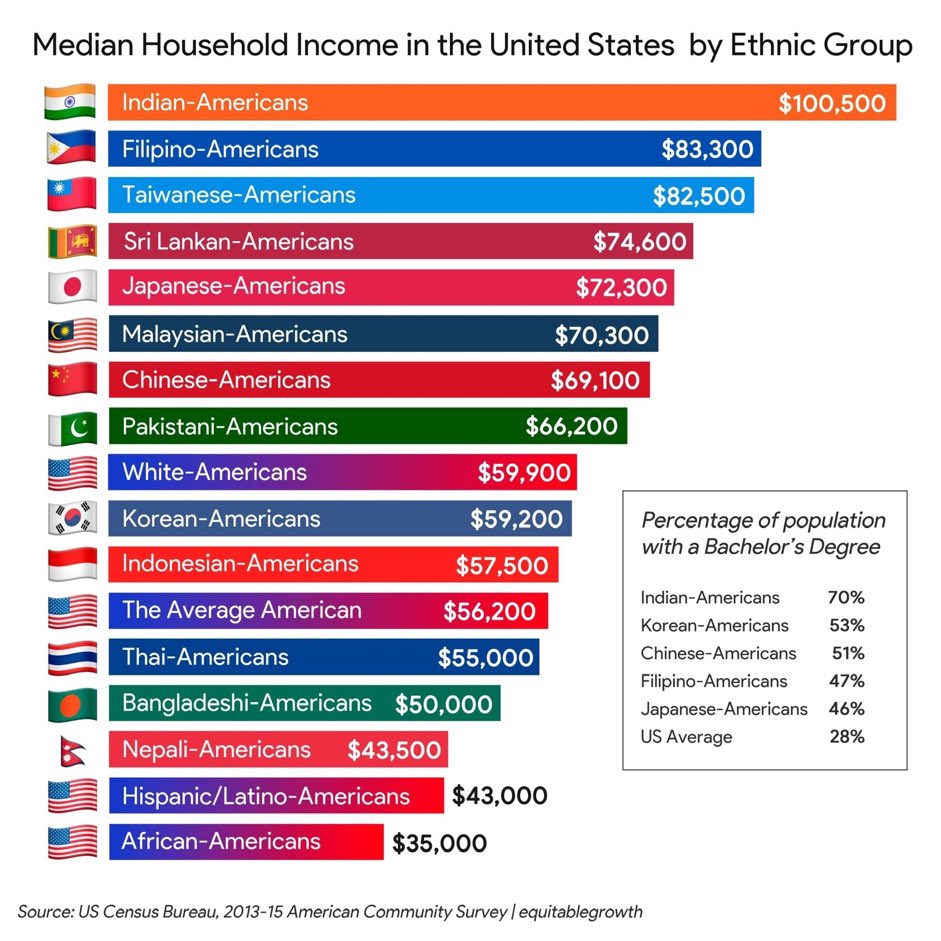
Want your kid to become a doctor, lawyer, engineer, or business owner?
Apparently pestering your kid to become a doctor, lawyer, engineer, or business owner really works! A possible reason for the...

Age Appropriate Chores List
This cool guide of chores shows common chores for different ages of children.

Richest billionaire in each state chart
This nice little chart shows the top billionaire in each state. With a few images and text this image takes...
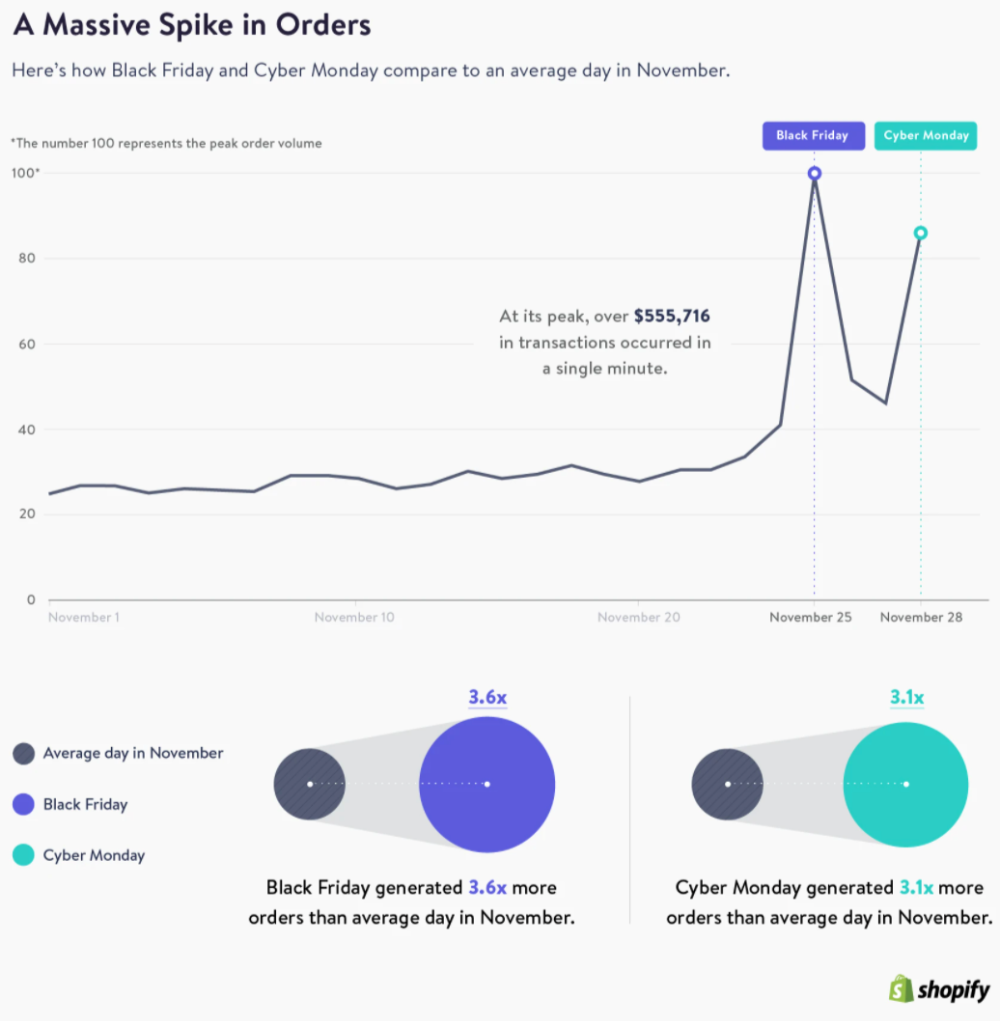
Black Friday + Cyber Monday Sales Graph
This graph shows the spikes in Shopify store sales seen on Black Friday and Cyber Monday compared to the rest...

Mobile Vs. Desktop Ad Spend Trends
Mobile ad spend has slowly been creeping up on desktop ad spend. Experts think 2022 will be the year when...

Social Network Active Users Comparison
This graph shows the number of worldwide active users on different social media networks and messaging platforms in 2020.
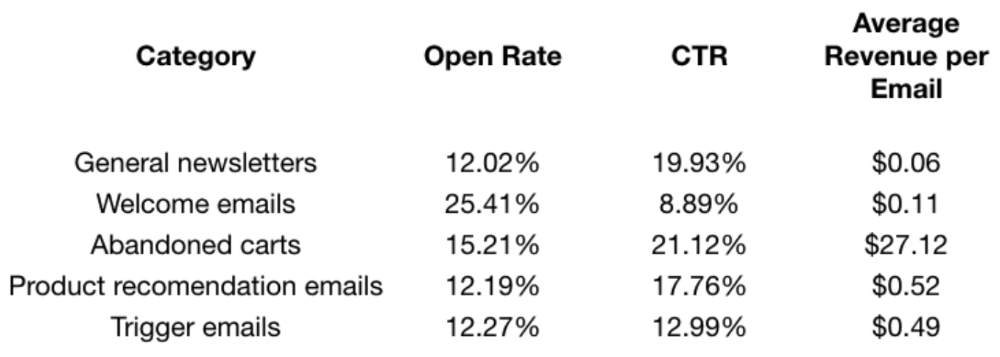
Comparing Different Types of Emails
The numbers don't lie. If you're forgetting about abandoned cart emails, you're leaving stacks of cash on the table.

The Job Application Numbers Game
Oftentimes new freelancers send out a handful of applications or cold emails, get rejected, and give up. This graphic shows...

Coronavirus Affect on Ecommerce Industries
The Ecommerce world is transforming thanks to COVID-19. If you're in a hurting industry, it's time to pivot. And if...

.png?width=3840&quality=80)
