Moore's Law Data Plot
Updated on
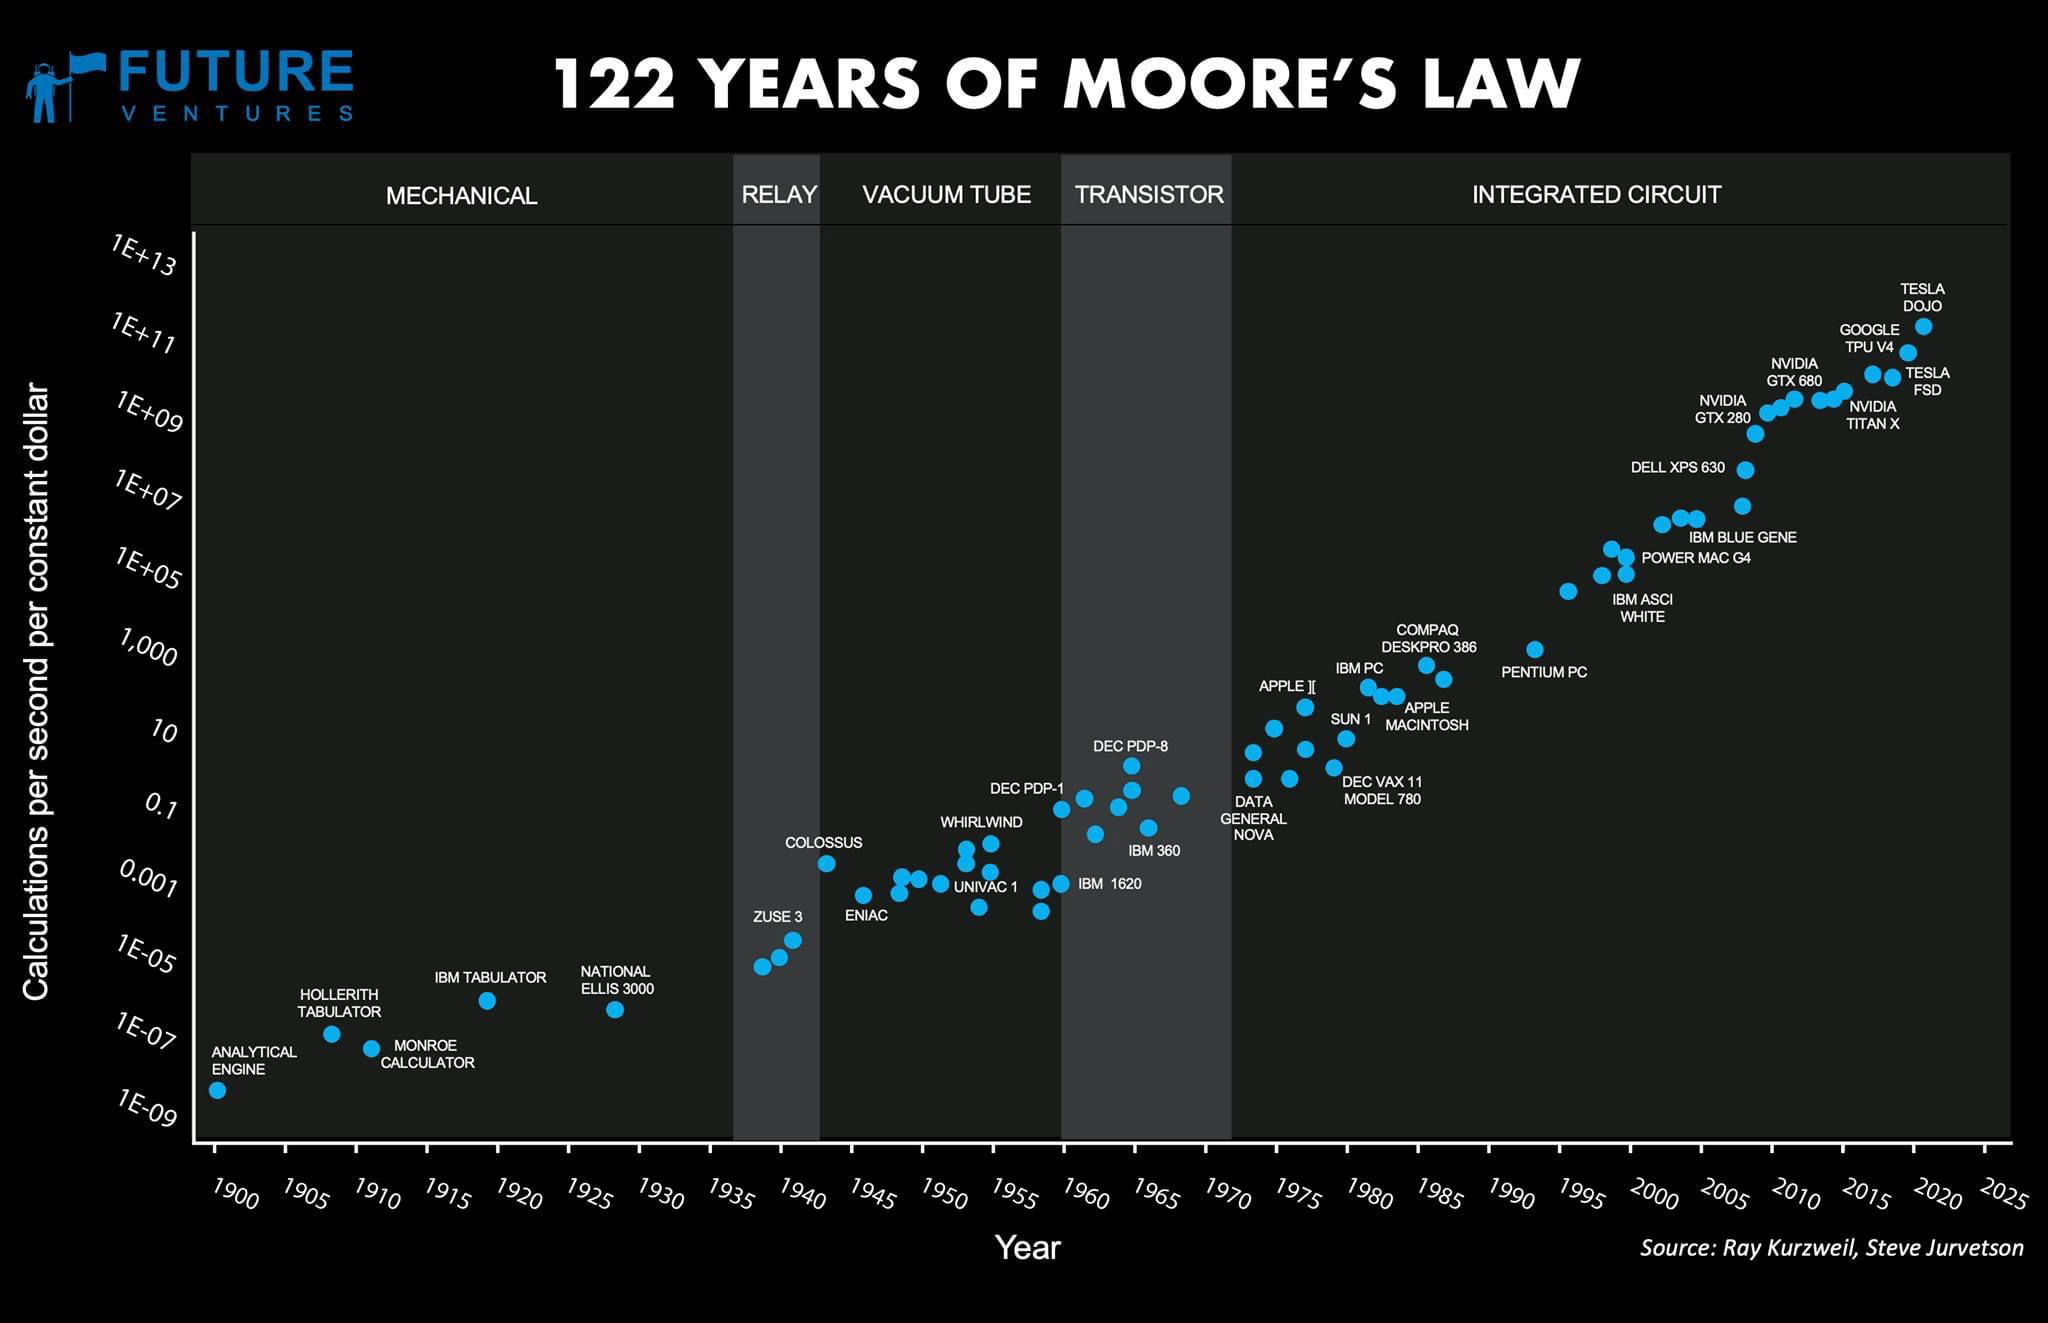
This chart shows something wild — computing power per dollar has skyrocketed for more than a century. Each leap (from mechanical to relay to vacuum tube to transistor to integrated circuits) stacked on the last, compounding progress like crazy.
The Marketing Lesson
Technology compounds — and so does brand equity, content, and audience trust when you keep improving bit by bit.
Why It Works
- Each generation of tech built on proven success
- Small, consistent gains lead to exponential results
- Clear continuity builds momentum and credibility
- Staying adaptable keeps you riding the next wave
Real-World Compounding in Marketing
- HubSpot’s blog traffic grew 10x in 3 years by posting daily
- MrBeast reinvests revenue into bigger videos — compounding reach
- Nike built decades of loyalty by evolving “Just Do It,” not replacing it
- Apple refines the same products yearly yet drives massive hype each time
Analyzed by Swipebot
Loading analysis...
