1,913 Images and Illustration Examples That Teach Things
Drawings and illustrations and photography can transmit more information from human-to-human than text can. This board is perfect for designers and marketers seeking visual inspiration.
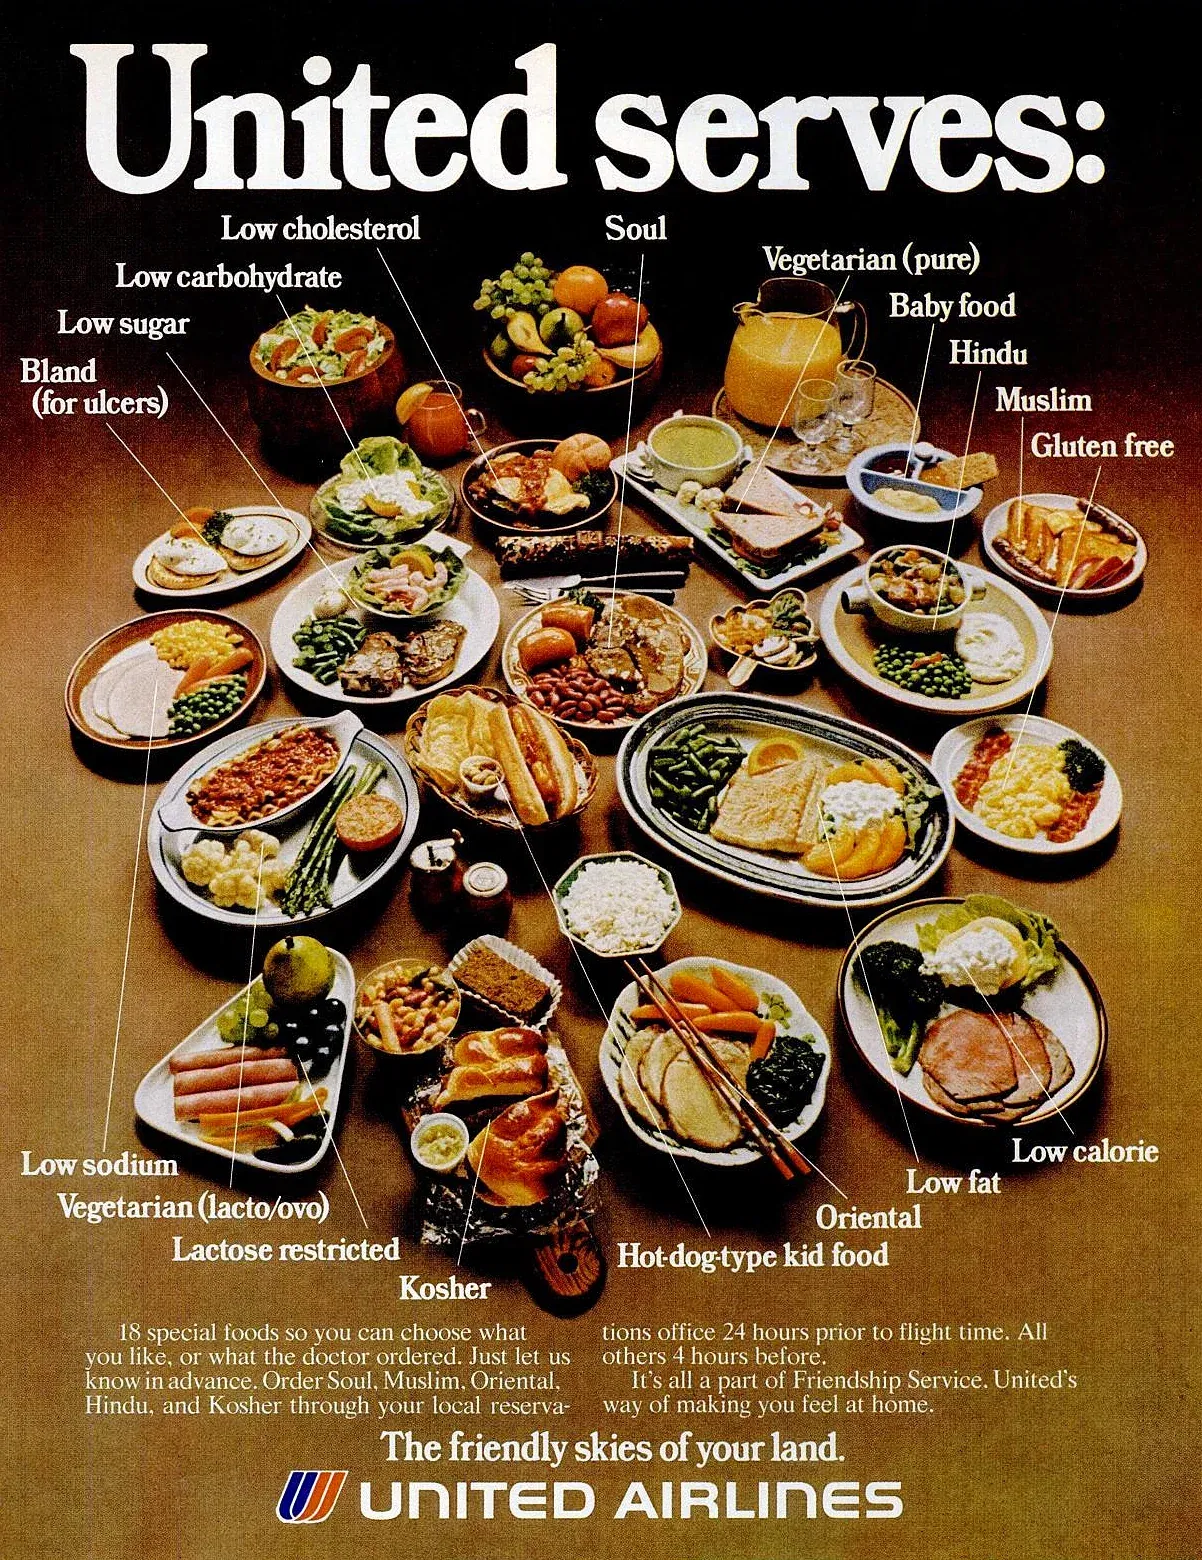
United Airlines Food + Text Mockup Ad
This vintage United Airlines ad doesn’t just show food—it sells an experience. Rows of labeled dishes cover the table: kosher,...
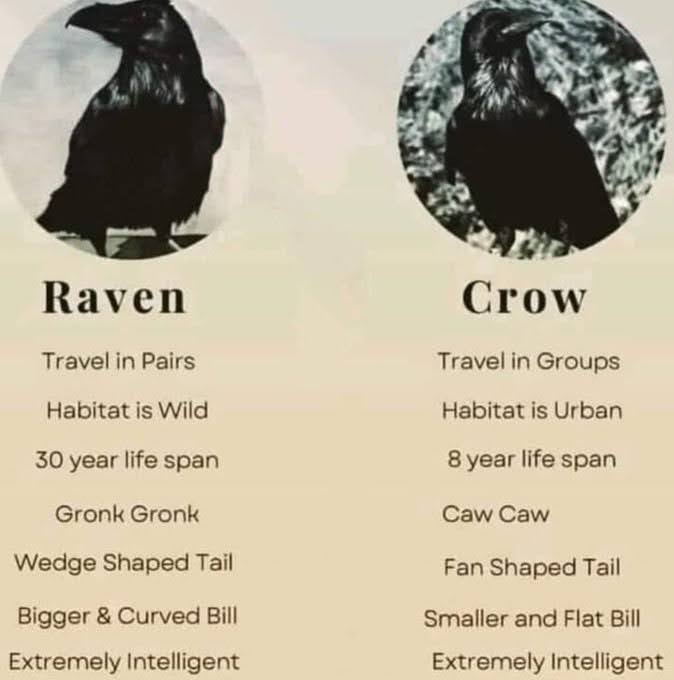
Raven or Crow cheat sheet
This Raven vs Crow image is a perfect example of how simple visual comparisons can teach complex info—fast. It’s short,...
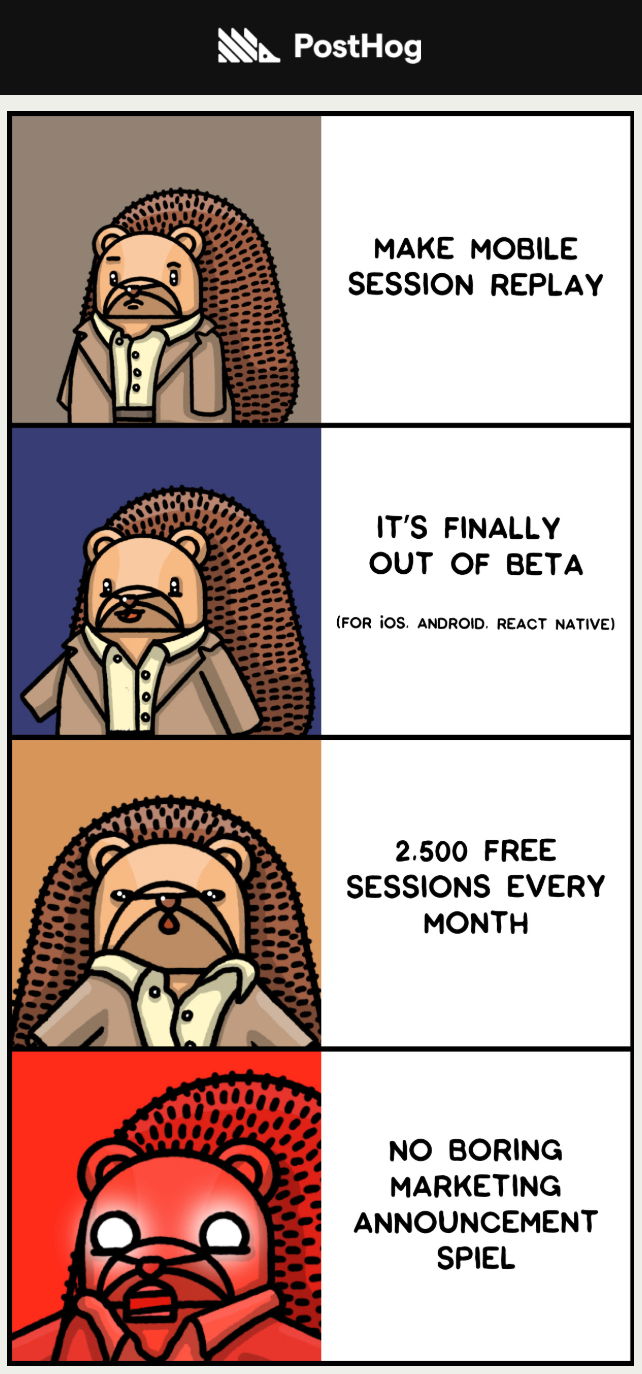
PostHog's awesome product announcement email
PostHog doesn’t “announce new features.” They make art. Their email about mobile session replay looked more like a meme than...

Illustration of Ohms law
This funny Ohm’s Law sketch is a reminder that even the driest topics can be made memorable with visuals and...

Shirts as gifts or intro's
When Uriah from Productive Therapist surprised a friend at a conference with a custom t-shirt featuring her face and brand,...
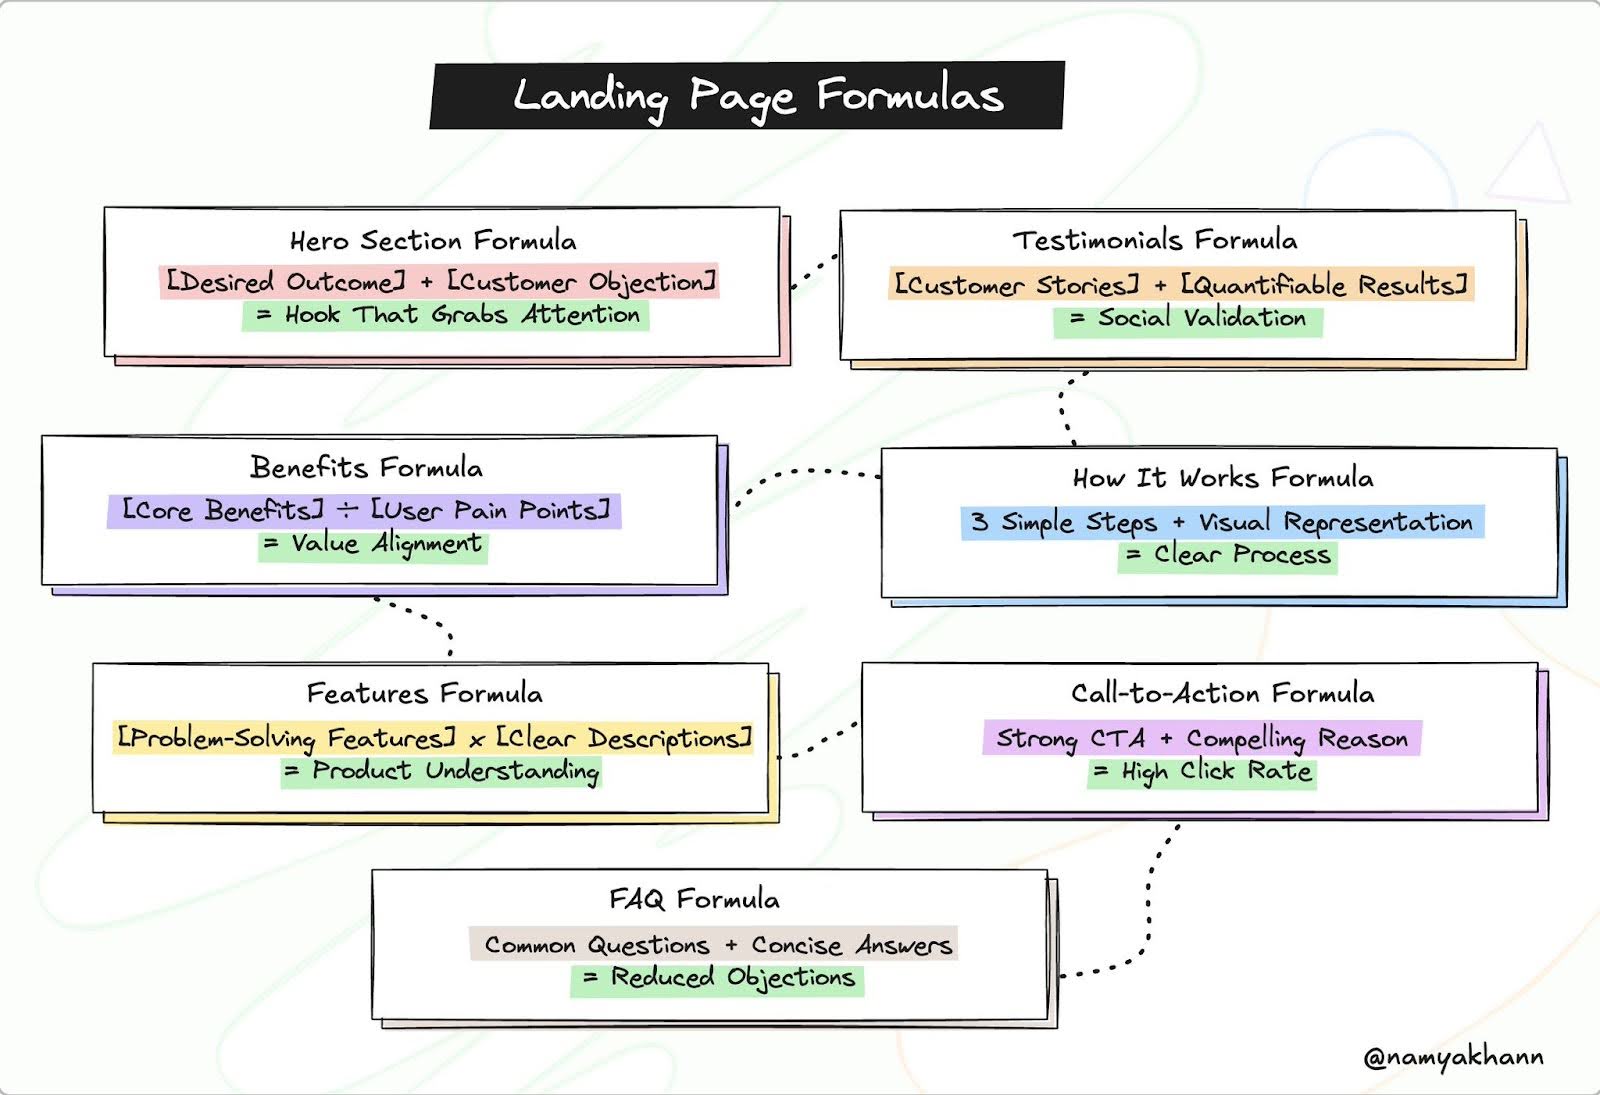
Landing Page Formulas
Ever get stuck staring at a blank landing page? This visual breaks down every piece into plug-and-play formulas. Each section...

Worlds Biggest Importers chart
This chart from Visual Capitalist turns dry trade data into a scroll-stopping infographic. It packs a global economy into colorful...

Texas Transit Department Billboard
A puppet with wide eyes and a panicked face isn’t what you expect from a serious PSA—but that’s exactly why...

Trello Feature and Benefit Callout Image
Trello nailed this visual. Instead of dumping text about what their boards do, they just show it — literally. The...
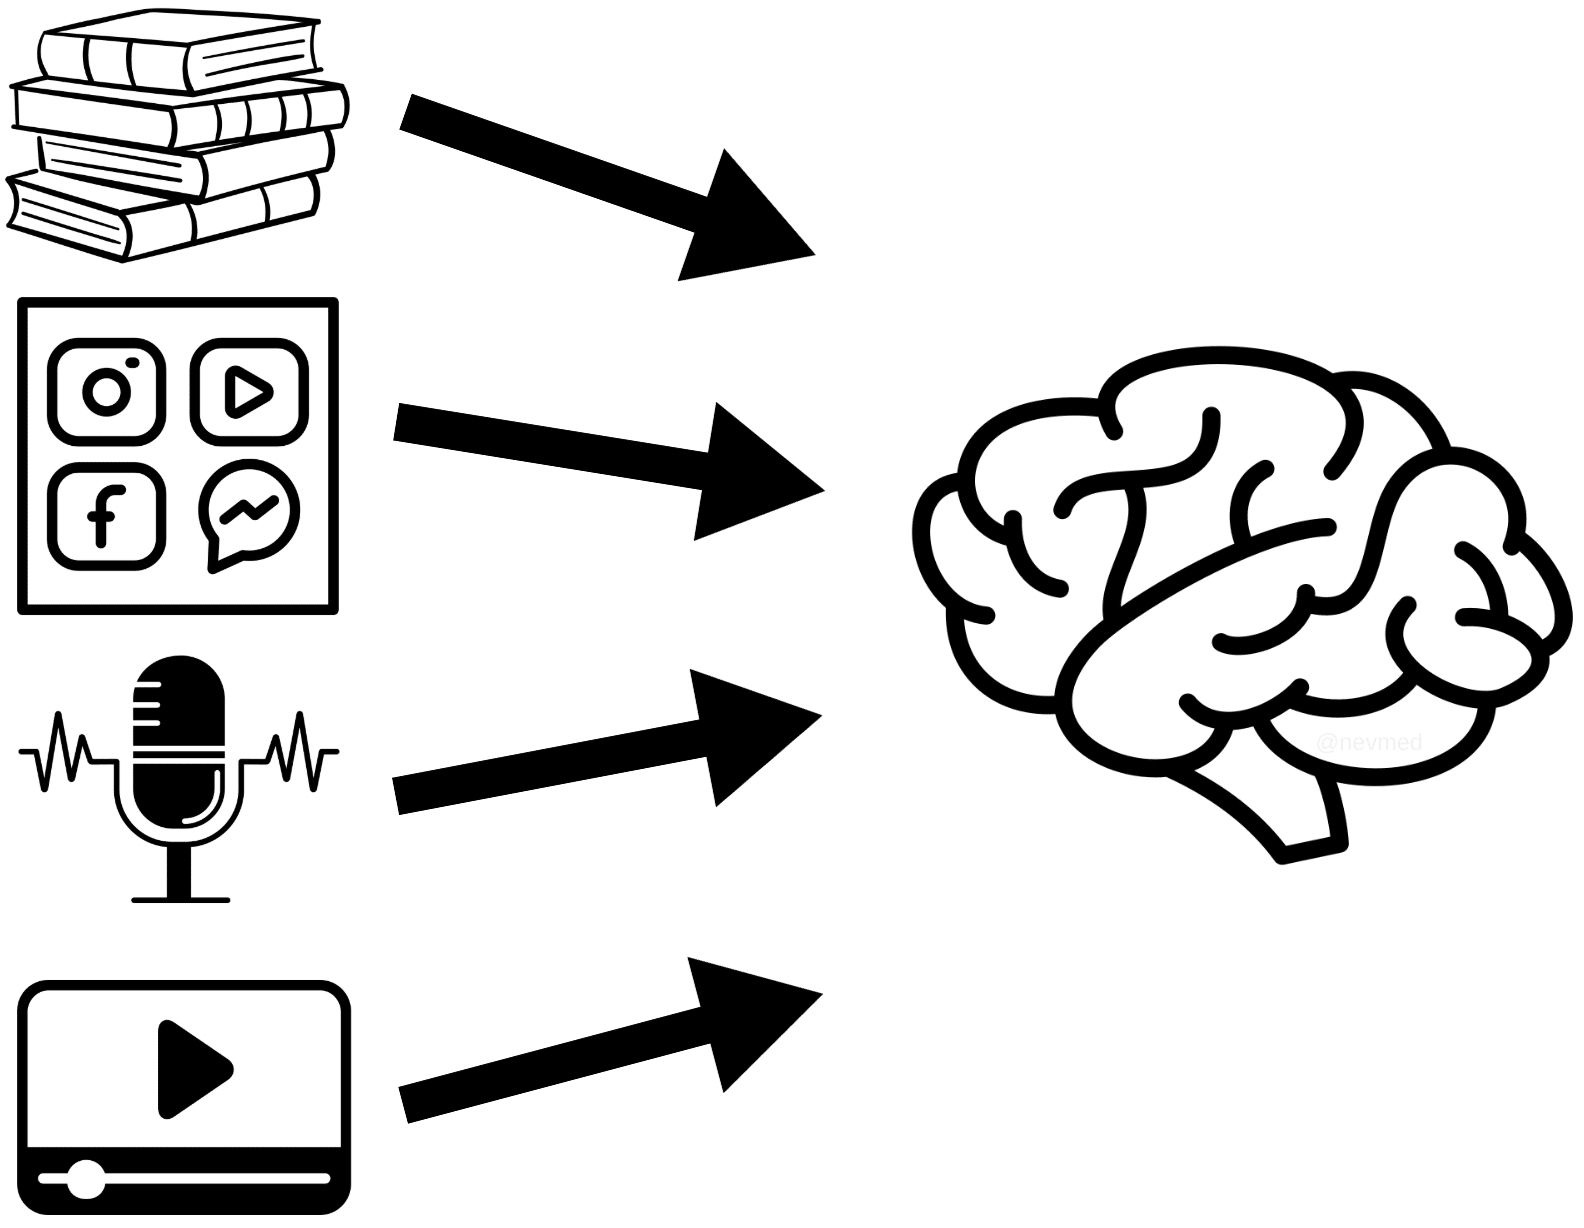
More than one way to absorb information
This graphic nails a huge shift in how people learn. It used to be books → brain. Now it’s books,...
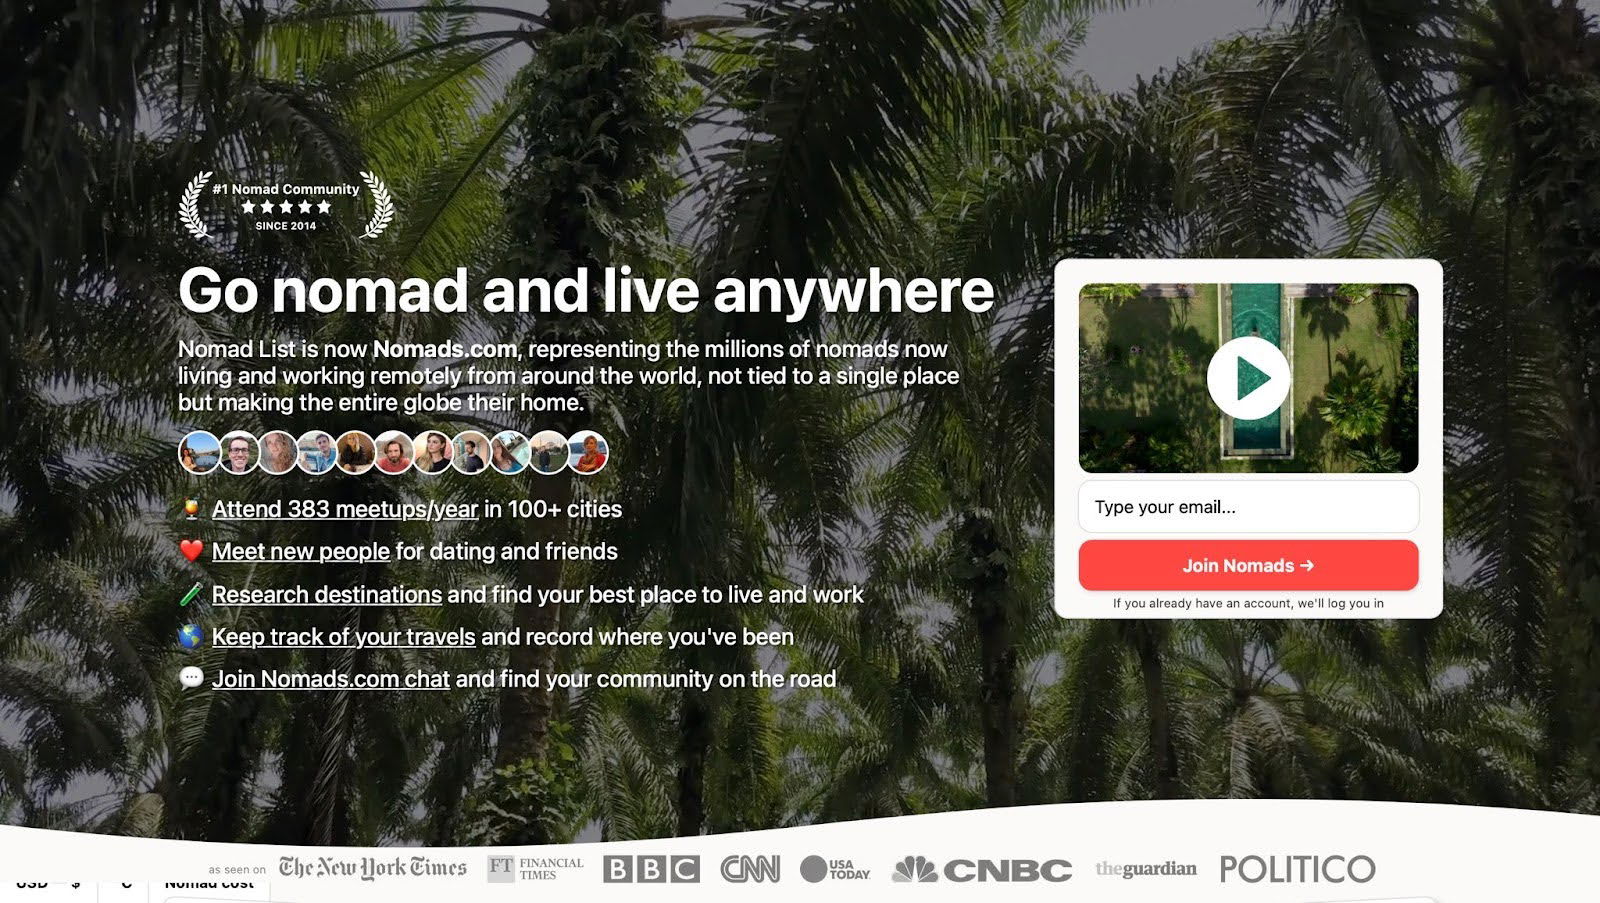
Go nomad live anywhere community
The Nomads.com landing page nails the “show, don’t tell” rule. One image shows a laptop, a view, and freedom. You...
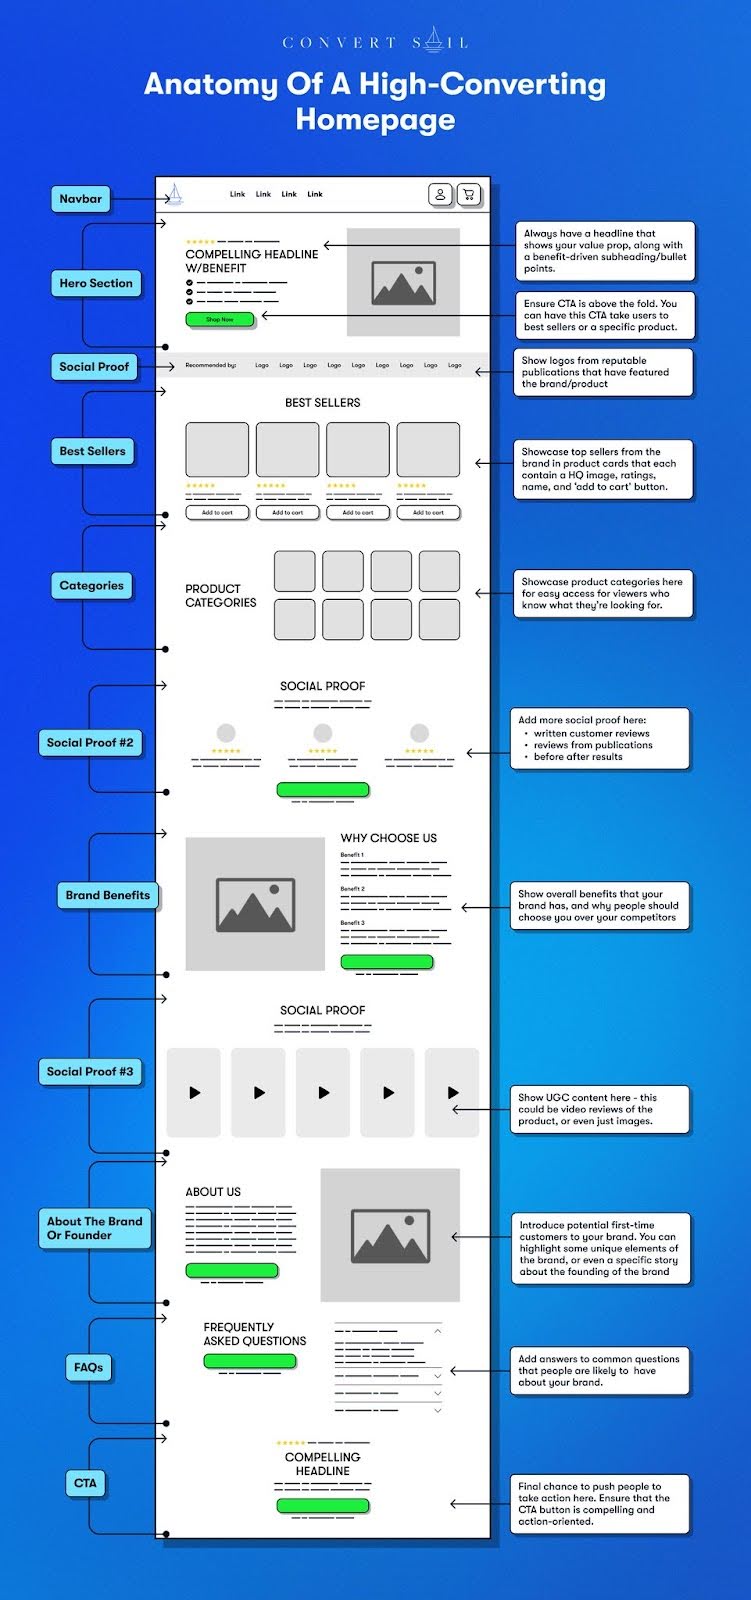
Anatomy Of A High-Converting Homepage
Convert Sail dropped a killer visual that breaks down what makes a homepage actually convert. Spoiler: it’s not fancy animations...
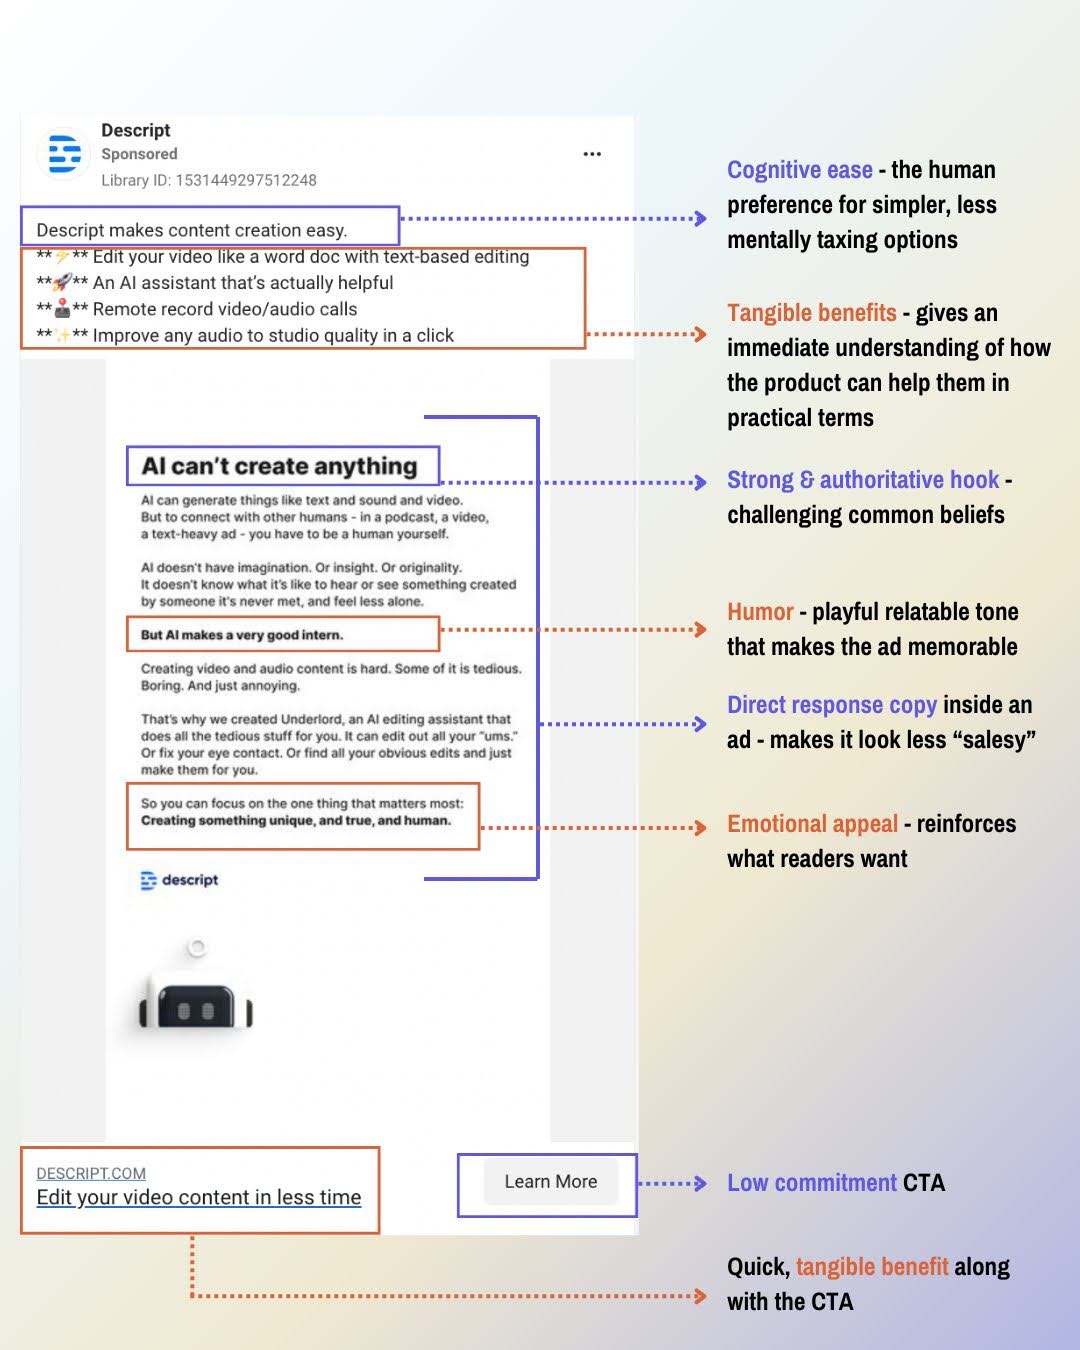
Descript Facebook Ad Breakdown
Descript’s Facebook ad is a masterclass in how to sell a complex product without confusing people. It mixes humor, clear...
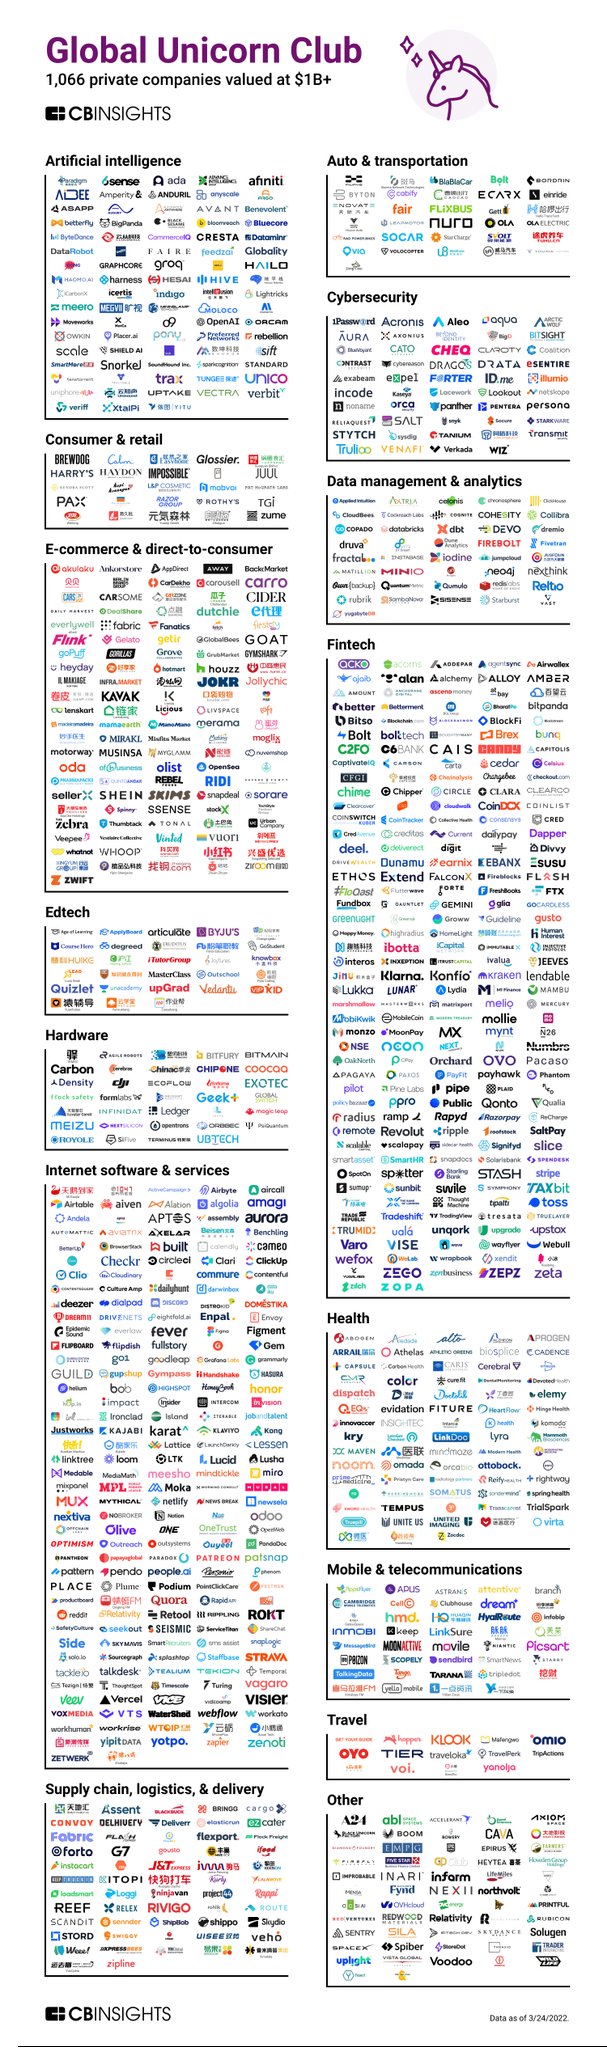
Global Unicorn Club update. 1,066 private companies valued at $1 Billion+
This chart from CB Insights shows 1,000+ billion-dollar companies divided by industry. And it’s so visually satisfying you can’t help...

Andrew Chen's 10 Metrics for Product Market Fit
Most founders celebrate a spike in signups from a social launch. But as Andrew Chen points out, those users often...

Unemployment "Book" Graph
Most unemployment charts are snooze-fests. But this one? It turns data into a fun visual by stacking colorful textbooks to...

The Sit Stand Test
This simple movement test says a lot about your physical health. But it’s also a clever metaphor for your marketing....
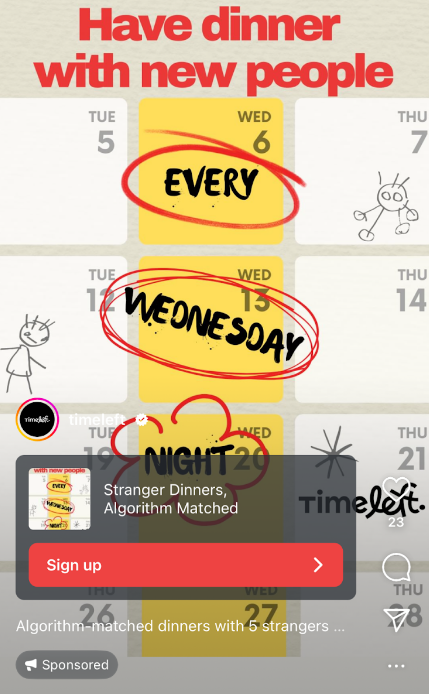
TimeLeft Fill Your Calendar Ad
This ad nails simplicity. A full calendar graphic, a bold headline that says “Have dinner with new people,” and big...
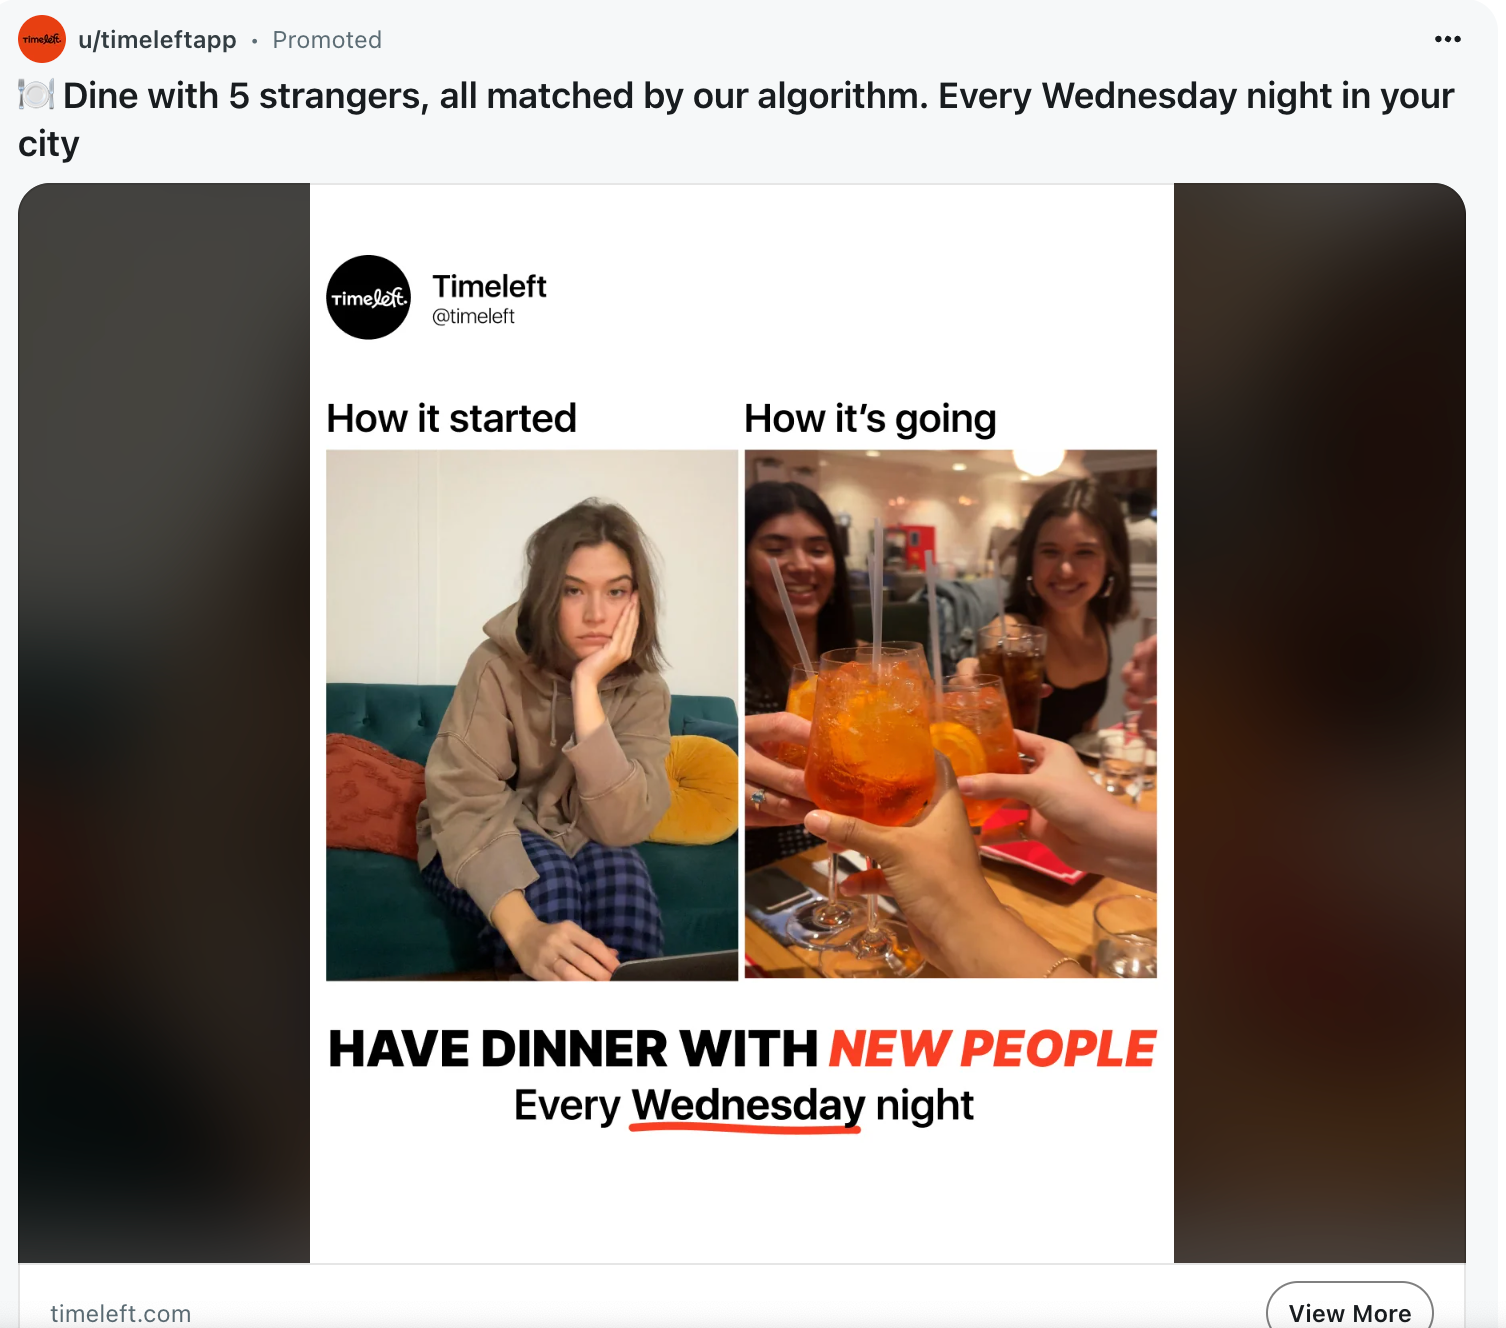
Dinner with strangers friend meeting service
This Reddit ad from Timeleft nails emotional contrast. It shows someone lonely at home on the left, then laughing with...
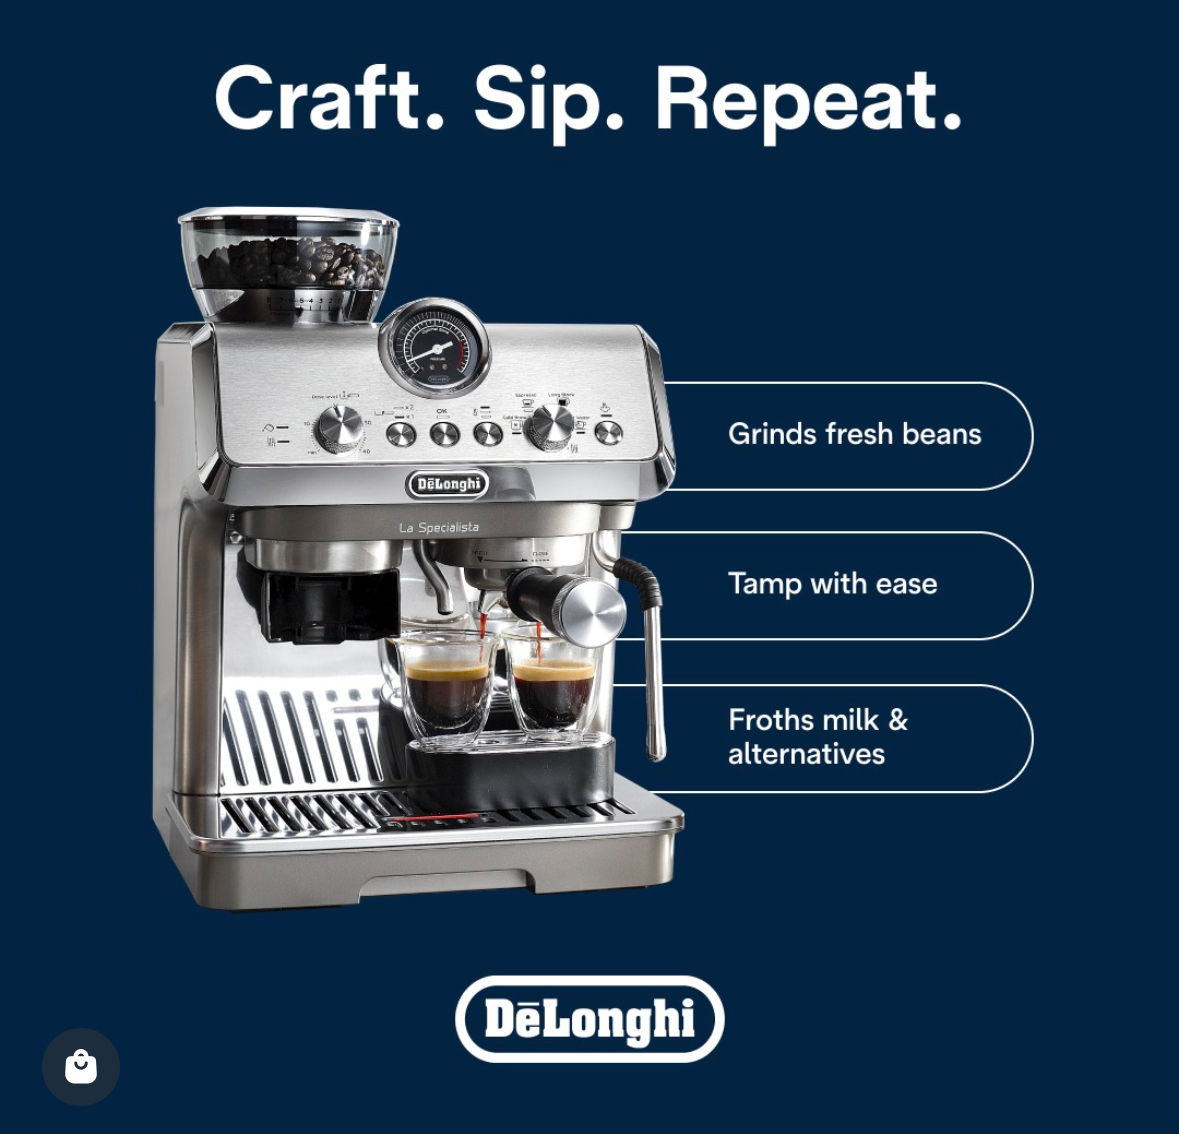
Delonghi Coffee Machine Text Markup Ads
DeLonghi’s Instagram ads are a masterclass in using text markup to spotlight features without overwhelming the viewer. Each post pairs...

Most popular grocery store by state
Here’s a smart twist on a boring data chart: instead of using a bar graph, this map shows the most...

Cool SwipeFile Newsletter Signup GIF
This image nails it. It instantly shows what SwipeFile emails are all about: marketing inspiration from legendary ads, packaged neatly...

Before and After House Exterior Makeover
Nothing beats a good before-and-after to show transformation. This house remodel pic says more than any ad copy could. It...
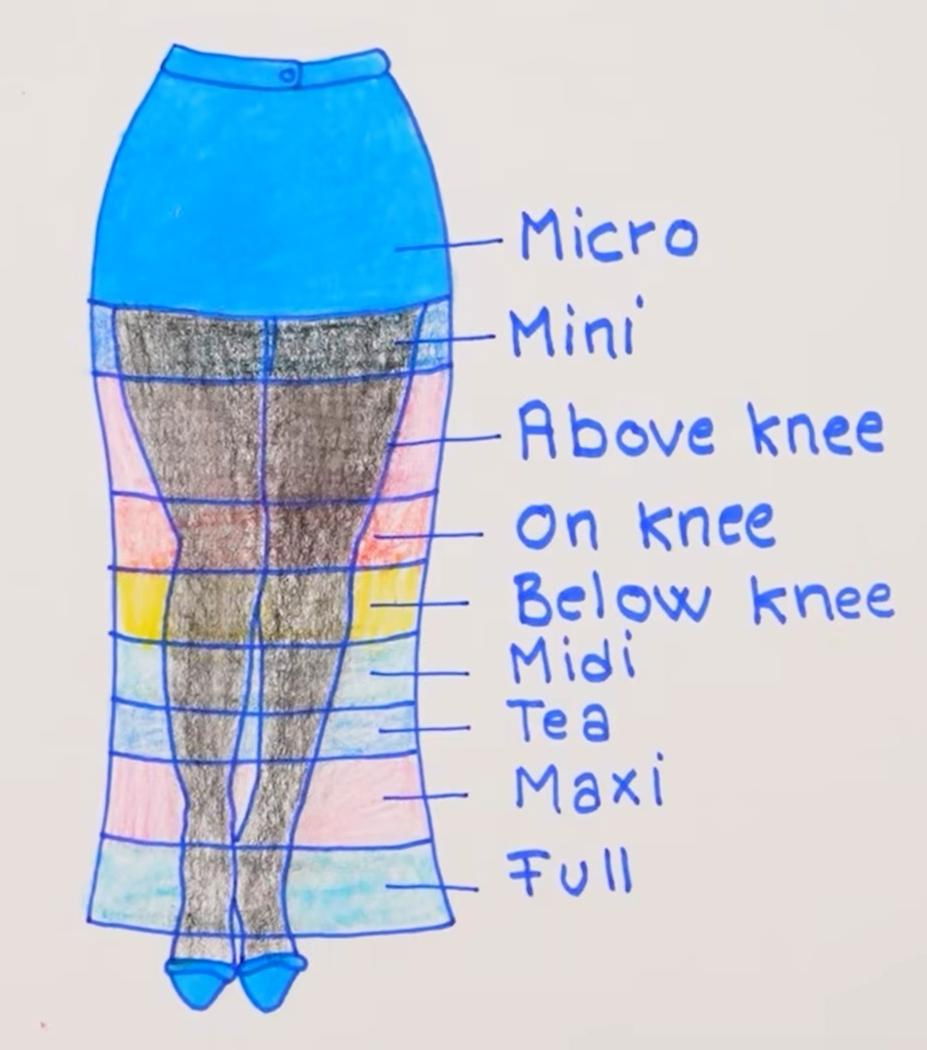
Skirt Length Chart
This hand-drawn skirt chart turns what could be a dull product guide into something instantly understandable and fun. One image...