1,913 Images and Illustration Examples That Teach Things
Drawings and illustrations and photography can transmit more information from human-to-human than text can. This board is perfect for designers and marketers seeking visual inspiration.
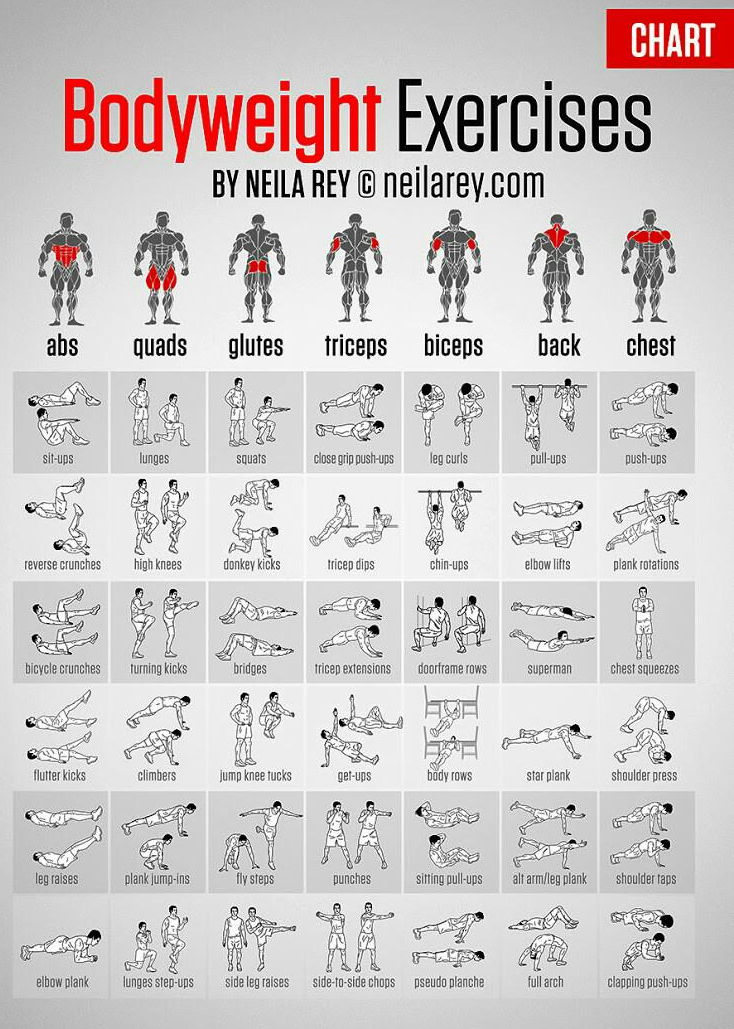
Bodyweight exercises you can do with no equipment
This bodyweight exercise chart by Neila Rey nails it. One glance and you instantly get what to do, which muscle...

App Store Rank vs Downloads graph
This chart shows the brutal drop-off in visibility vs downloads. The #1 app pulls around 90,000 downloads per day. Drop...
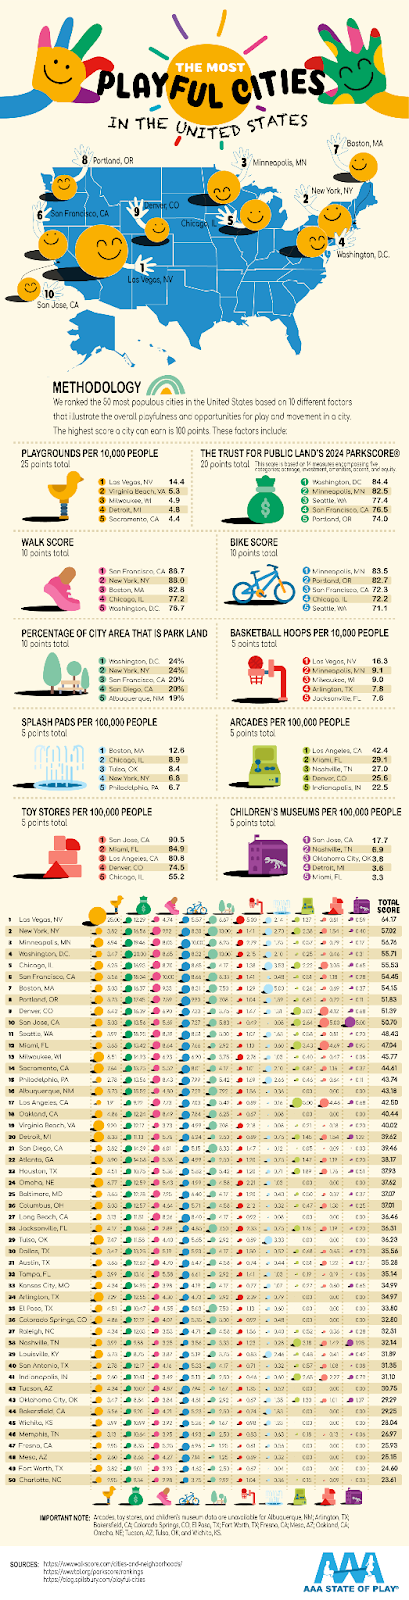
The most playful cities in the US
This infographic ranks U.S. cities by playfulness—based on playgrounds, parks, splash pads, toy stores, and more. It’s bright, fun, and...
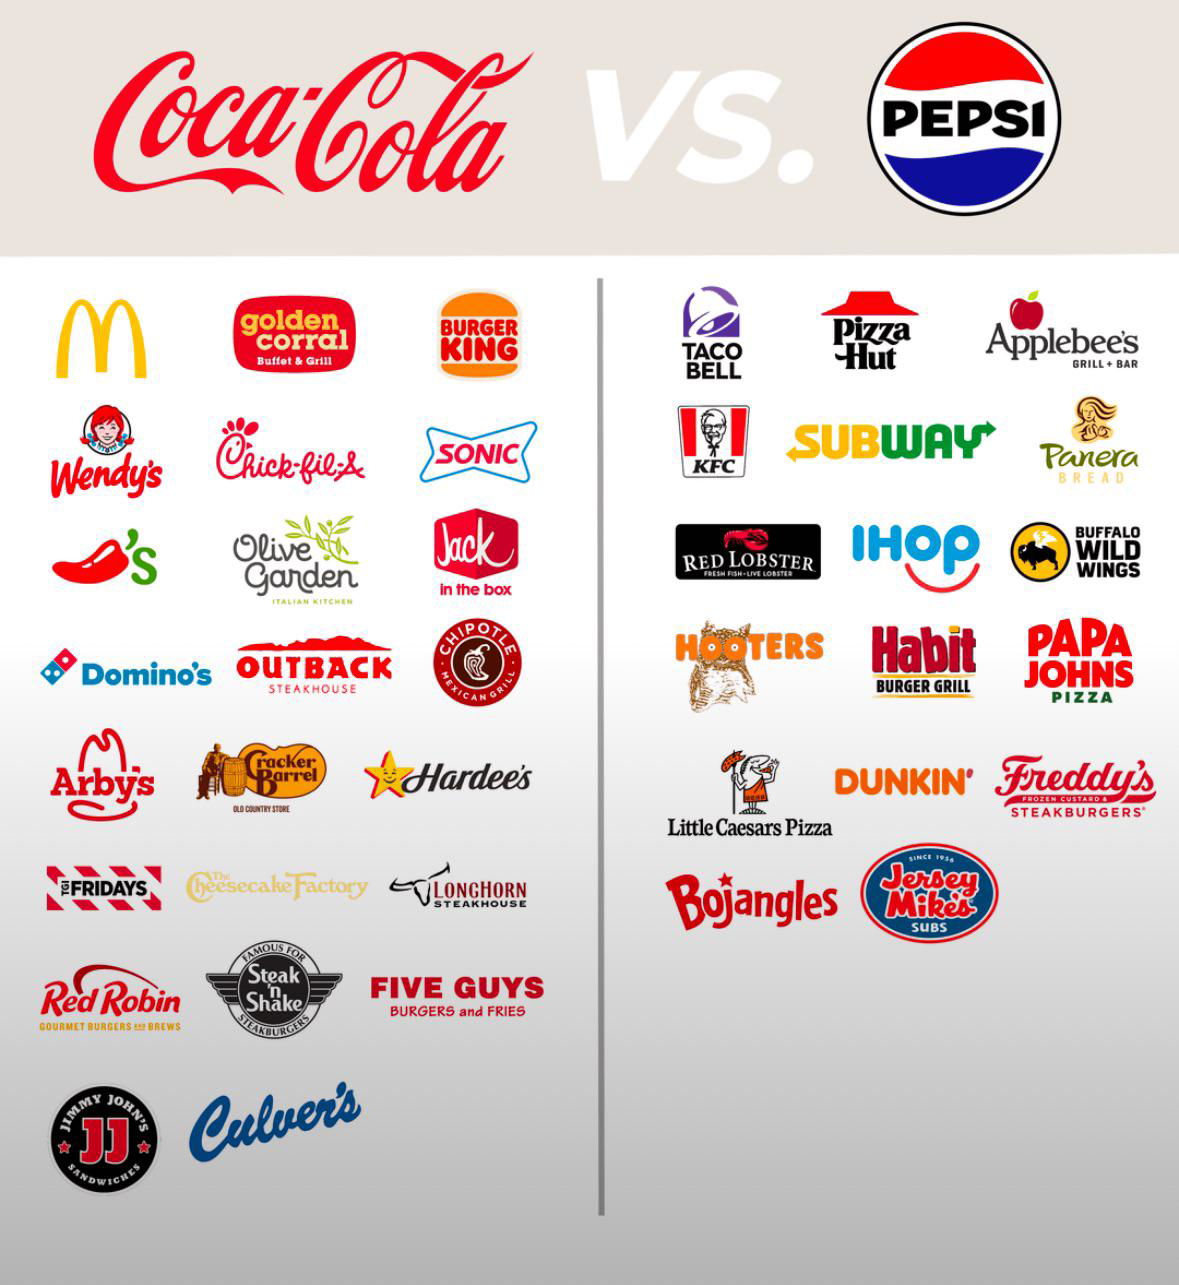
Coca-Cola -vs- Pepsi Exclusive Brand Deals
Coke vs. Pepsi isn’t just about taste. It’s about territory. The image shows the battlefield: fast food and restaurant chains...
Justin Moore's Sponsor Magnet Book
Justin Moore’s Sponsor Magnet nails the concept of visual marketing. One glance and you know exactly what this book promises—turning...
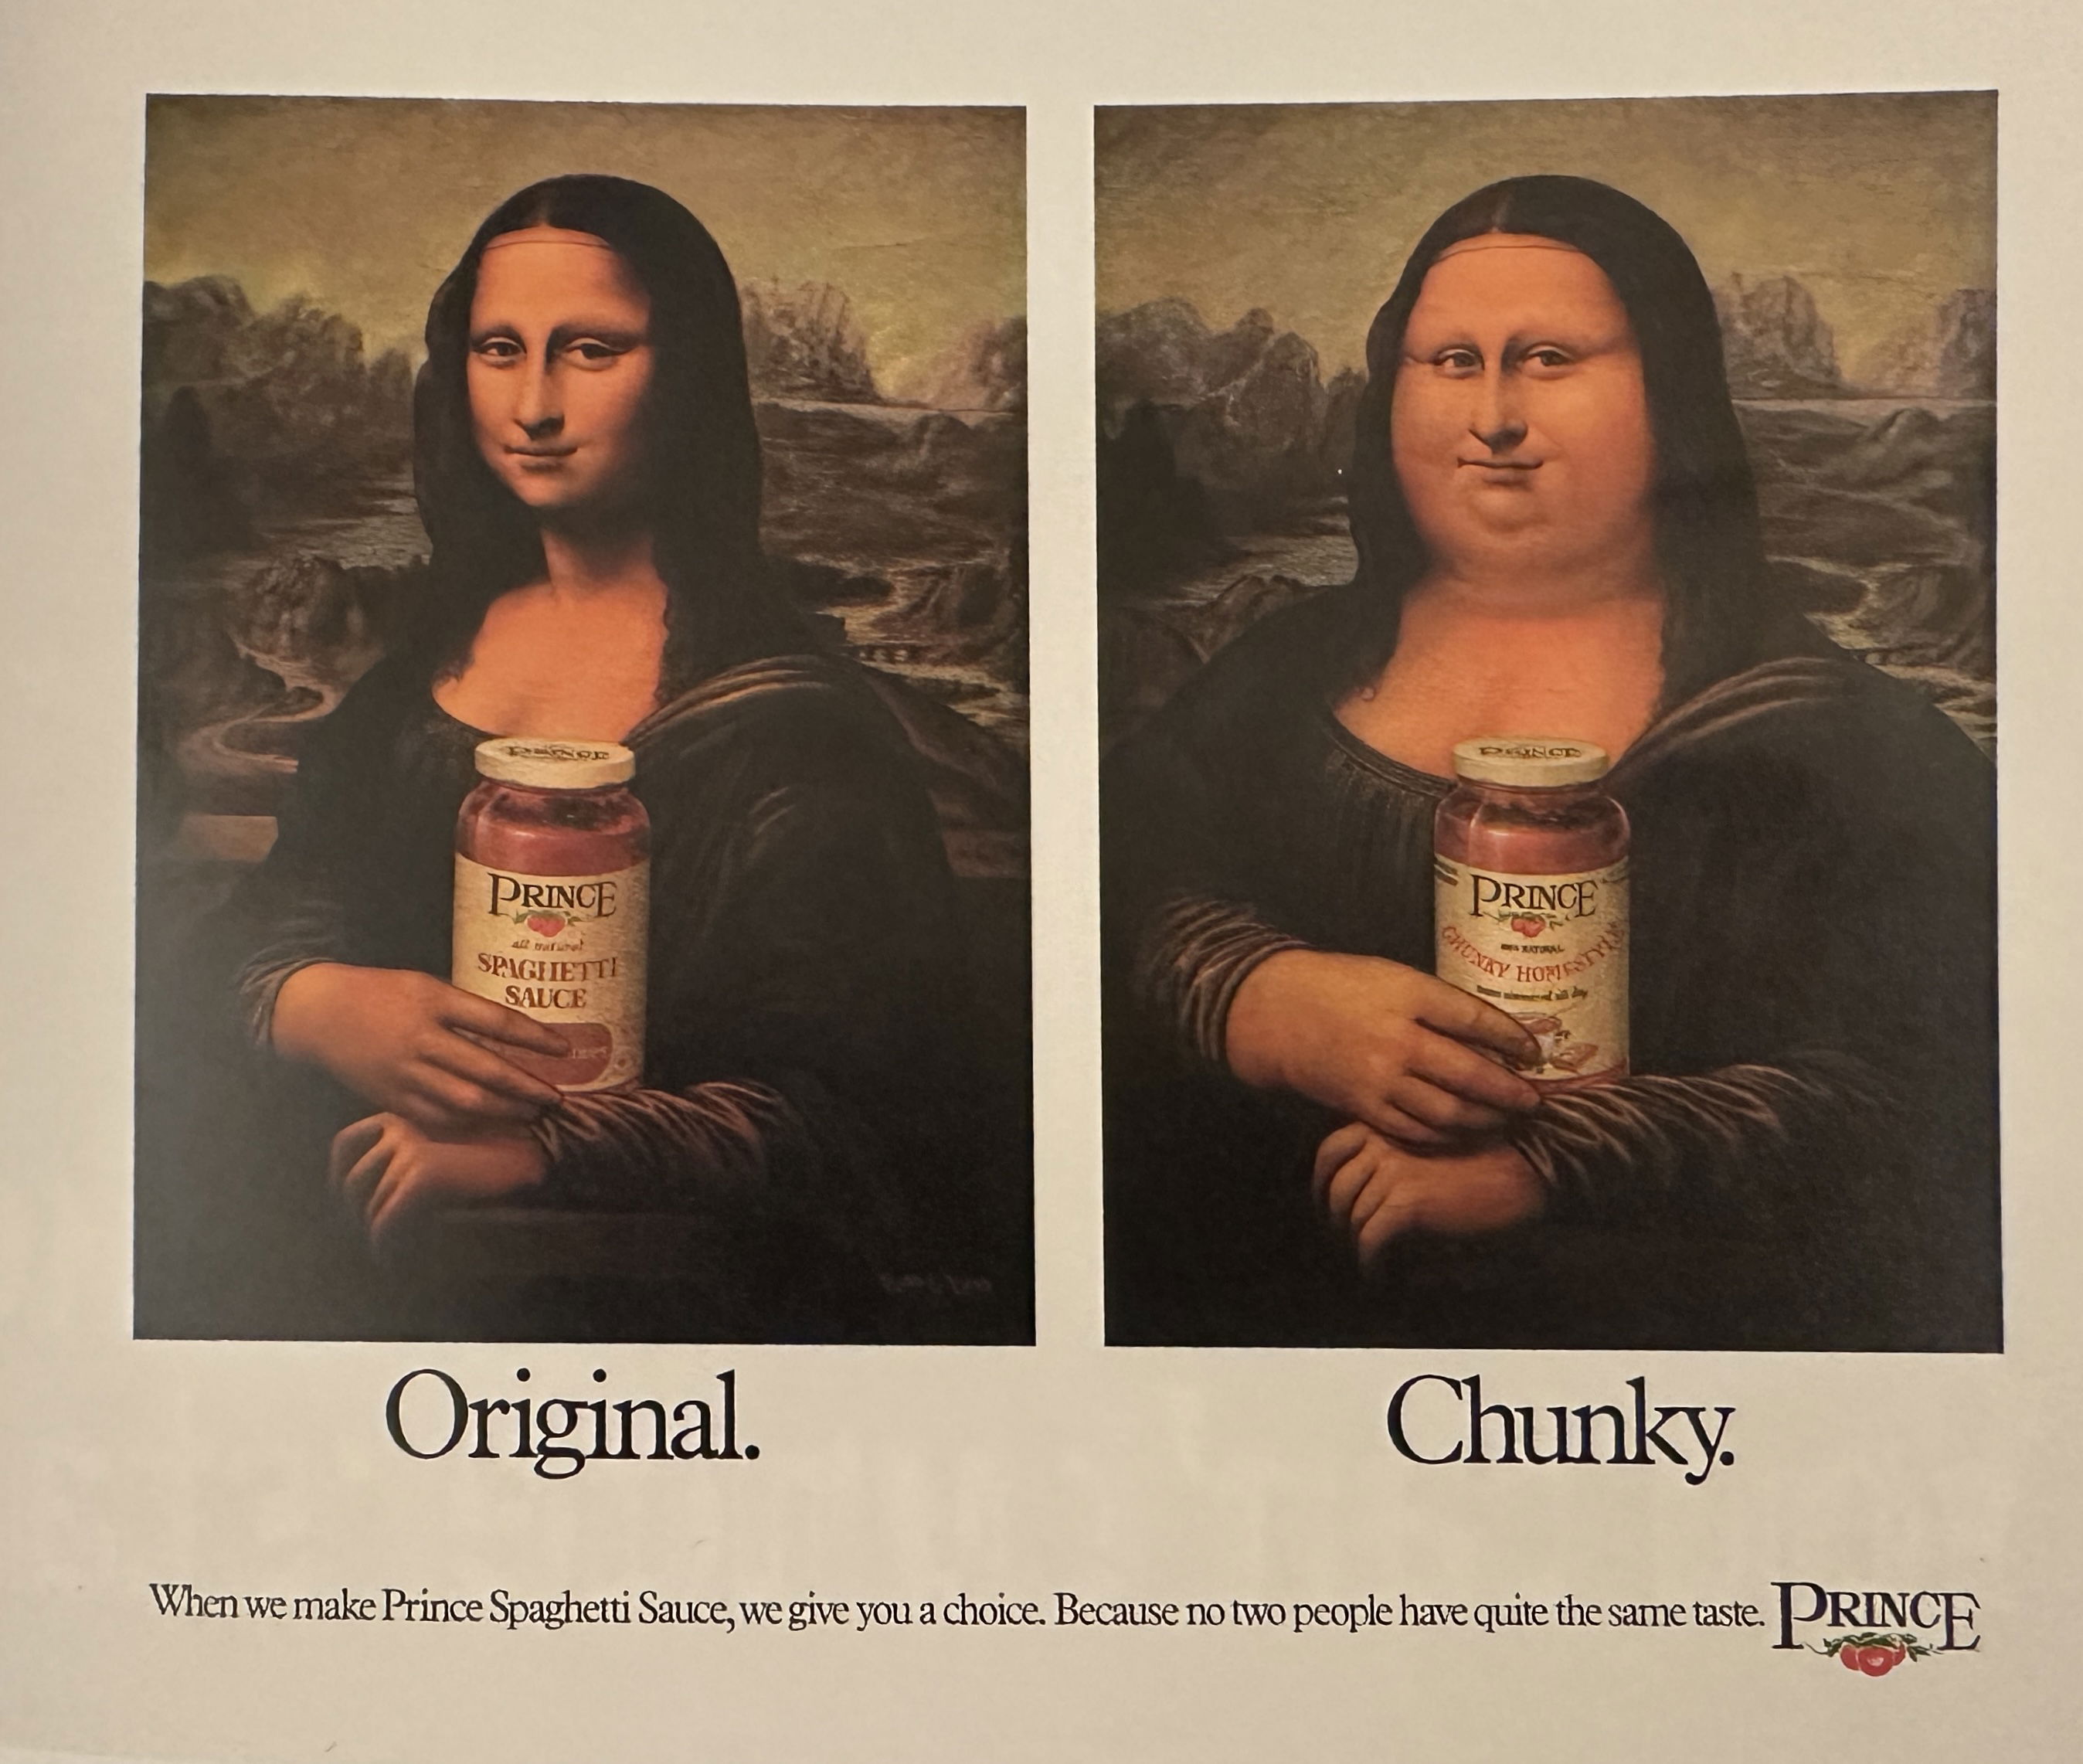
Prince Chunky Spaghetti Sauce Print Ad
This old-school ad from Prince Spaghetti Sauce nails “simple idea, strong visual.” It shows two Mona Lisas holding sauce jars—one...

Public VS Private Sector Innovations
This image perfectly highlights a truth marketers should love: competition breeds innovation. The private sector's “then vs. now” shows giant...

Magic Mind "Caffeine Free Energy" Email
Magic Mind took a chill approach to selling energy. Their ad flips the high-caffeine, high-anxiety model on its head with...
If you have to change only ONE thing...
Ever get overwhelmed trying to fix everything in your marketing at once? Website, ads, copy, design... it feels endless. Instead,...
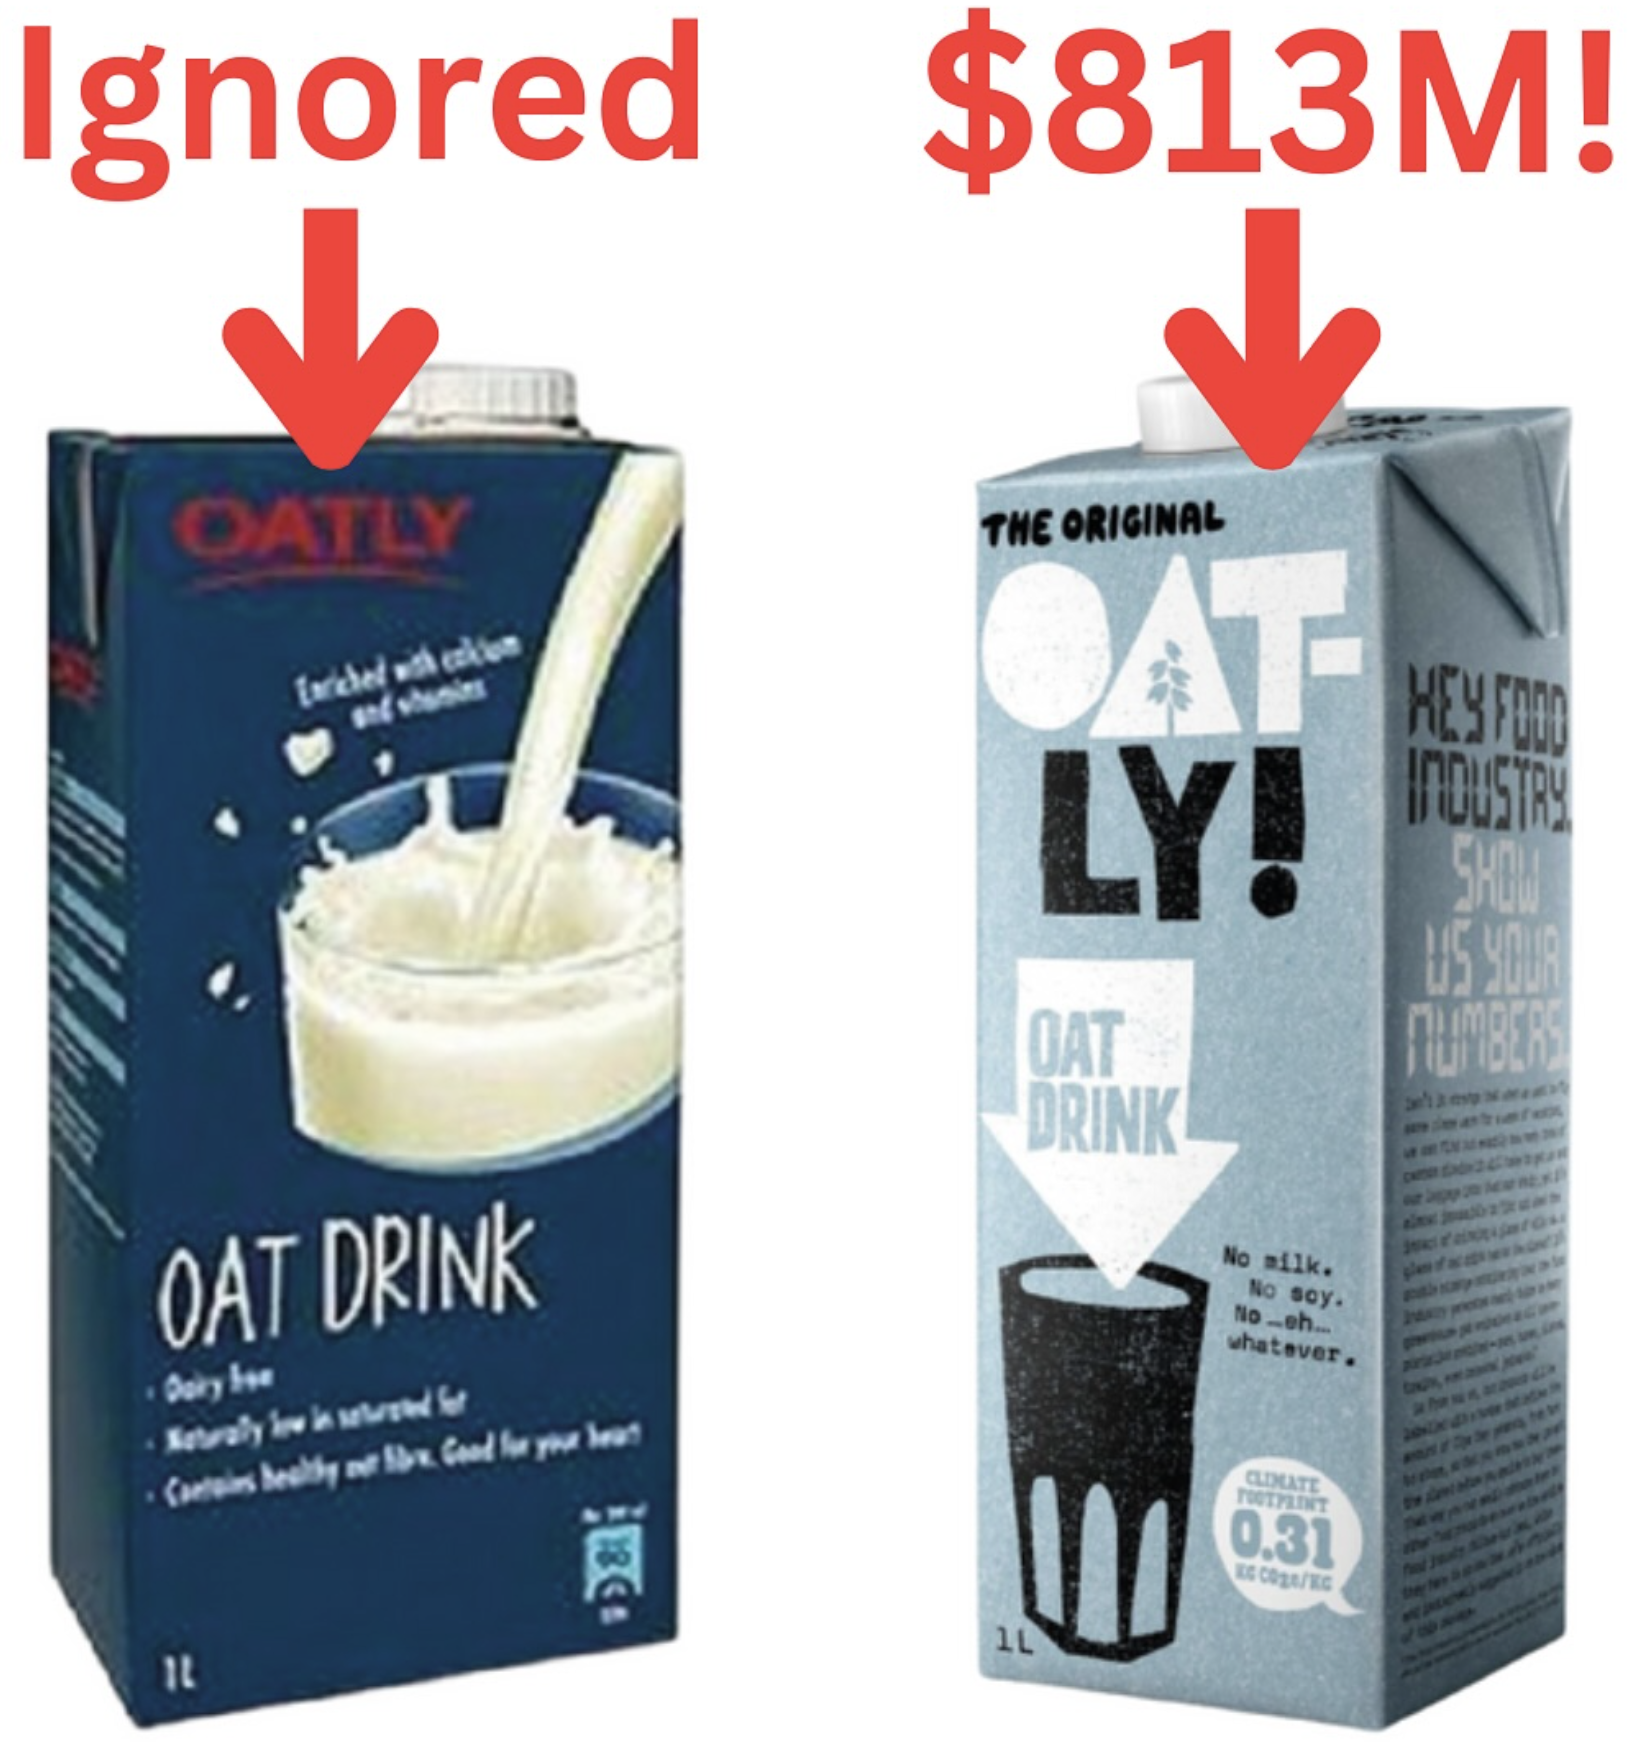
Oatley Milk Before/After Branding
Oatly’s old packaging looked like every other “healthy” drink—plain, blue, boring. Then they flipped the script and built an identity...

Sketch to finished website design
This image shows a creative agency’s transformation from a napkin sketch to a polished website. It’s a killer visual metaphor...
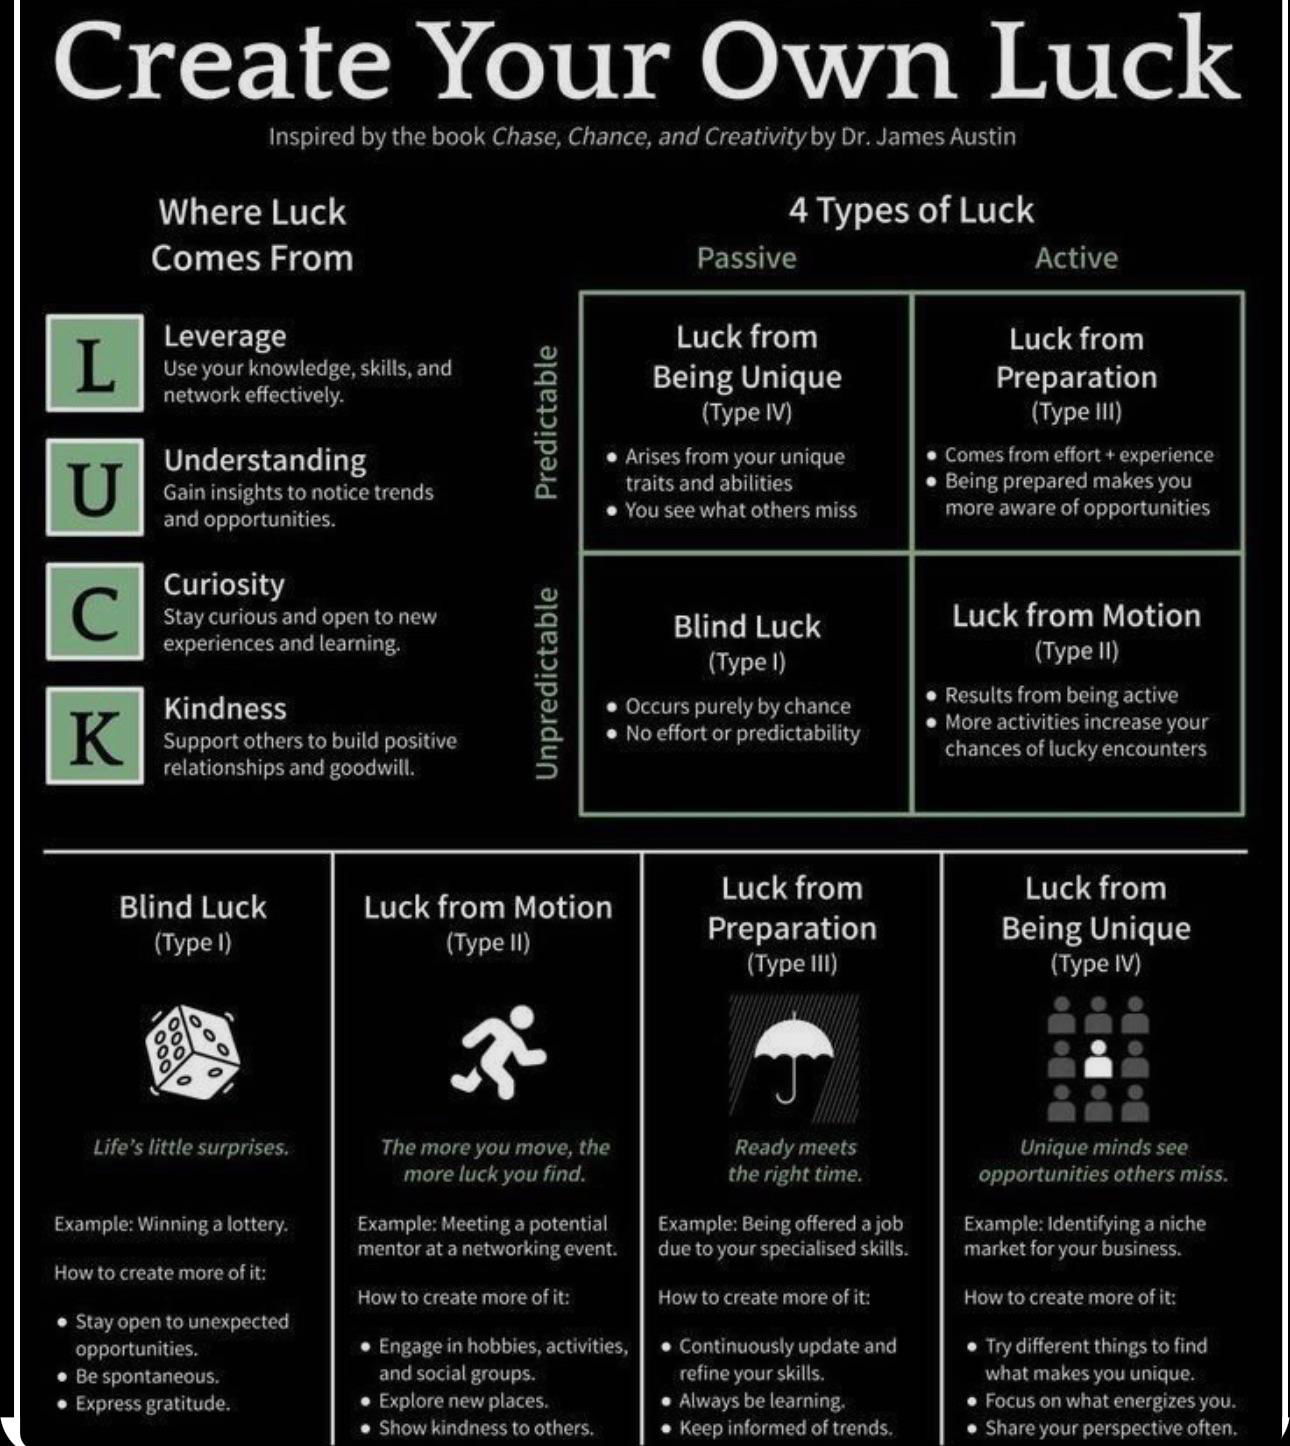
Create your own luck chart
Ever noticed how some marketers always seem to “get lucky”? New clients drop into their lap, their campaigns go viral,...

Boeing 737 cockpit with callouts
This photo nails how to teach something complex in a simple, funny way. Instead of a wall of buttons, it...

Chocolate Exporters Chart
This treemap is delicious… and data‑driven. Each chunk of chocolate represents a country's share of global chocolate exports. Germany dominates...
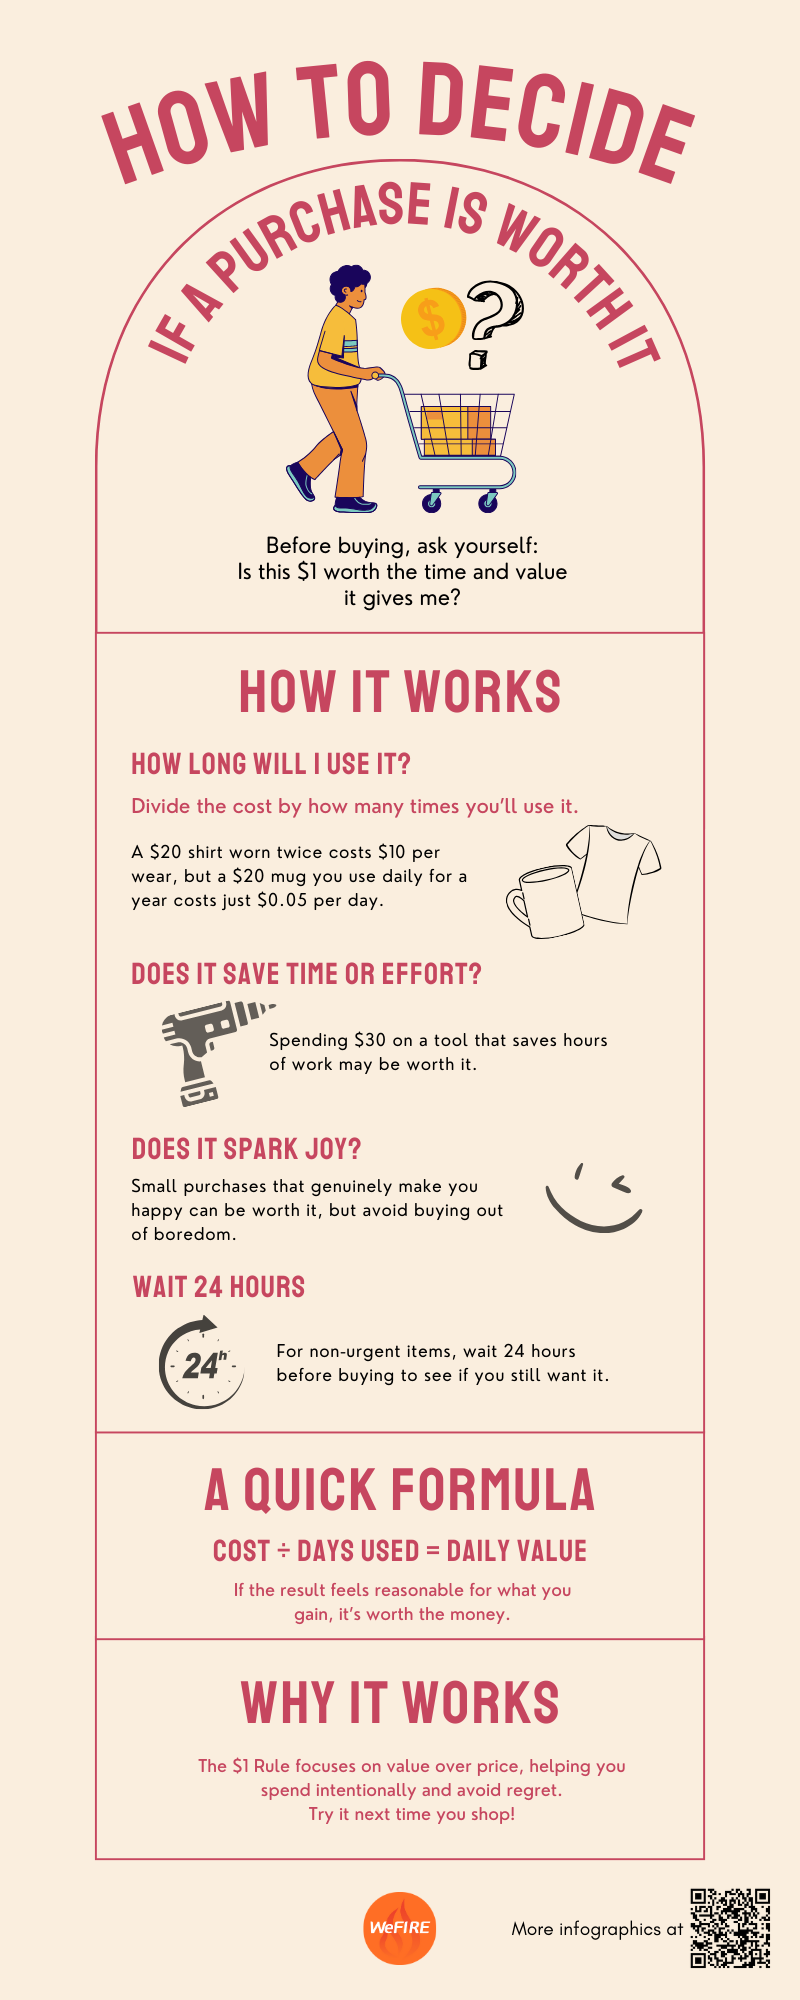
Is this purchase worth it?
This infographic nails a simple money principle that marketers can flip into a messaging trick. It’s all about reframing cost...

Unicorn club list - Private companies over a billion
This graphic by CB Insights shows the 1,249 billion-dollar private companies around the world. That’s a lot of brands flexing...
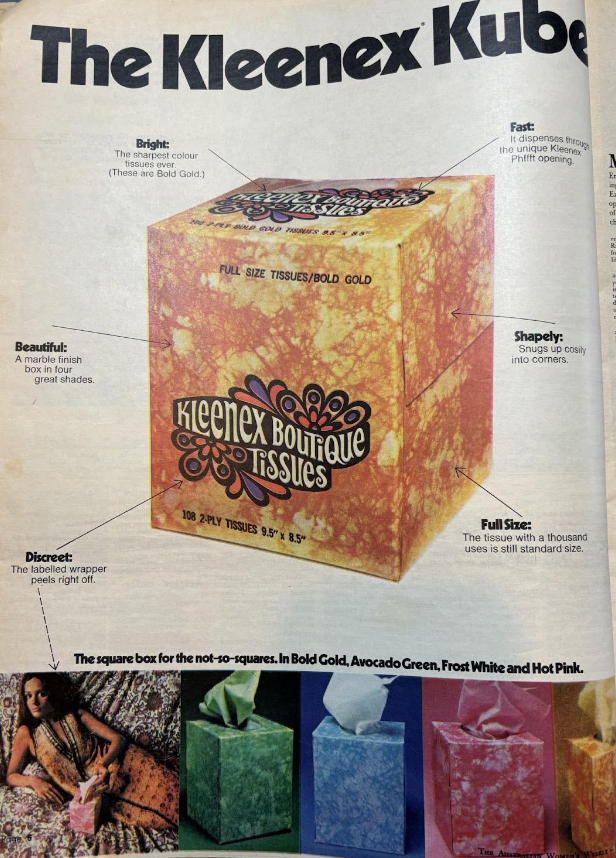
Kleenex Kube Vintage Print Ad
This vintage ad nails visual storytelling with a single cube of tissues. Kleenex didn’t just change the shape—they created a...
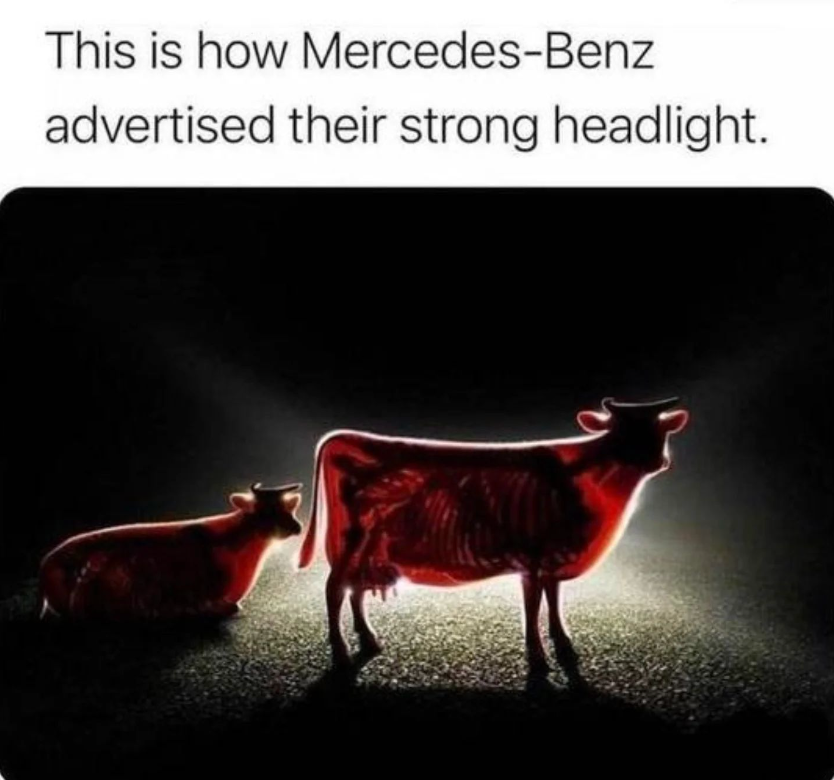
Mercedes-Benz Strong Headlight Cow Ad
A super clever way from Mercedes to show how strong their headlights are, featuring a cow in headlights that's see-through...
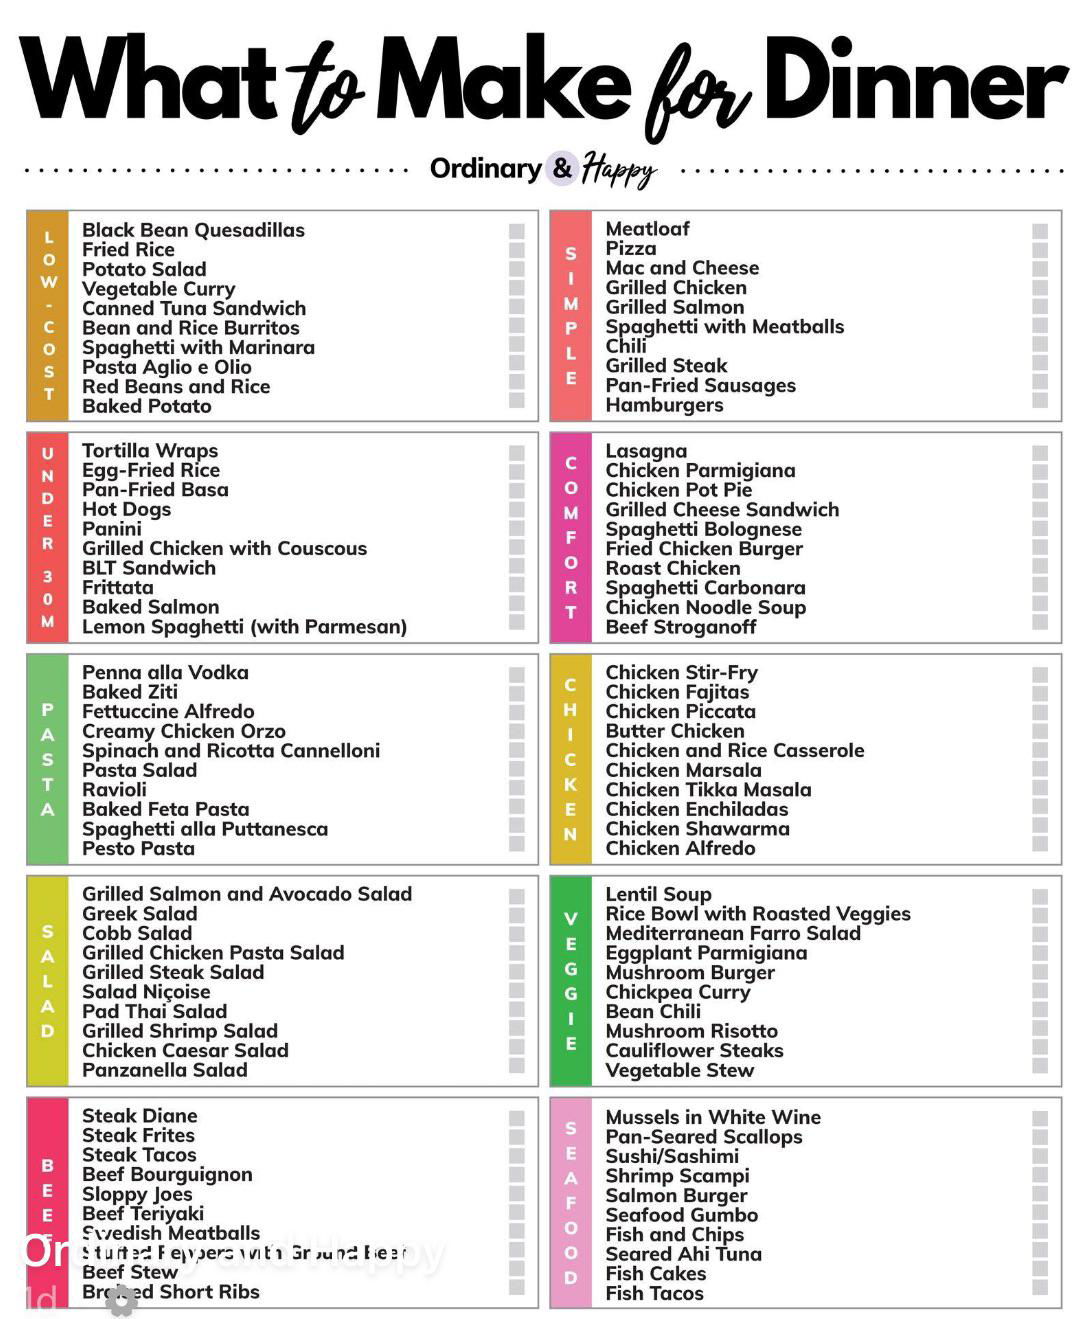
What to make for dinner?
Ever stare at the fridge and think, “What the heck do I eat?” This brilliantly simple dinner chart cuts through...
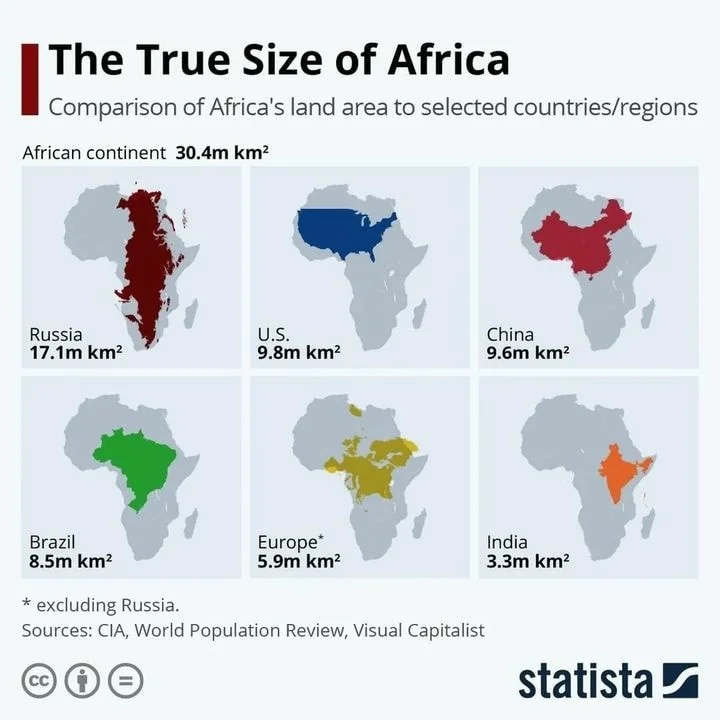
Comparison of Africa's Landmass To Other Countries
This chart hits like a revelation. The entire U.S., China, and India combined could fit inside Africa—and still leave room....

Best TV Shows of All Time Graph
This chart mashes up data from multiple rating platforms to reveal the top-rated TV shows of all time. It’s a...

Tesla Interior Refreshes and Simplicity
Tesla interiors started with buttons everywhere. Over the years, they’ve stripped it all away—leaving one big touchscreen and a clean,...
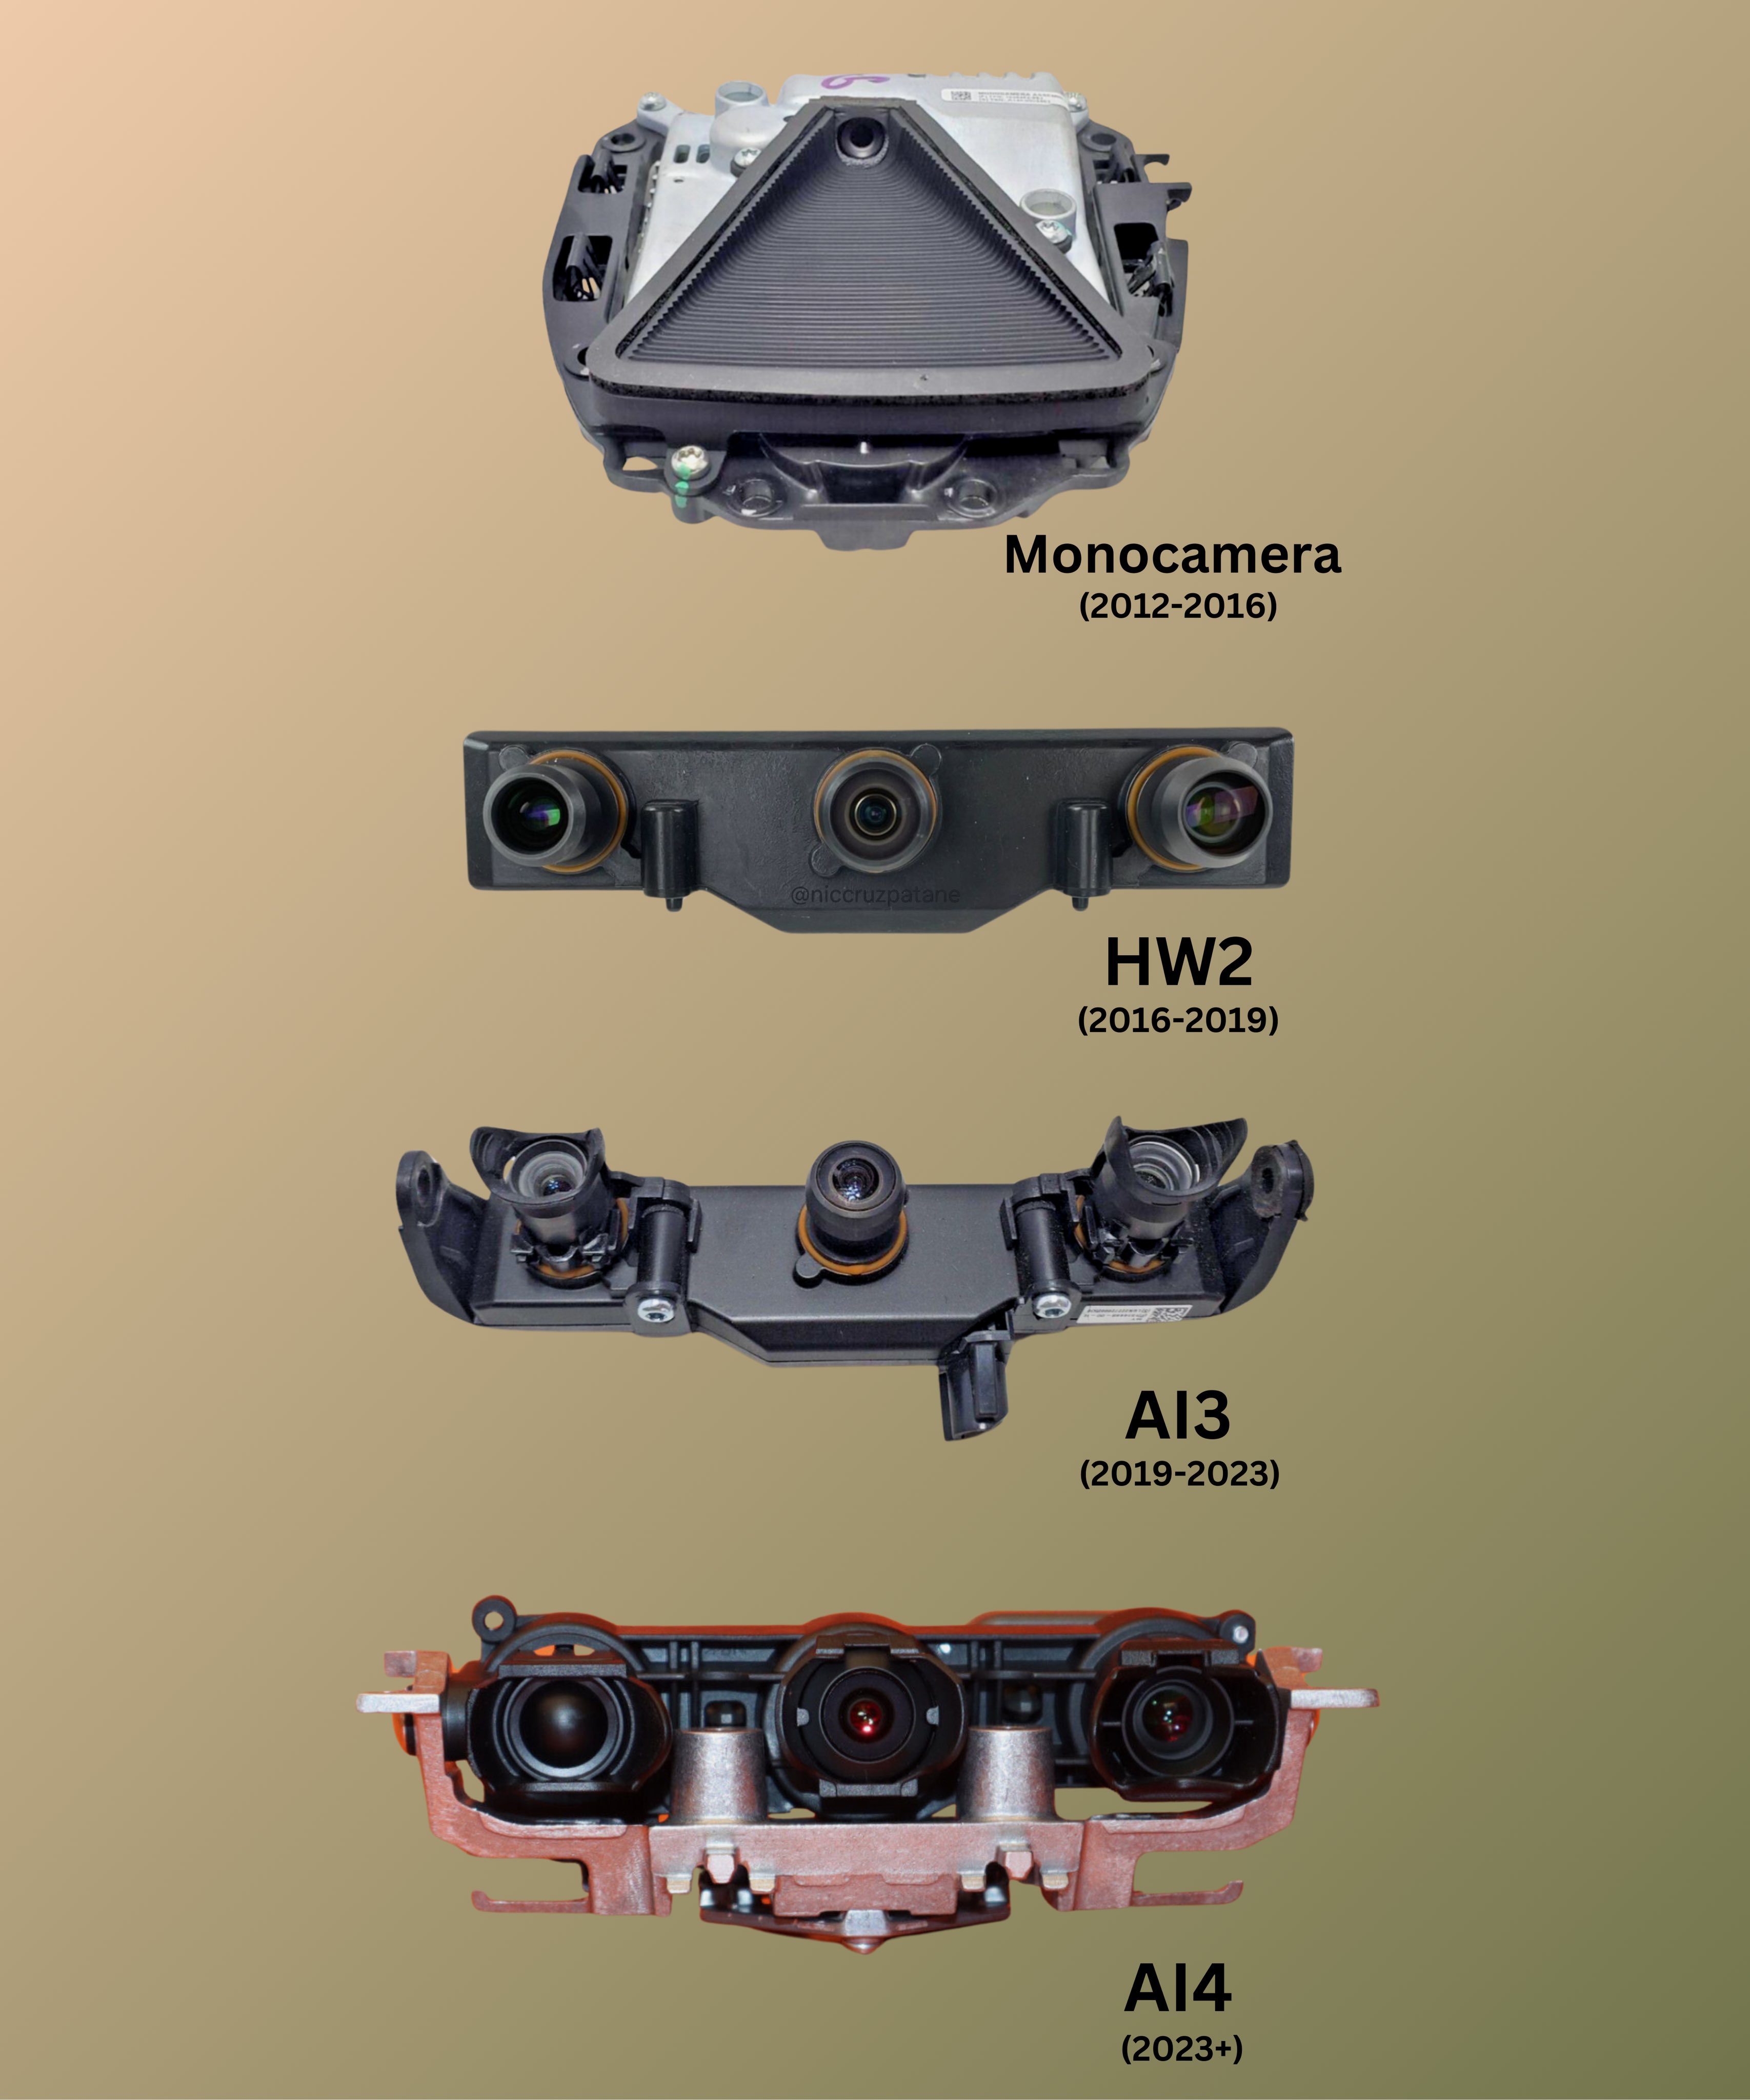
Tesla front self driving camera stack over the years
This image of Tesla’s front-facing dash cams shows one thing perfectly: clear visual progress. Each generation looks sleeker and smarter....
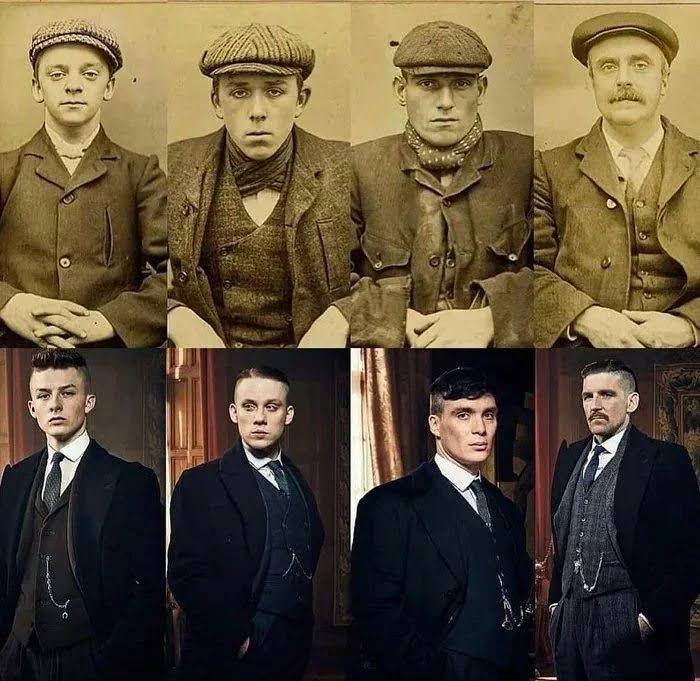
Peaky Blinders Real Life to Characters image
One image, two rows, and a flood of context. This Peaky Blinders comparison instantly shows the transformation from real-life gangsters...