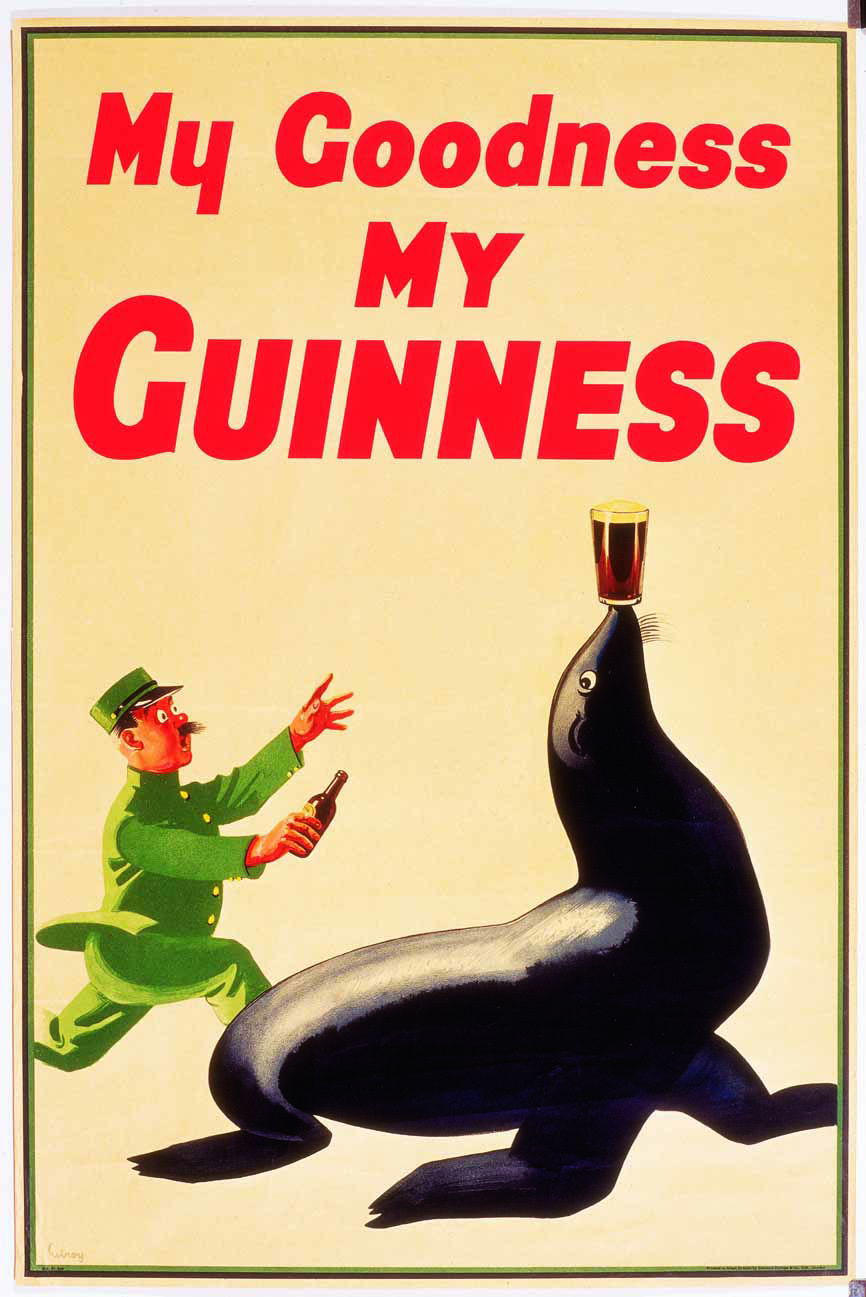
The Seal That Sold Guinness
This classic Guinness ad nails memorability with humor and visual storytelling. A zookeeper chases a seal balancing a pint—simple, funny,...

How Guinness Made a Toucan Sell Beer
Guinness nailed simple, memorable advertising with this old-school toucan ad. Just one image and a few words make the brand...

Why This Guinness Ad Is Still Marketing Gold
This Guinness ad nails something most modern campaigns forget: pure visual joy. The image of flying toucans balancing pints in...

The Ad That Flipped the Script on Masculinity
This Daihatsu Hijet ad takes a cheeky jab at traditional car marketing. Instead of selling “sex appeal,” it celebrates practicality...
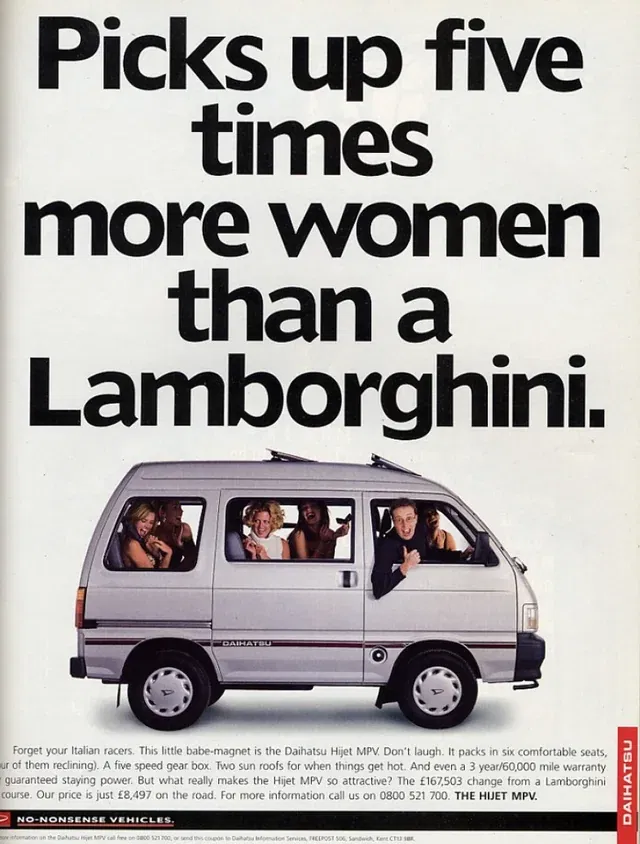
This Van Outsmarted Lamborghini’s Marketing
Sometimes the best way to sell is to poke fun at your competition. Daihatsu’s ad claims their van “picks up...

Porsche Makes Luxury Feel Guilt-Free
This ad nails emotional reframing. Porsche takes something often seen as selfish—buying a sports car—and spins it into an act...

eCommerceFuel pricing page
This pricing table nails how to sell value instead of features. It’s not just a list of deliverables—it’s a transformation...
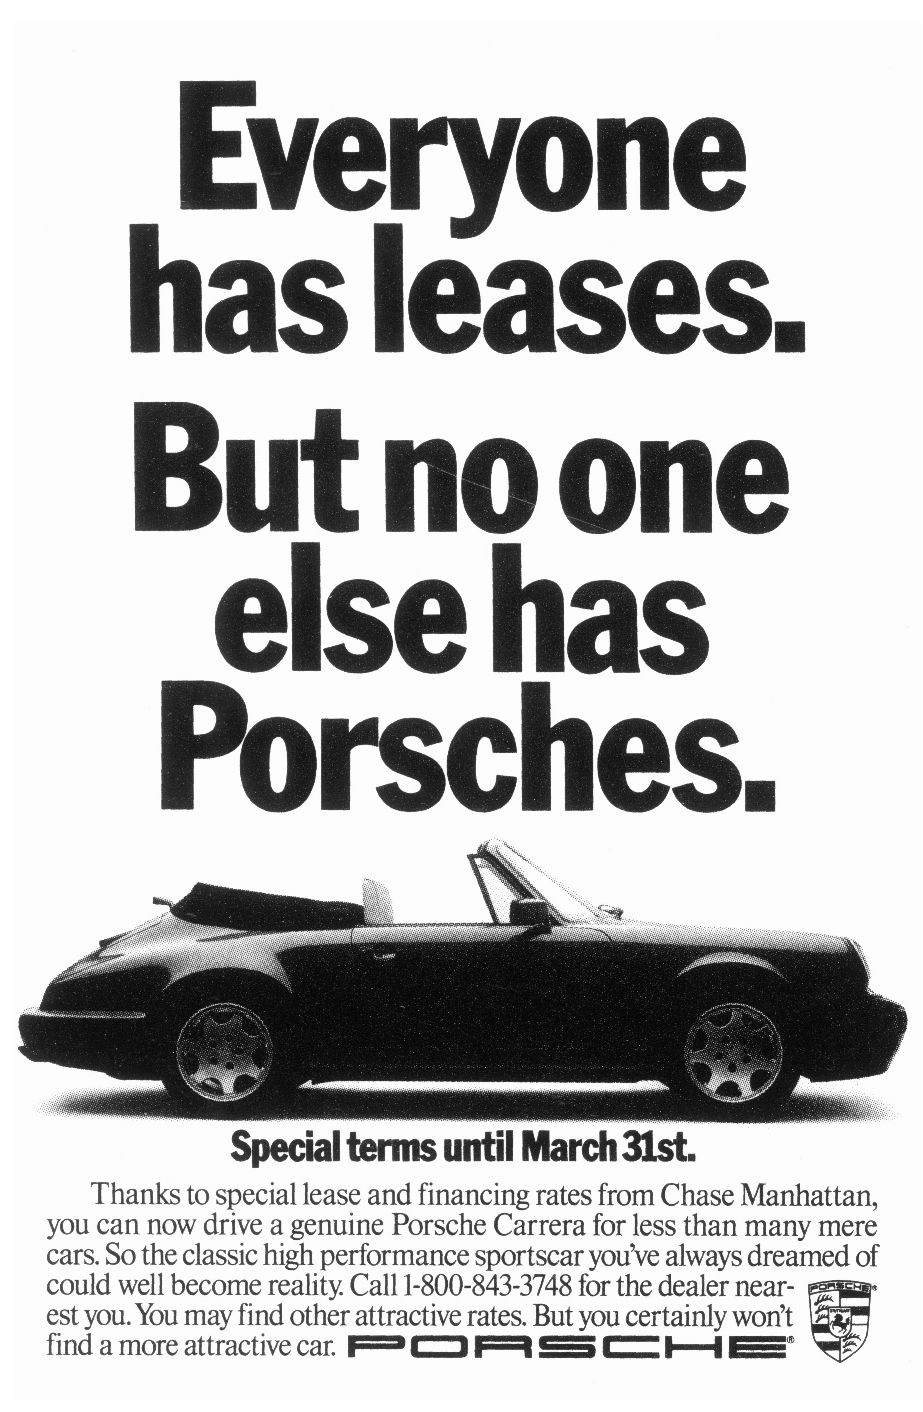
Everyone Has Leases. But No One Else Has Porsches.
This Porsche ad nails the art of exclusivity. It takes something ordinary (leasing a car) and flips it into something...

Porsche Makes Health Sound Fast
Sometimes the best way to sell luxury? Don’t sell it. Instead, make it sound like common sense. That’s exactly what...

Beat the Tax, Beat Everyone Else
This Porsche ad nails the magic of using urgency and status in one clean shot. The headline “Beat the luxury...

The Ultimate Souvenir: A Porsche
Ever notice how this Porsche ad makes you feel a little boring for just taking travel photos? That’s intentional genius....

Eight sleep email gif targeting specific customers
The eight sleep email it came from: This image nails personalization with just one word: “Dear” It feels like a...
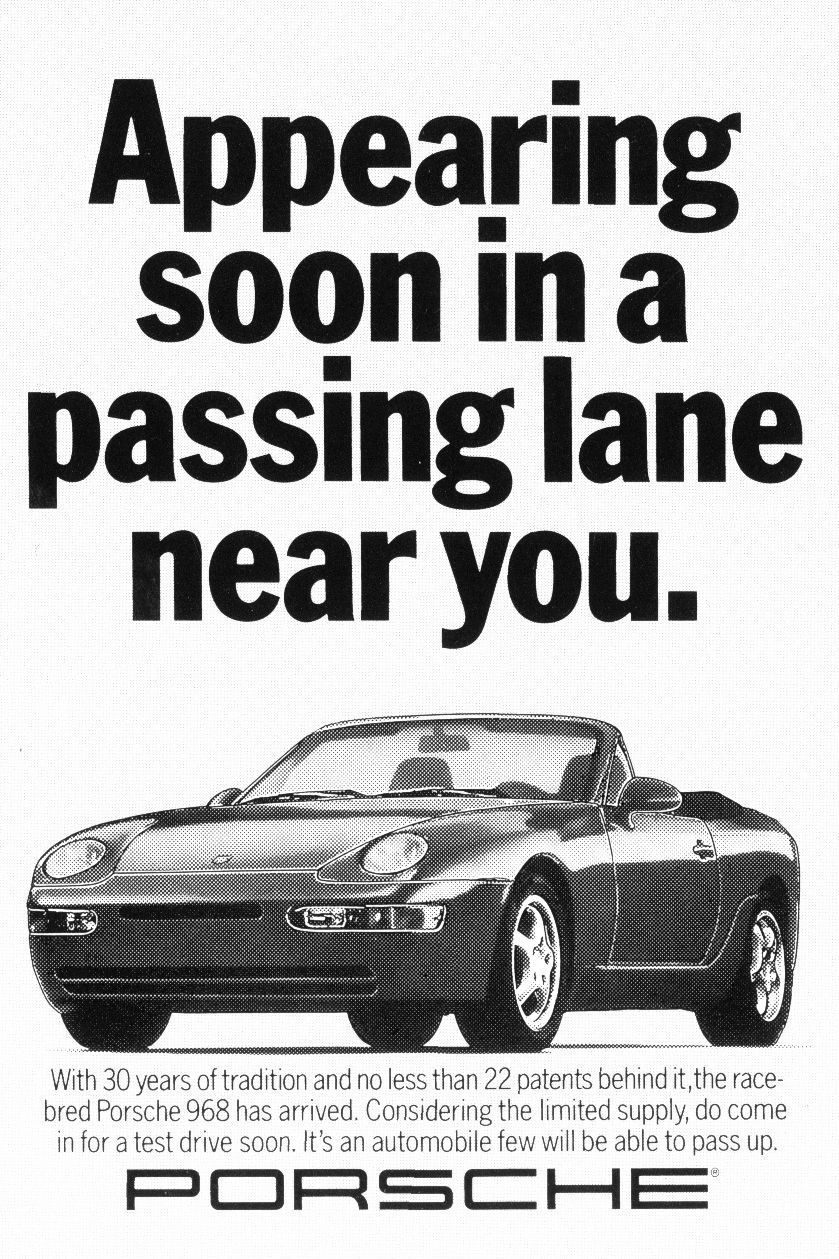
Porsche Ad That Passes Every Test
Porsche nailed this ad by mixing speed, wit, and subtle bragging rights into one perfect line: “Appearing soon in a...

🎤 The SWIPES Email (Friday, December 5th, 2025)
Friday, December 5th, 2025 SwipeFile: Inspiration for your marketing.CopywritingCourse: Get good at selling your stuff.Hey hey it's Neville here,...

What Podcasting’s Gender Split Teaches About Audience Fit
This chart from Chartr shows a wild stat: while men dominate most podcast genres, women actually lead in True Crime....

How Tudor Used the Power of Endorsement to Build Trust
This vintage ad for the Tudor Oyster Prince shows how a personal endorsement can elevate a new product. Rather than...
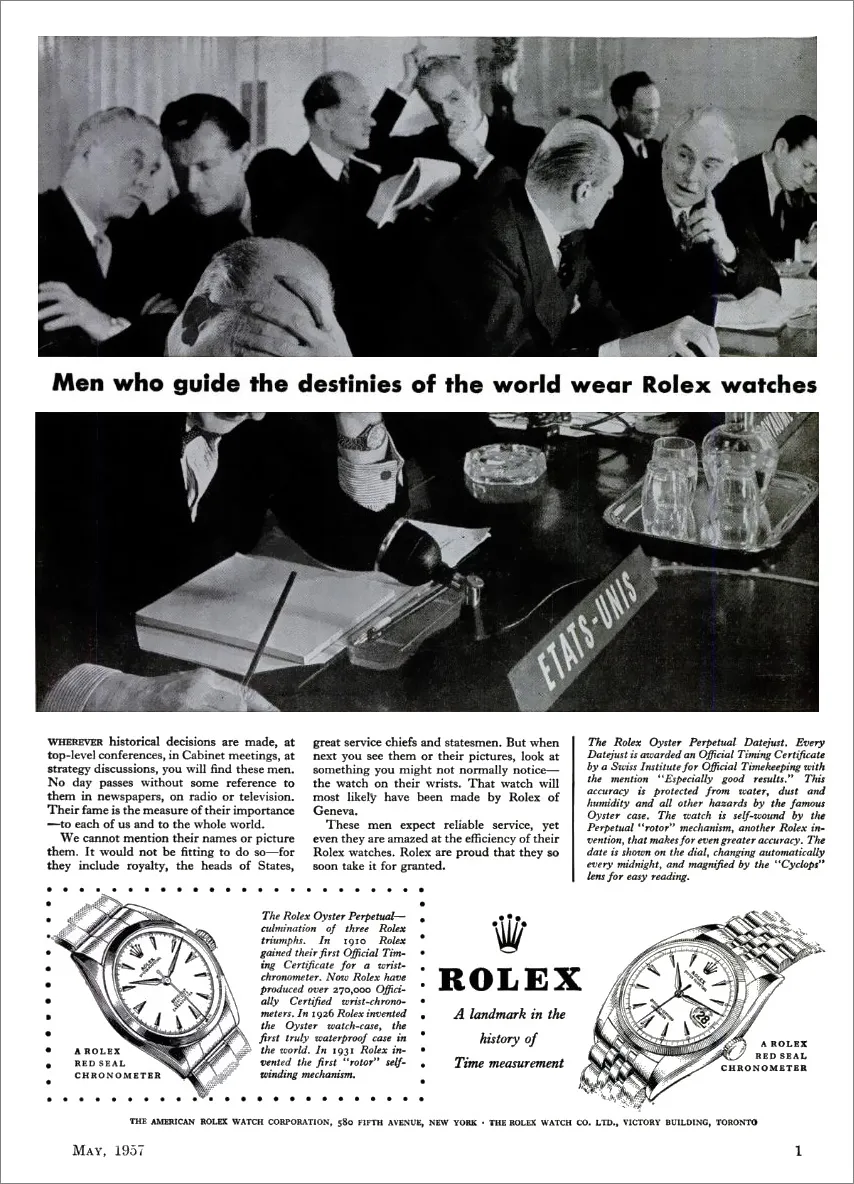
The Ad That Made Rolex Synonymous With Power
This 1957 Rolex ad doesn’t show celebrities or adventurers. It shows serious men in suits, deep in decisions that “guide...
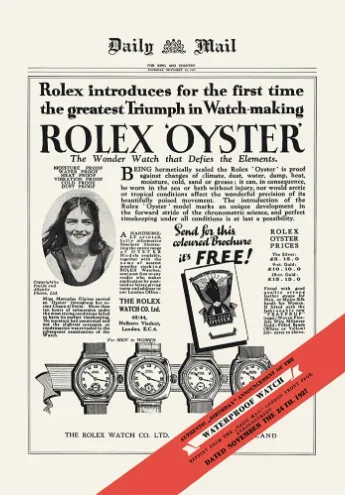
How Rolex Sold the First Waterproof Watch with a Newspaper Ad
This 1927 Rolex ad is a masterclass in turning a technical feature into a story worth talking about. It didn’t...

How Rolex Used Speed to Sell Reliability
In this 1930s ad, Rolex didn’t just say their watch was tough—they proved it. They put it on the wrist...
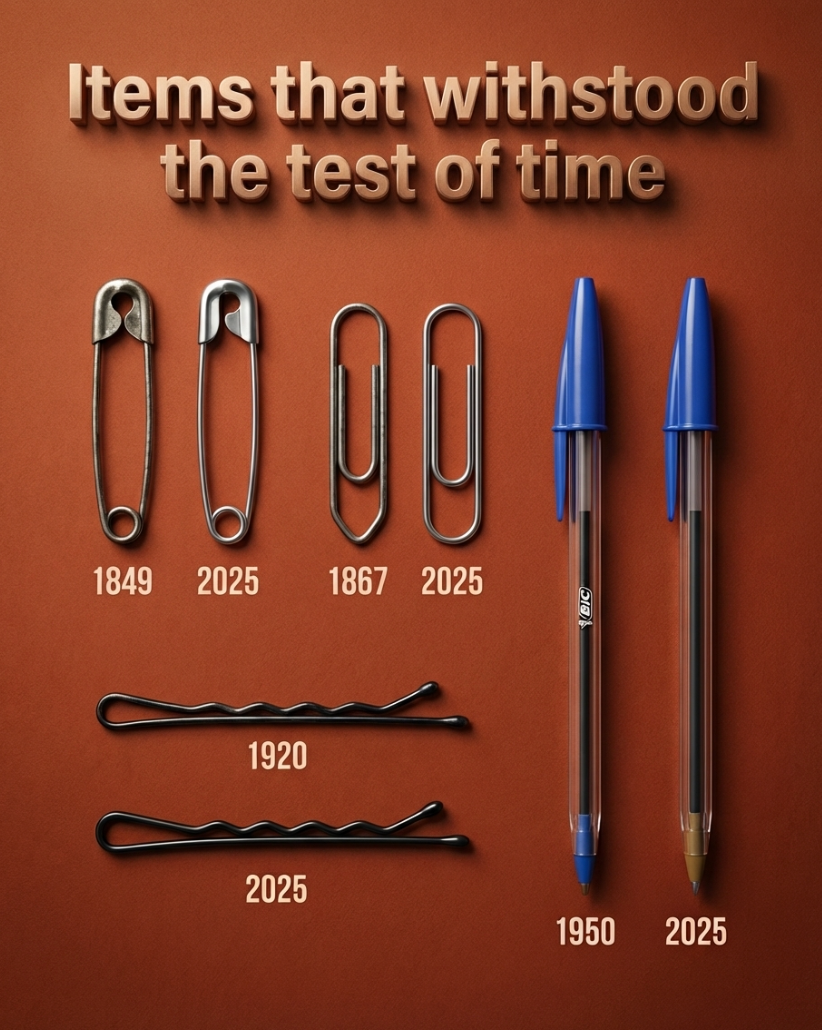
Timeless Design: What Marketers Can Learn from Everyday Classics
Look at that image. A safety pin, paper clip, bobby pin, and Bic pen — all basically unchanged for decades....
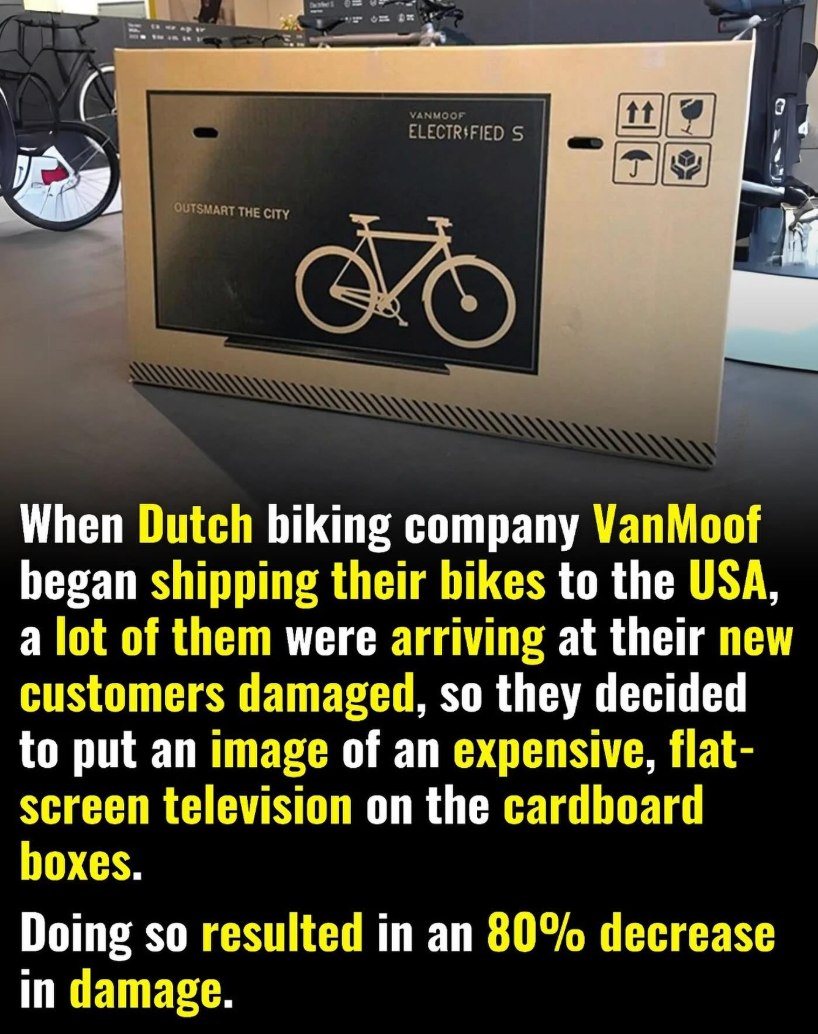
How VanMoof Outsmarted Shipping Damage with One Clever Image
Sometimes marketing isn’t about selling more—it’s about solving smarter. VanMoof, a Dutch bike company, noticed too many bikes arrived damaged...
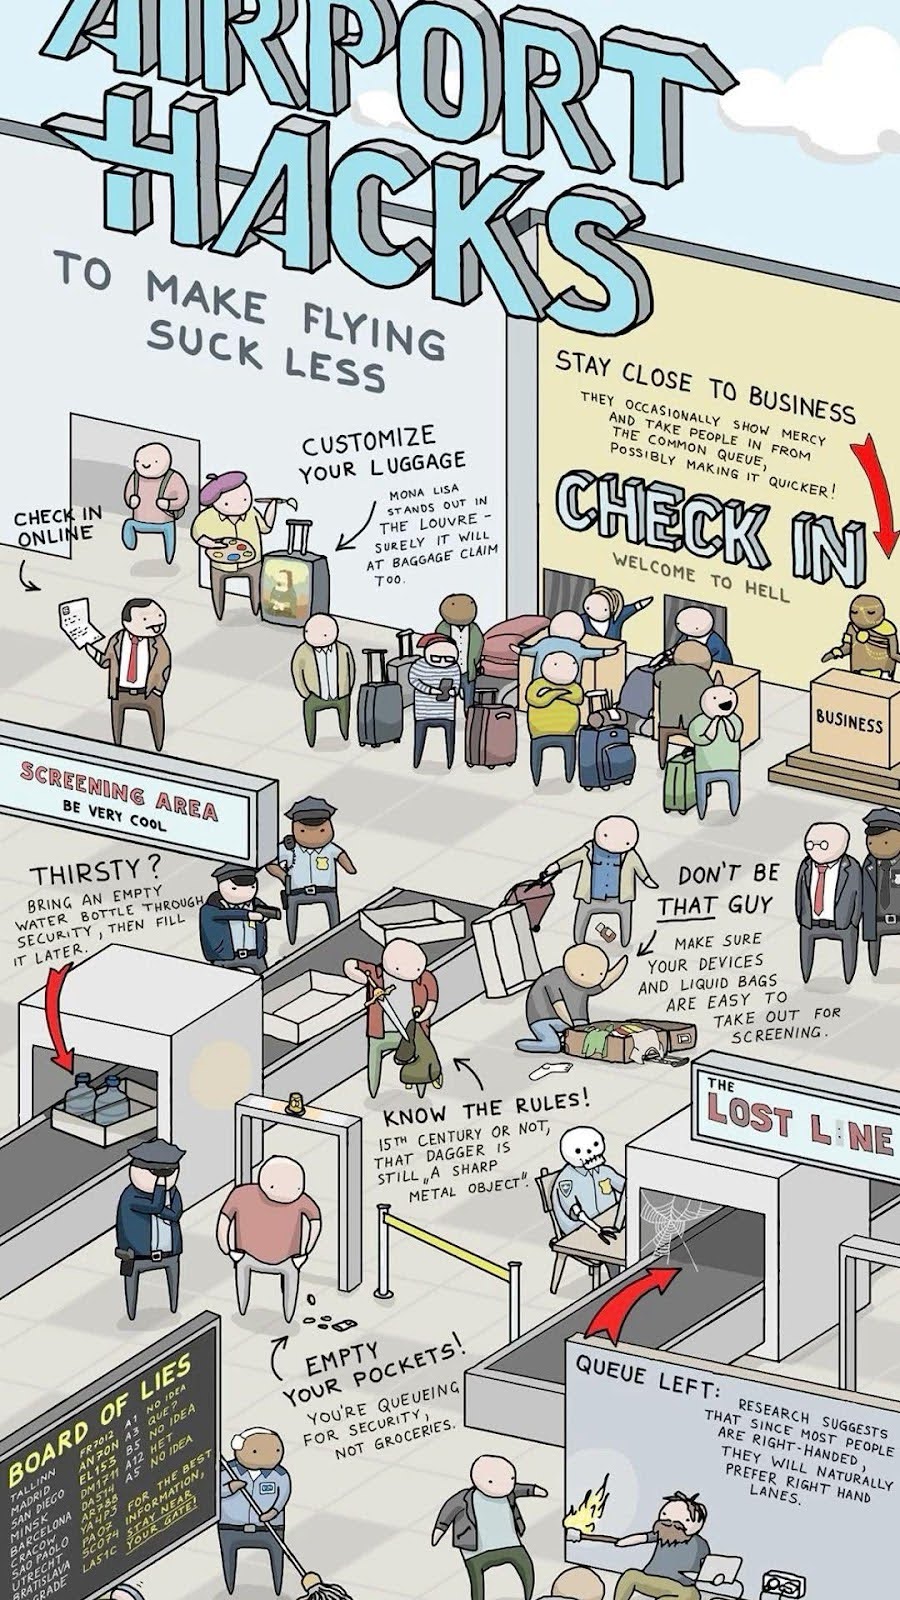
This Comic Does Airport Hacks Better Than Any Blog Post
This illustrated guide is genius. It turns boring travel advice into a fun, shareable visual that actually gets remembered. Each...
Proof luck doesn’t exist. https://t.co/jASU4BZD5B

The “No Luck” Chart Every Founder Needs to See
Marc Lou shared this chart claiming it’s “proof luck doesn’t exist.” It maps hundreds of startups by revenue vs. time...

The “Learn While You Fly” Marketing Lesson
Ever felt like you’re learning on the job? This image nails that feeling — a pilot reading “How To Fly”...