
Skinny Pop Packaging Redesign
SkinnyPop just flipped its look, and some fans lost it. The brand dropped its clean, “diet popcorn” vibe for a...

The Value Staircase Strategy
Ever try to sell a $2,000 product to someone who just met you? Tough. The Value Staircase shows you how...

New York Tax Breakdown
That pie chart looks impossible at first glance. The top 50% of New Yorkers paid almost all the state’s income...

Funny Goal Update
This crumpled list of half-crossed goals is hilarious and painfully real. It nails one truth every marketer should remember: perfection...

How to Solve a Rubix's Cube Cheat Sheet
This Rubik’s Cube cheat sheet isn’t just about solving puzzles. It’s a masterclass in simplifying complexity. Every step, color, and...
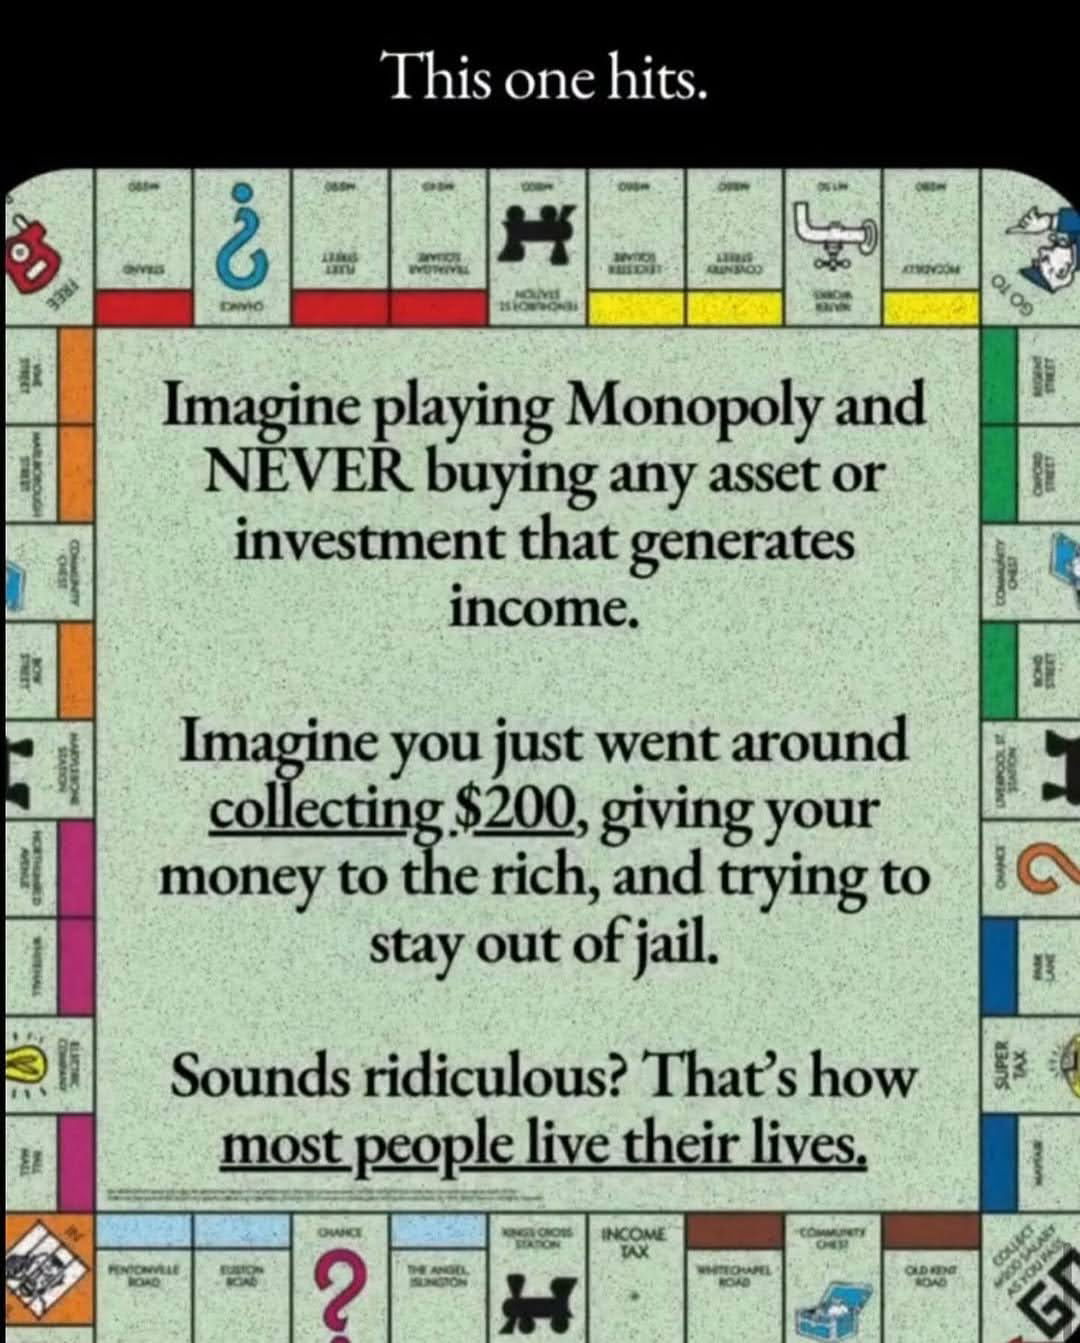
Life Lesson from Monopoly
This Monopoly meme hits hard because it turns a childhood game into a life lesson: collect money or build assets...

Difference between poor, middle class and rich flow cart.
This image nails the concept of money flow in under three seconds. It shows exactly how the poor, middle class,...
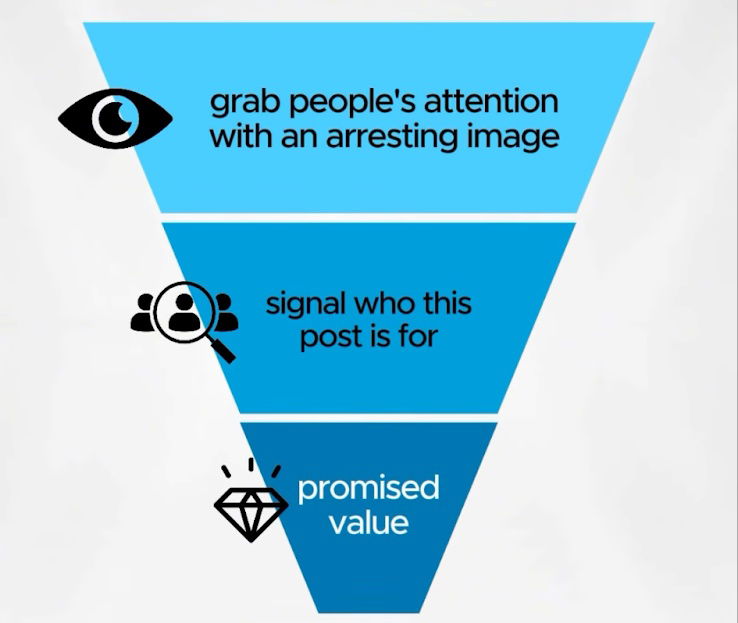
LinkedIn Attention Funnel
Most LinkedIn posts flop because they start with “Happy Monday!” instead of grabbing attention fast. This simple visual nails a...
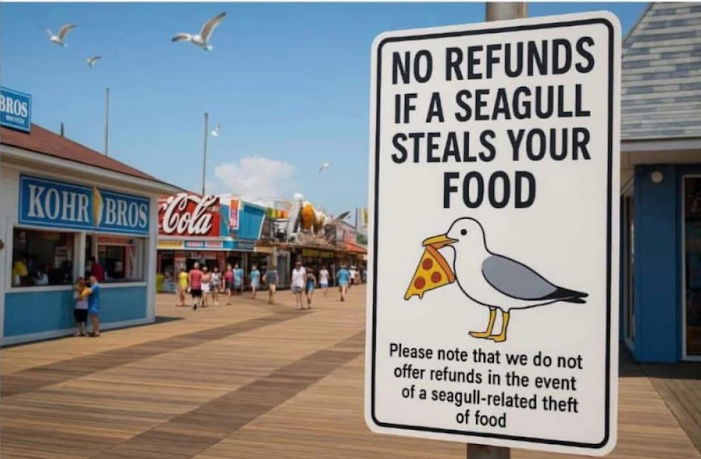
Funny Seagull Theft Policy – No Refunds
This beach boardwalk nailed it with a sign that warns: no refunds if a seagull steals your food. The visual...
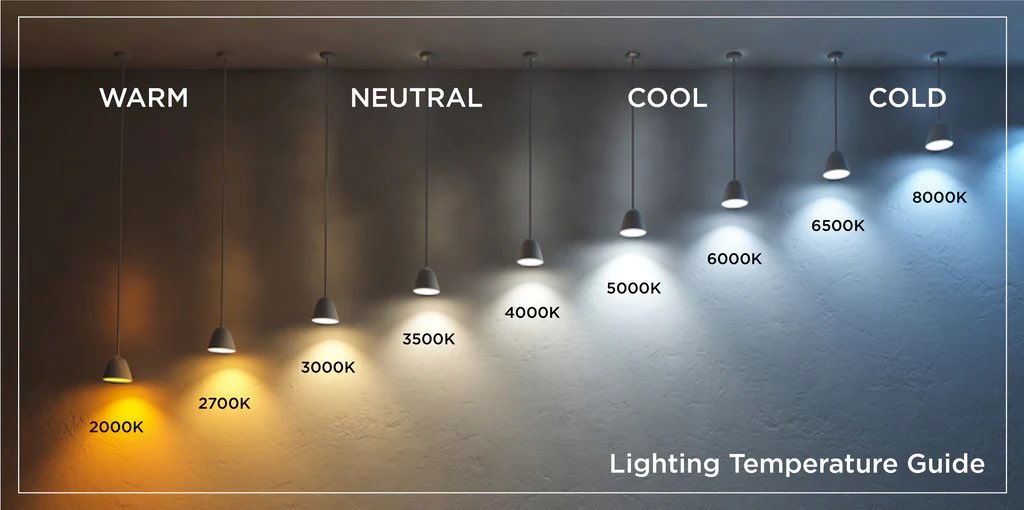
Light bulb temperature lighting guide.
A light bulb isn’t just a light bulb. This visual guide shows how lighting temperature completely changes how something looks...
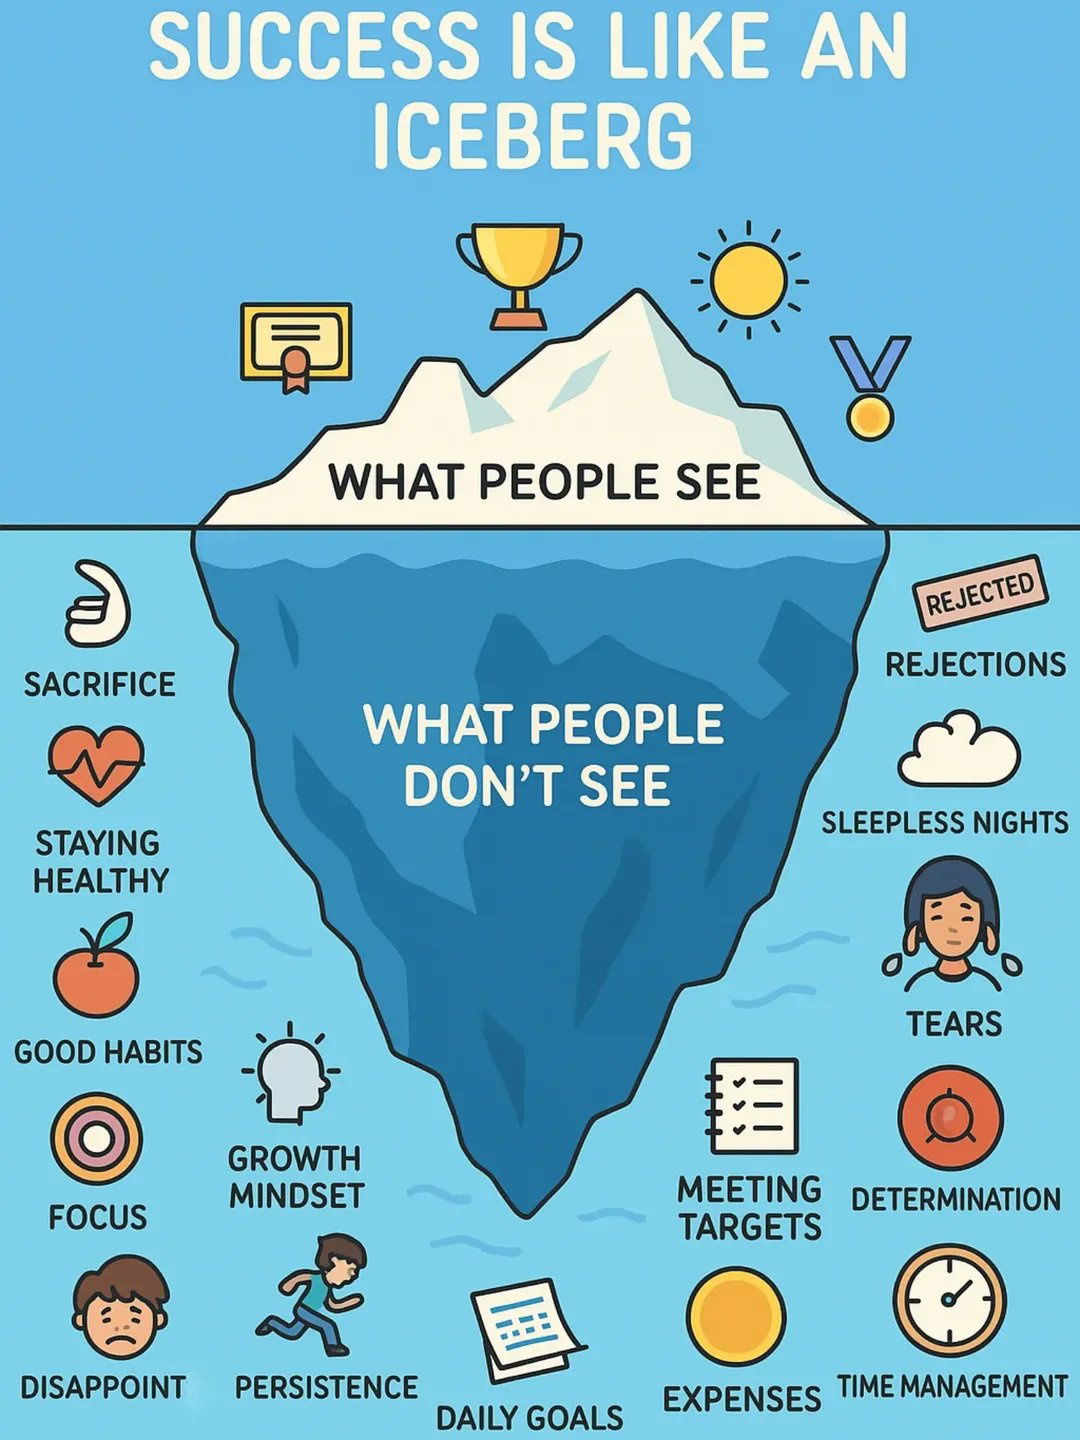
Success is like an iceberg.
Everyone loves the shiny trophy moment of a big campaign win. But behind every viral ad or record-breaking funnel is...
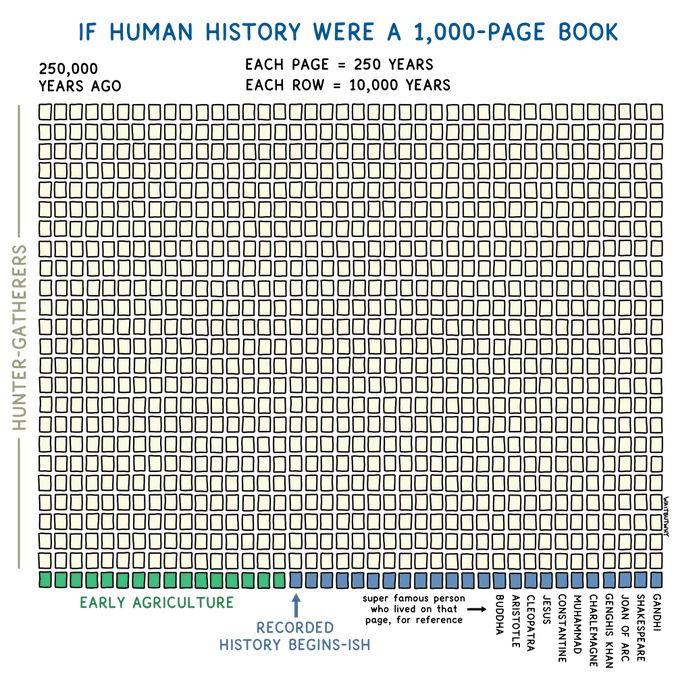
Human History Chart
Ever feel like marketing isn’t moving fast enough? This chart from Wait But Why crushes that illusion. It shows human...

The Greatest Dumpster Company Ad
This ad from Bin There Dump That takes a boring category (dumpsters!) and makes it pop. A bright green backdrop,...
Are you a triple threat?
In sports and entertainment, a “triple threat” means someone who can do three things really well. In marketing, that could...
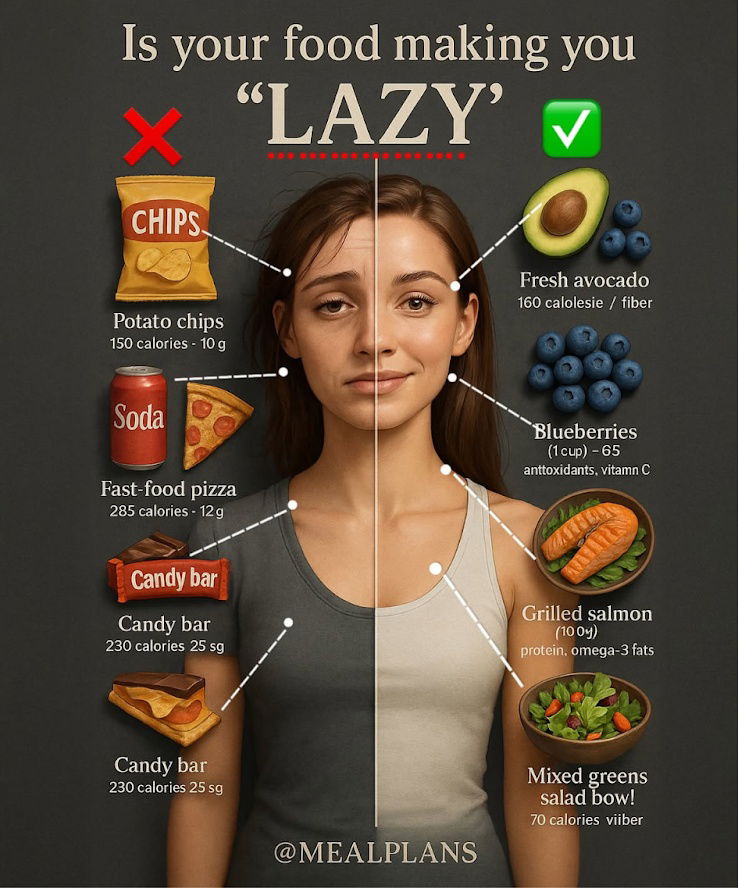
Is your food making you "LAZY" Infographic
This image stops your scroll instantly. It’s split-screen perfection: lazy foods on one side, energetic foods on the other. You...
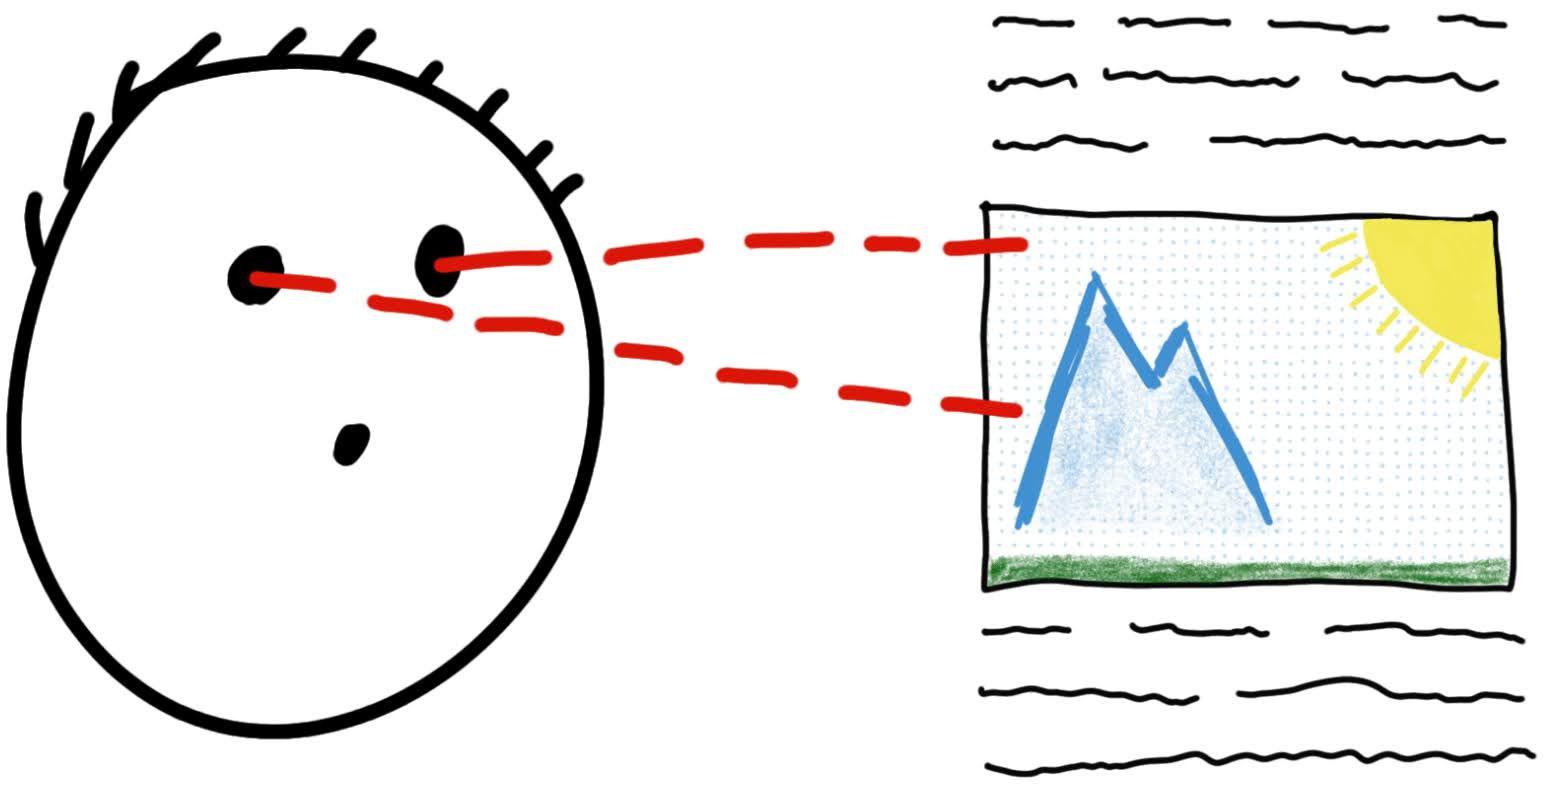
Use Images
Ever open an email and instantly skip the text to look at the picture? That’s not you being lazy. That’s...
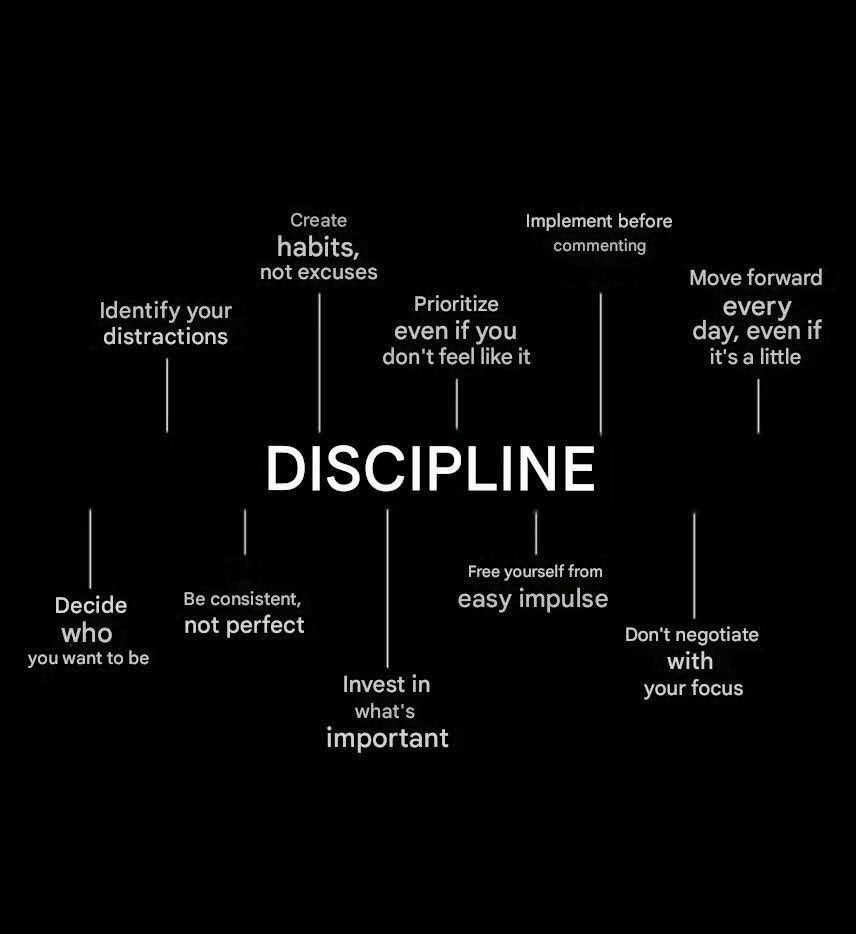
How Discipline Really Works
Most marketers wait for motivation to strike. But the pros? They rely on discipline—a system of tiny daily habits that...
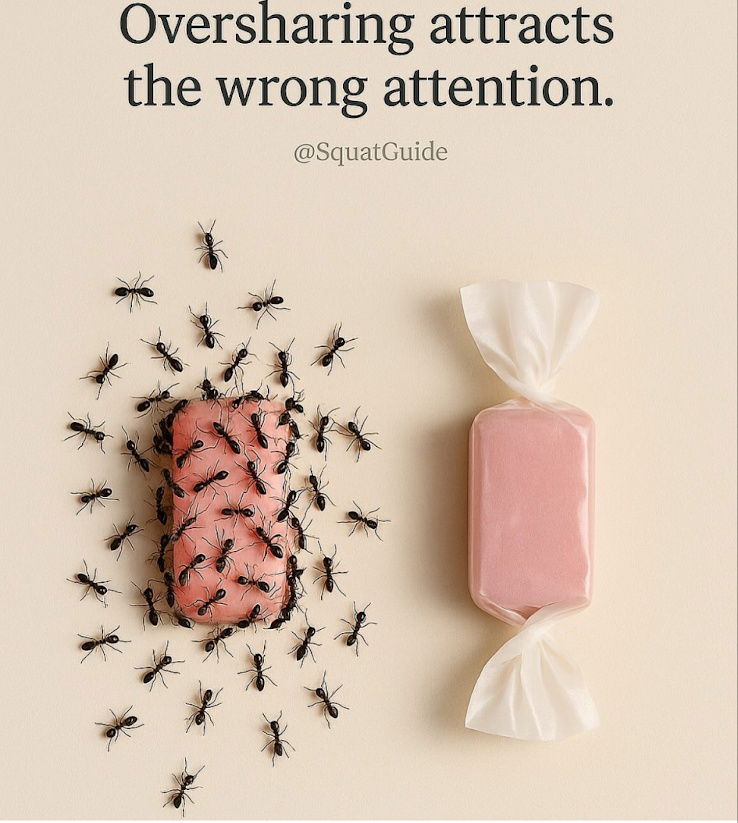
Oversharing attracts the wrong attention
This image nails the concept of “too much information.” One candy sits exposed and swarmed by ants, while the other...

Ritual Zero Proof Spiritz Your Way Ad
This ad nails the “zero-proof without zero fun” vibe. Bold yellow background, bold message: Your Spritz, Your Way. It’s not...
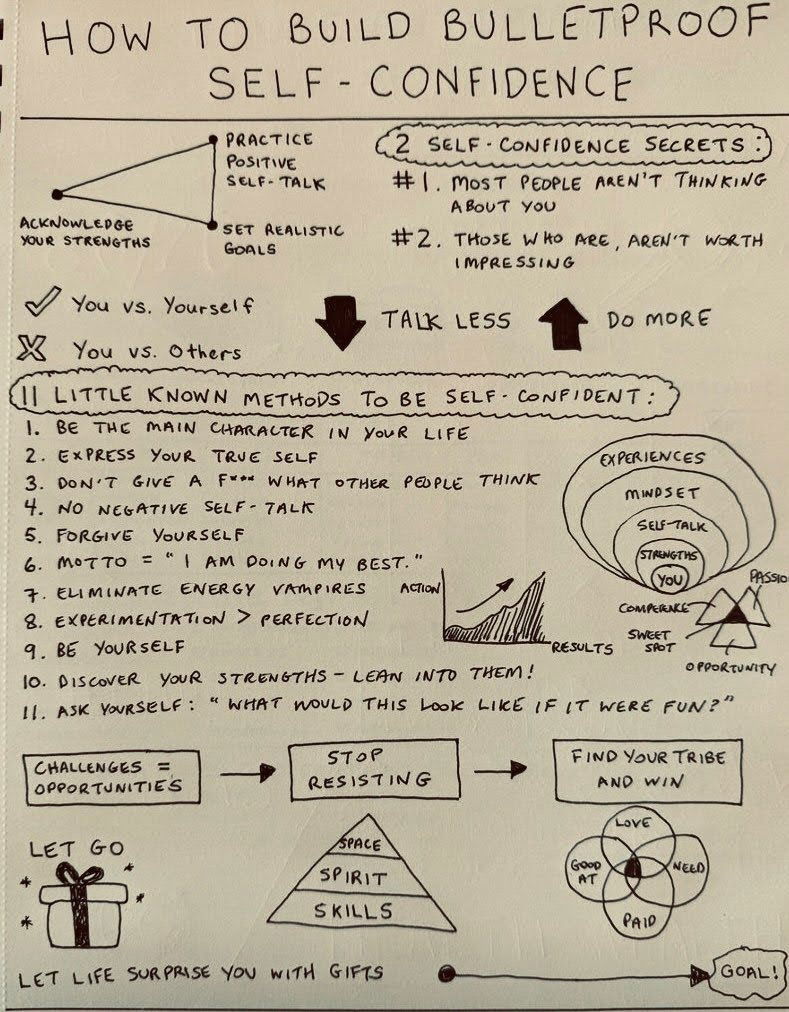
How to Build Build BulletProof Self-Confidence
Sometimes the best marketing isn’t polished — it’s sketched on a napkin. Matt Gray’s hand-drawn guide to “Building Bulletproof Self-Confidence”...
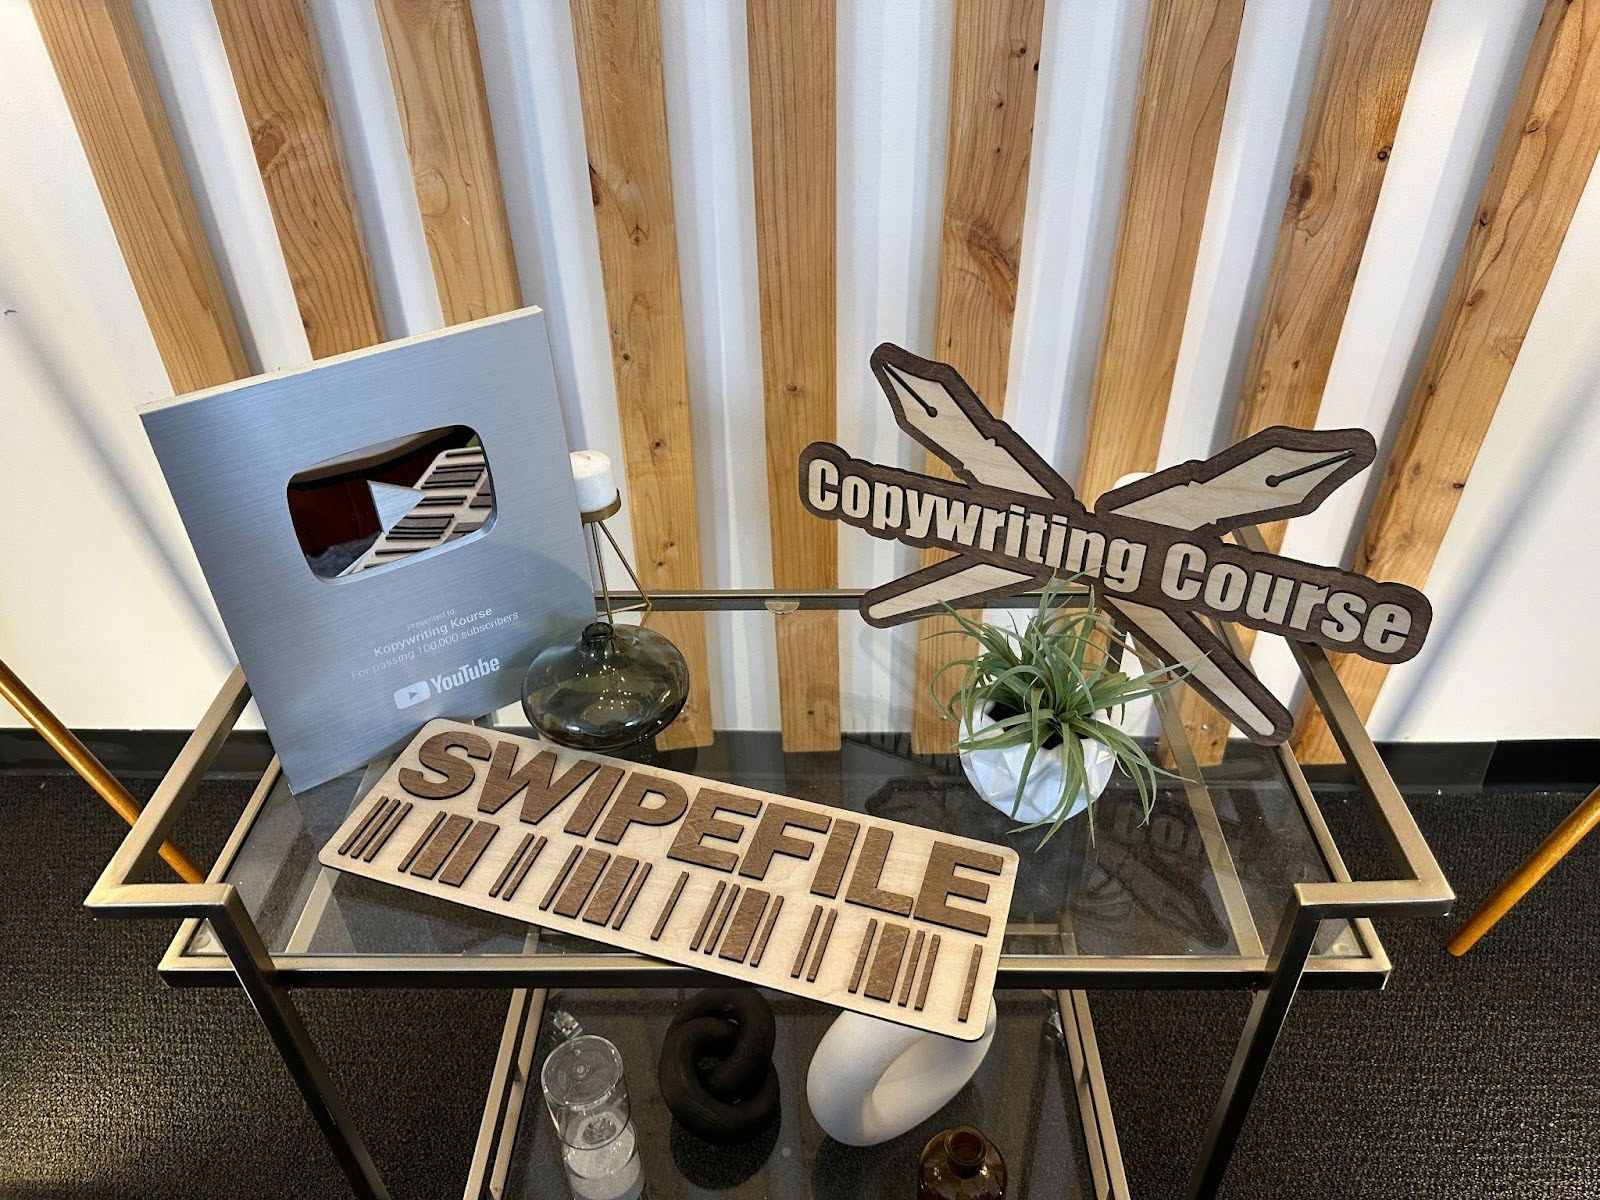
Swipe file printed logo
A logo isn’t just something you slap on your website. It’s a brand symbol that can live in the real...
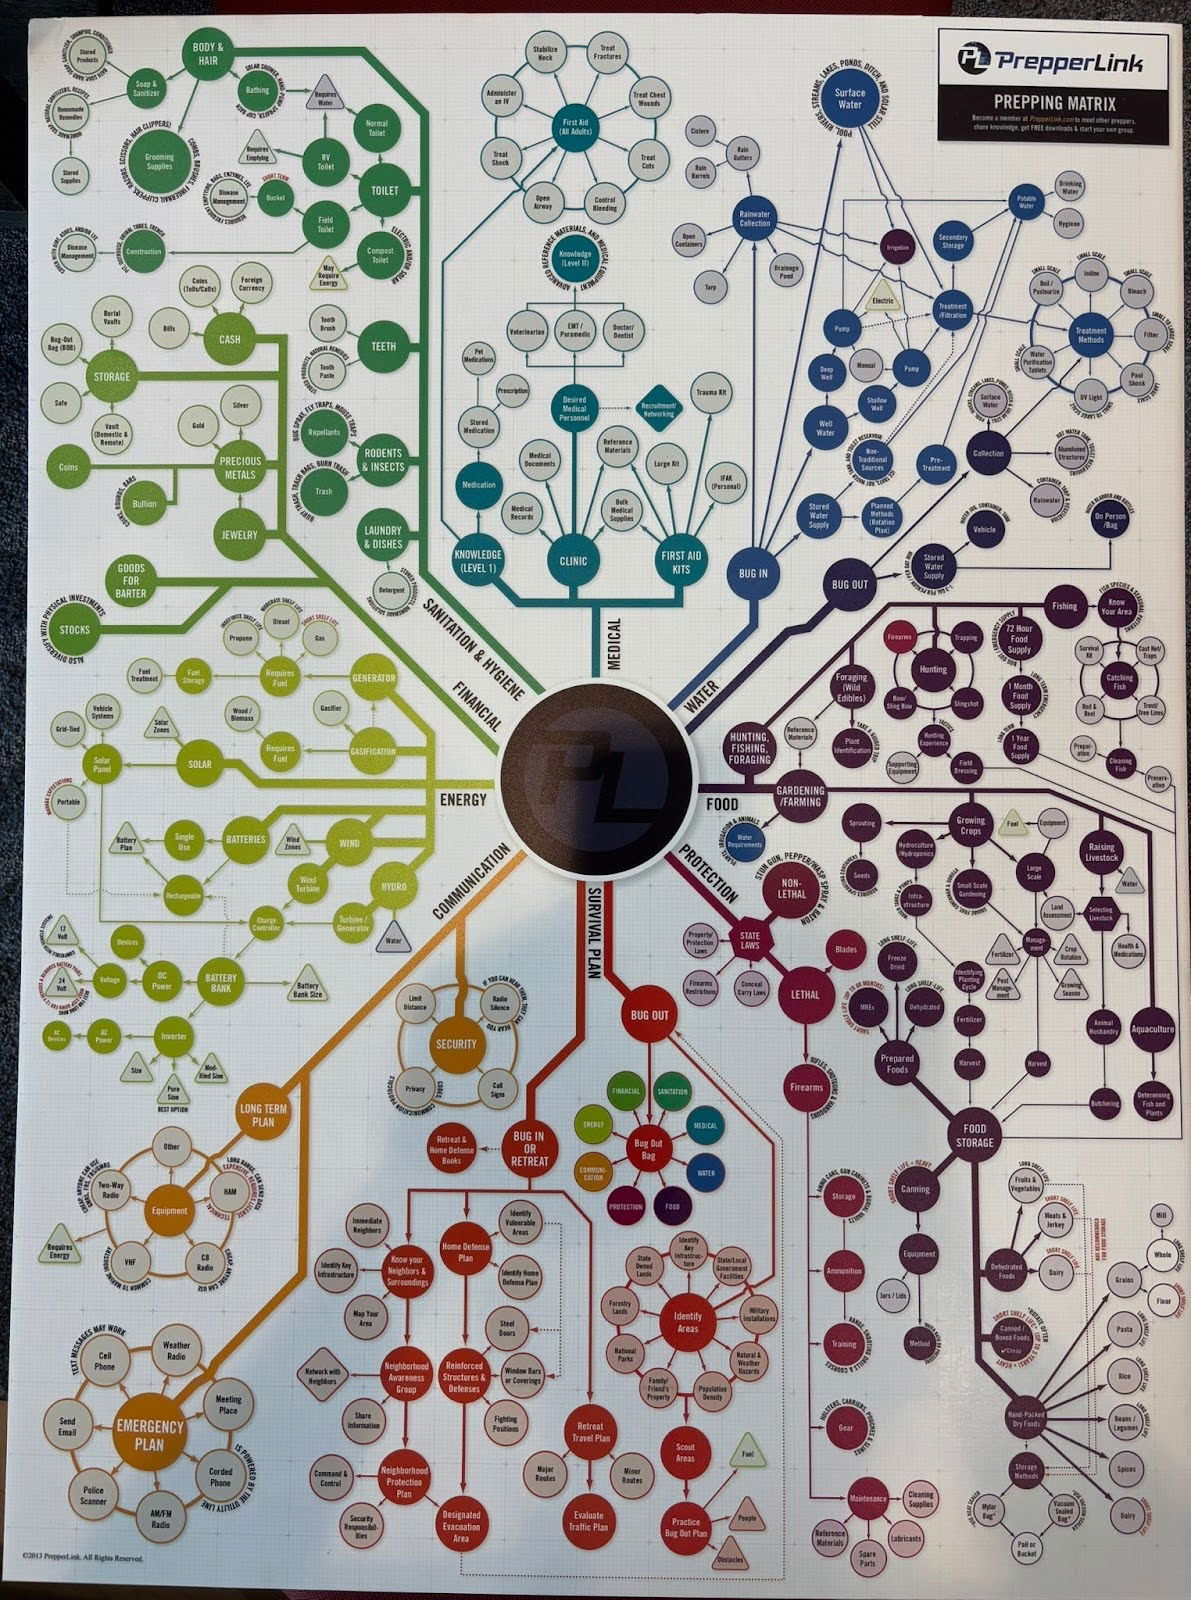
Prepper graph
This “Prepping Matrix” looks like something out of a survivalist’s dream. But it’s also a killer metaphor for marketing planning....

Earning $228 million in the creator economy
Nathan Barry’s simple graph says it all: the right people paying attention change everything. Most creators chase crowds. Nathan figured...
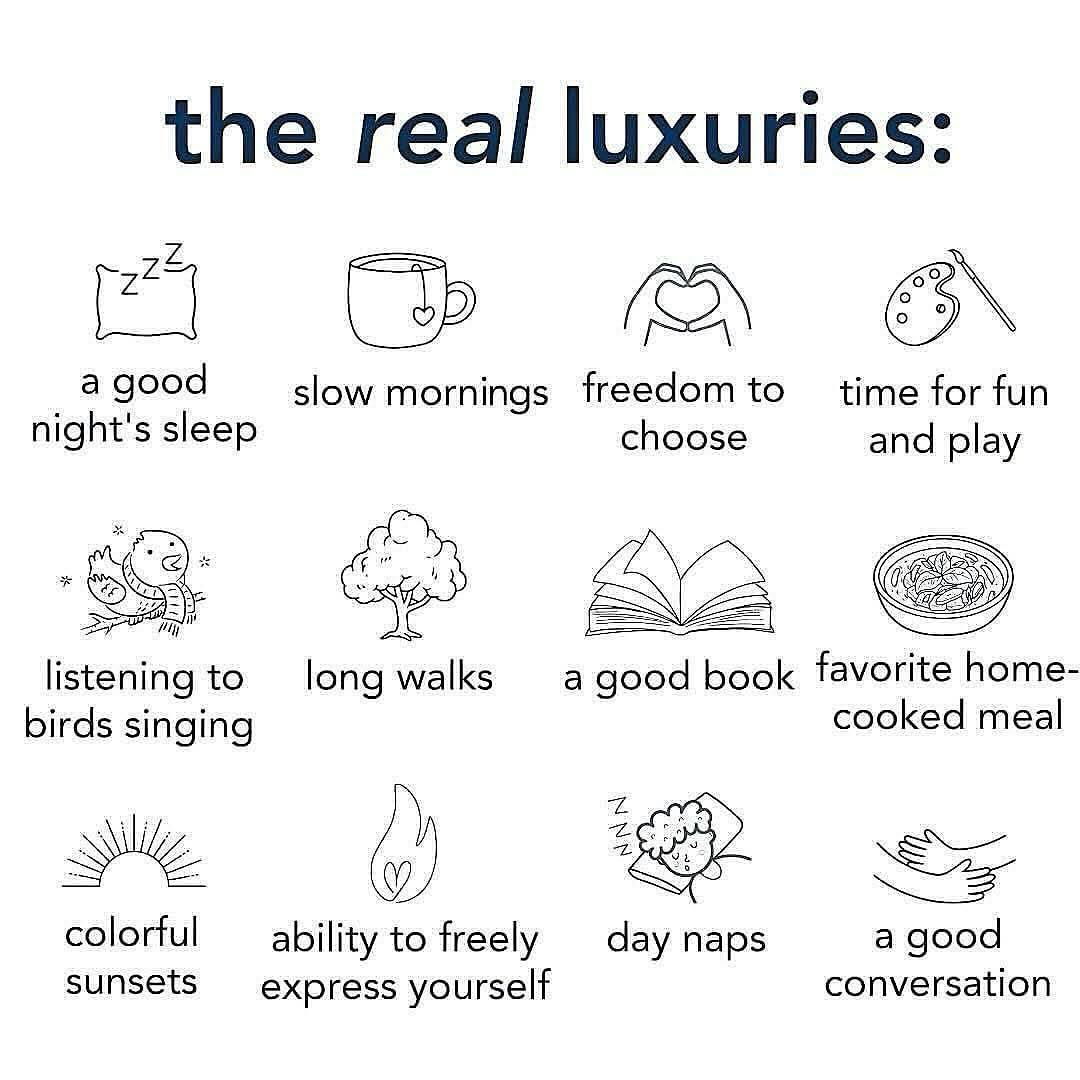
The real luxuries in life.
This image nails something clever: it sells a feeling, not a product. By listing small pleasures like naps, sunsets, and...