1,913 Images and Illustration Examples That Teach Things
Drawings and illustrations and photography can transmit more information from human-to-human than text can. This board is perfect for designers and marketers seeking visual inspiration.

Furniture store using cars to compare brands
Most people can name a car brand's luxury level instantly. But furniture? Not so much. This store nailed it by...

Fun parking sign
Most “No Parking” signs blend into the background. But this one? It flips a boring warning into a mini ad...
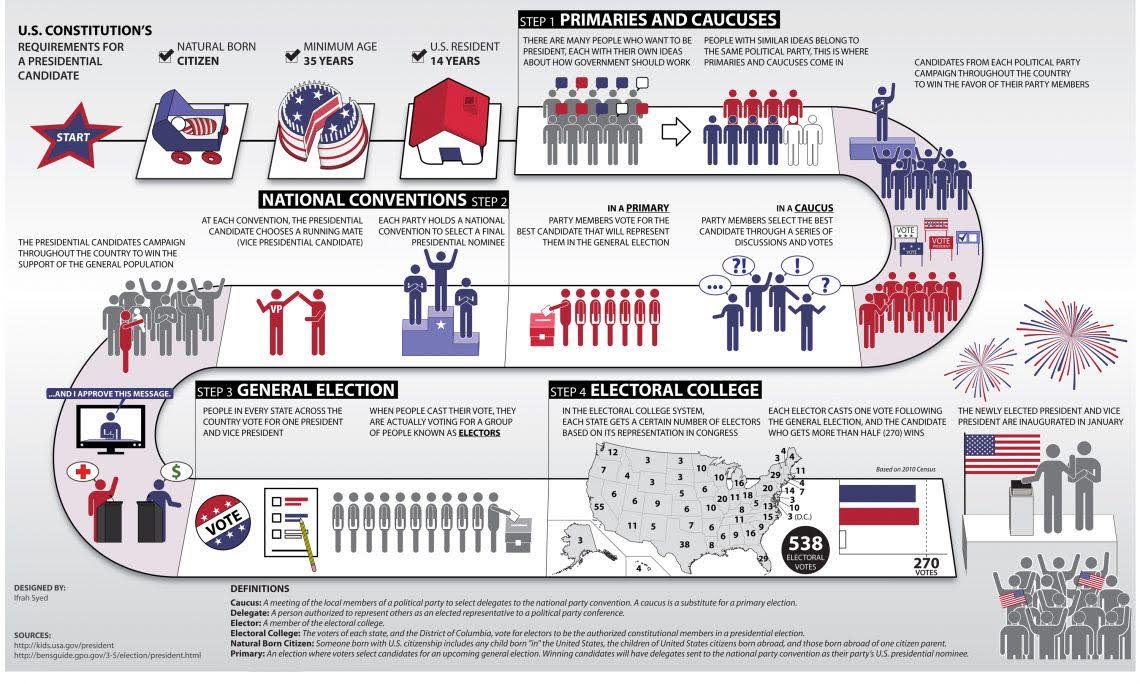
US Election Graphic
Ever wondered what running for President has in common with marketing? This chart of the U.S. election process shows it...

Traffic waves animation
One driver taps the brakes, and boom—traffic backs up for miles. That’s exactly how one small action can ripple across...
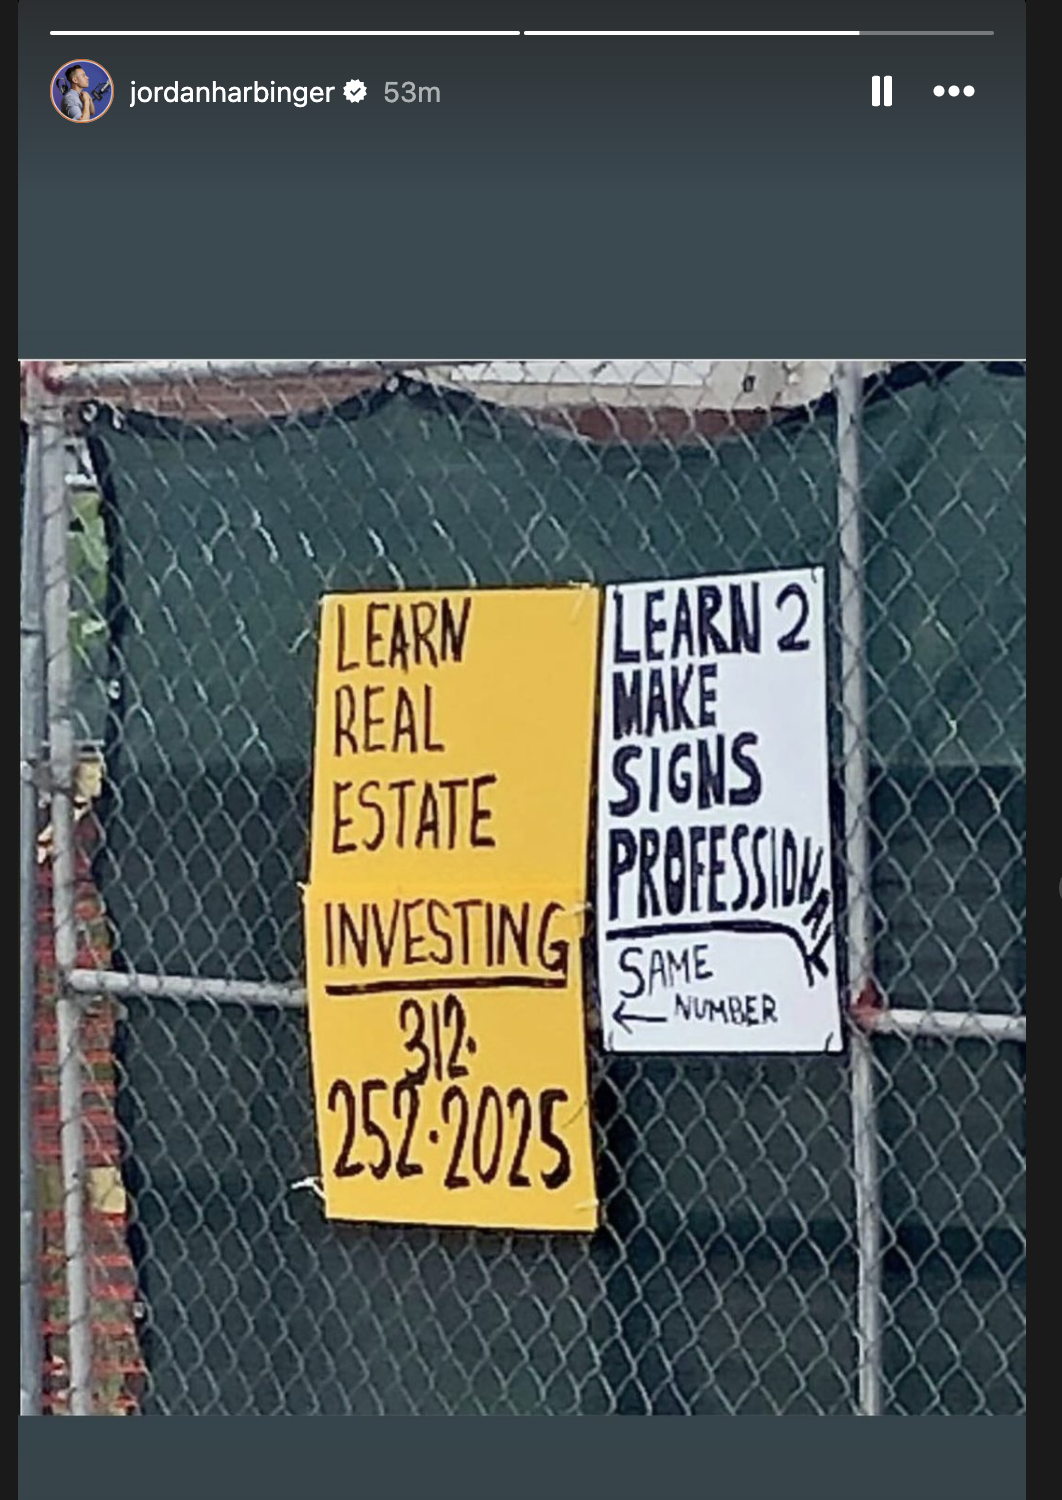
Funny sign making fun of a sign
Sometimes the best marketing isn’t fancy—it’s funny. This pair of signs nails it. The yellow sign reads like a classic...
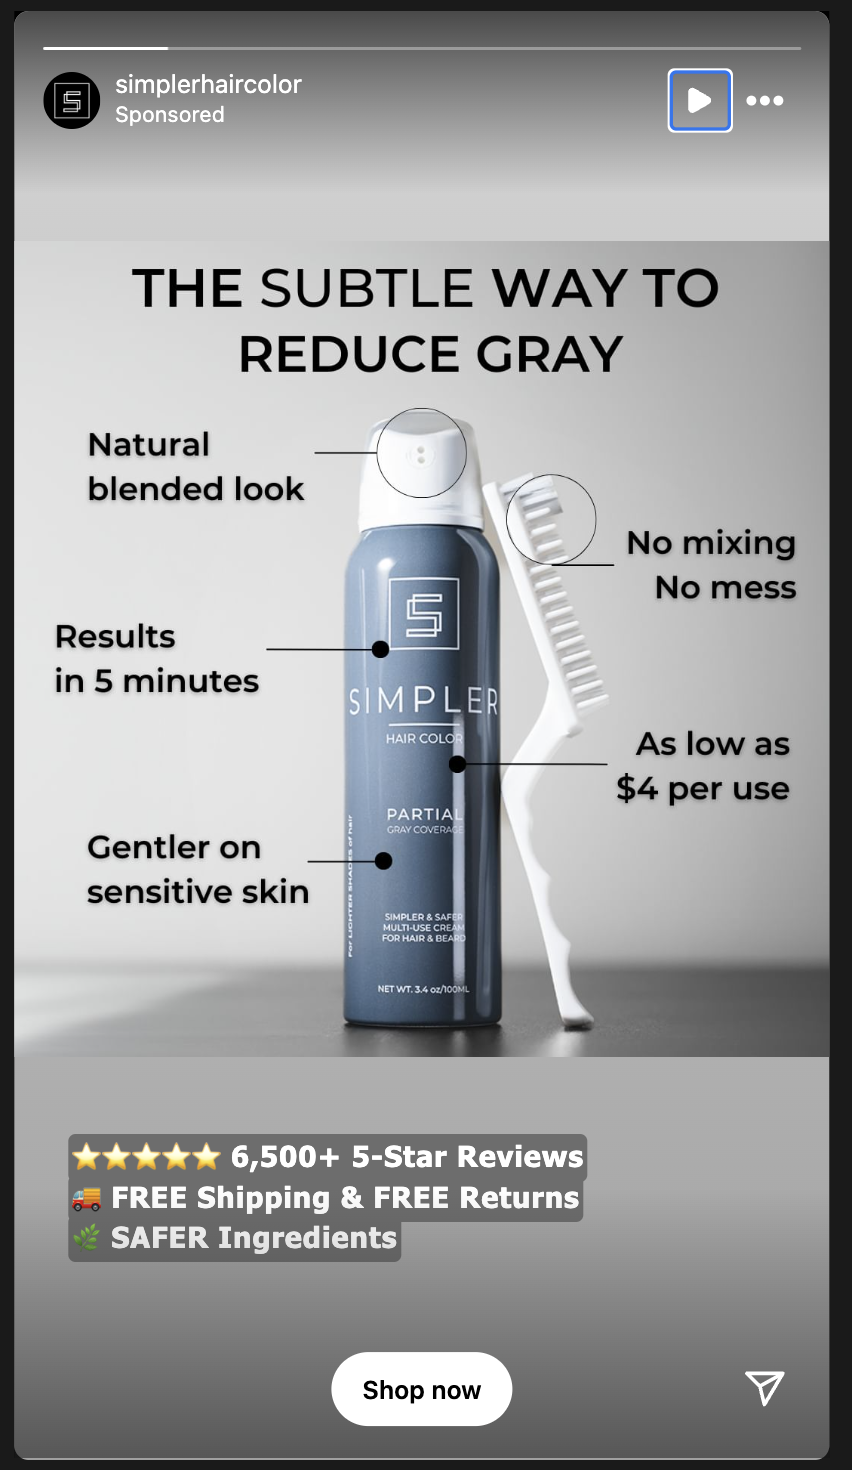
Simpler Hair Color Markup Ad
This ad nails clarity in seconds. Instead of fancy models or lifestyle shots, it uses a single, marked-up image that...
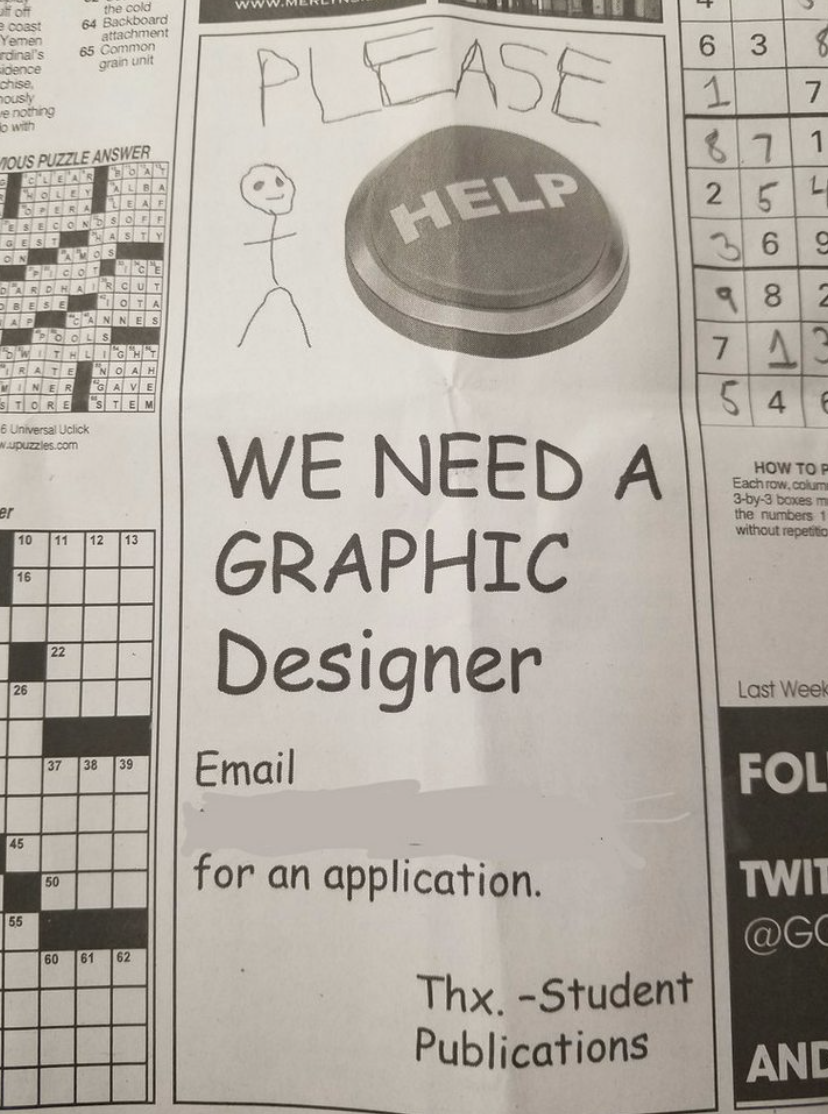
Funny “we need a graphic designer” crappy ad
This ad looks like it was made in Microsoft Paint by someone’s grandpa. And that’s why it works. The terrible...
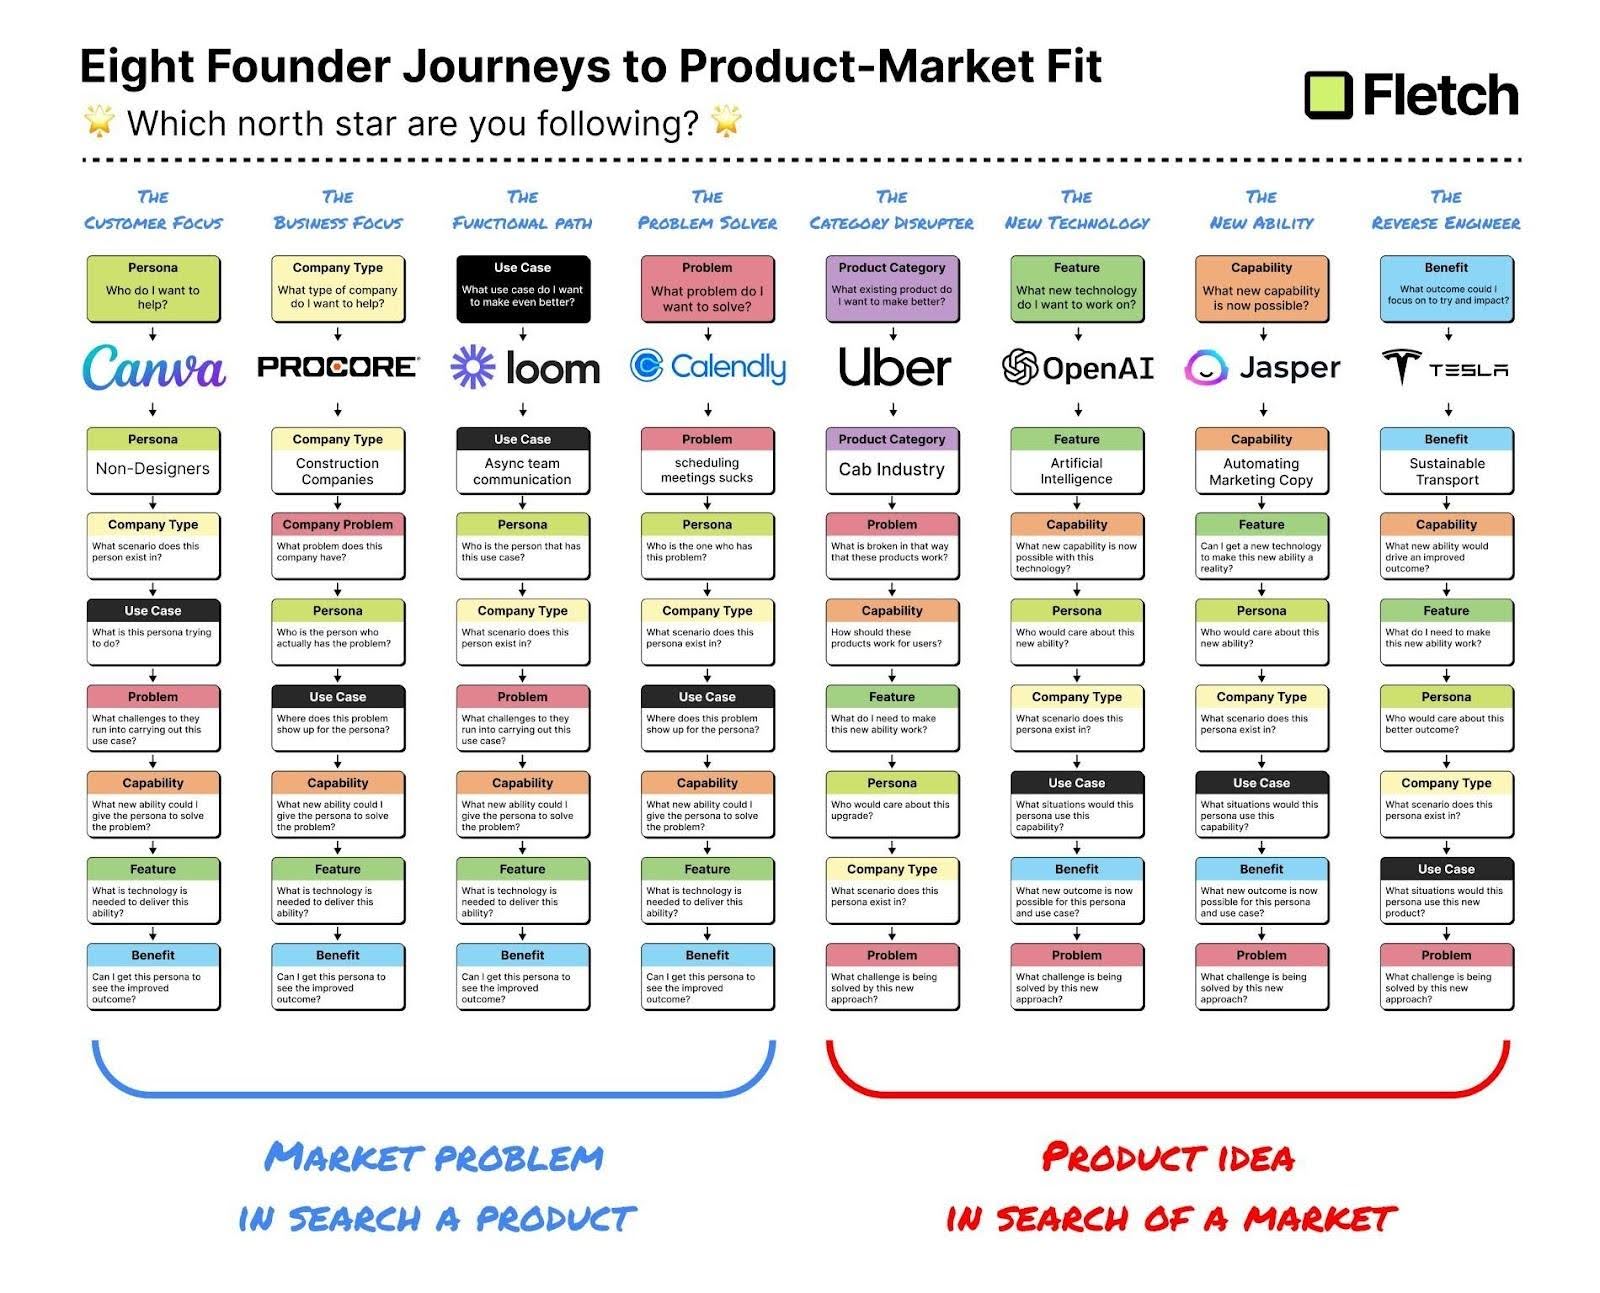
Product Market Fit Framework Exercise
Ever wonder why some startups explode while others fizzle? This chart from Fletch breaks down eight different founder journeys to...
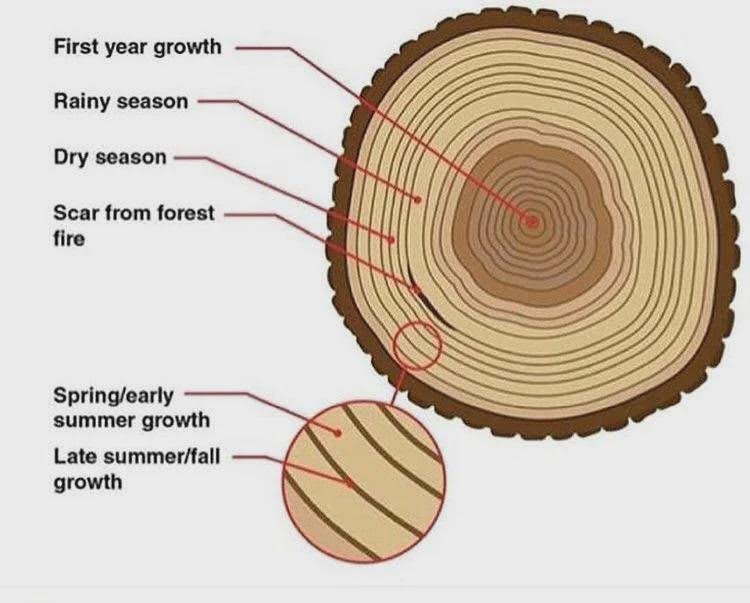
Cool guide to figuring out how old a tree is.
This image of a tree cross-section packs a biology lesson into a single glance. No clutter. No long explanation. Just...

Get people to “Sit Up In Their Chair” for attention
Most people skim. You’ve got seconds to turn a lazy lean into full attention. The image nails it: your message...

Read Write Own
Chris Dixon nails it with this visual breakdown: the internet has evolved from reading to writing to owning. In the...
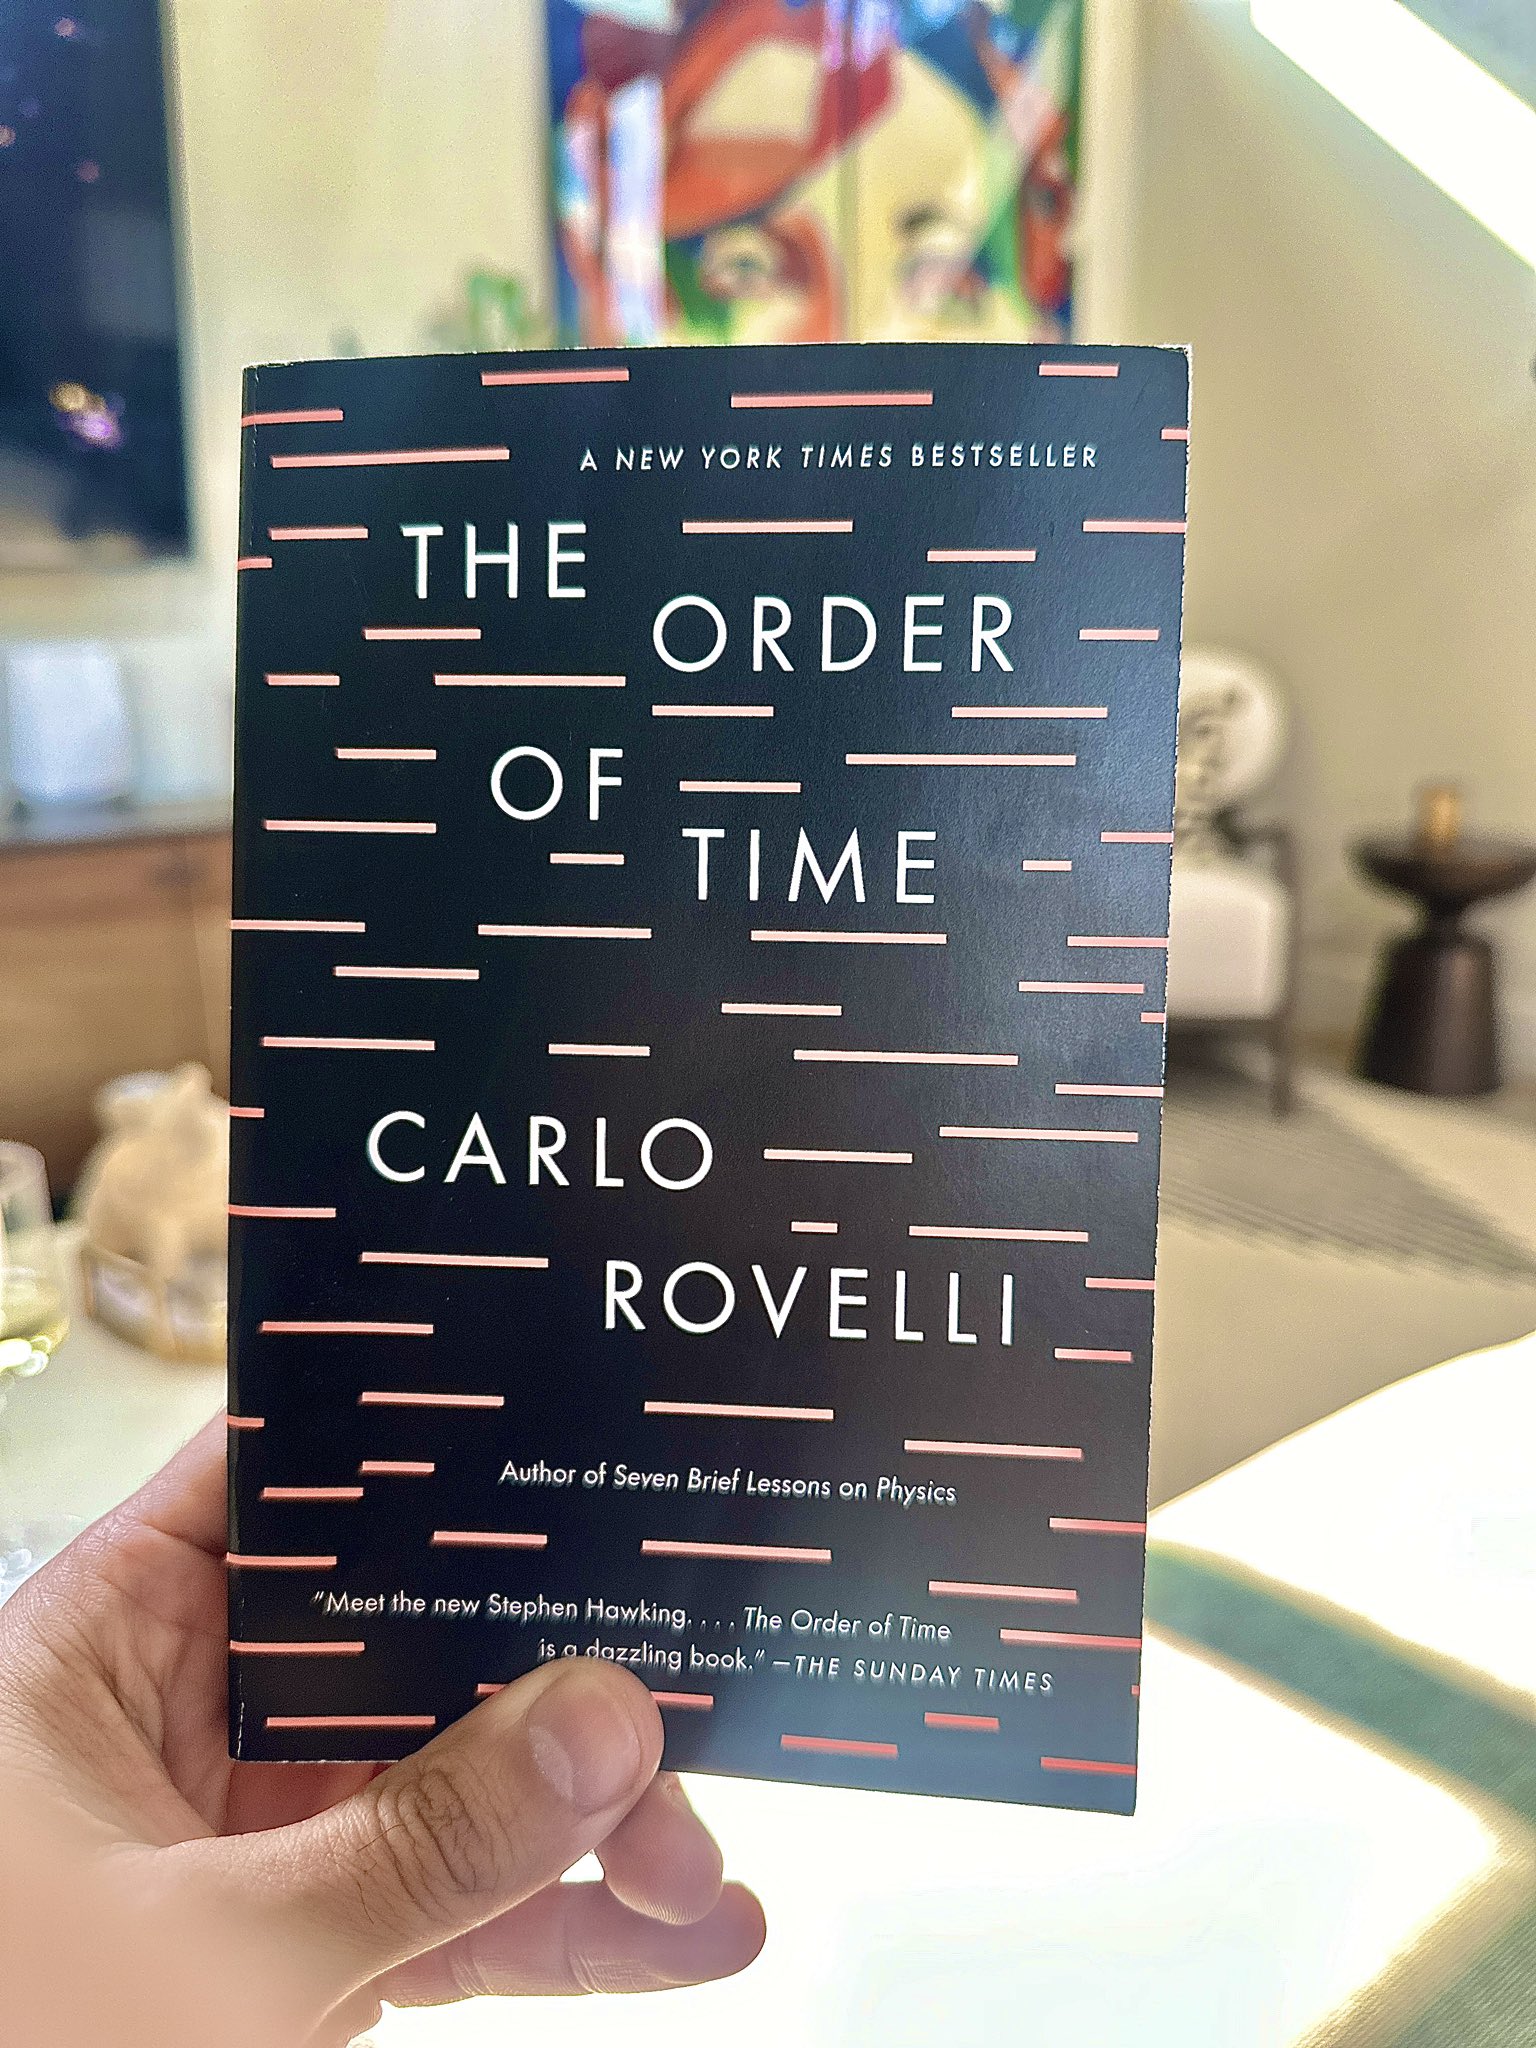
The Order of Time
This book cover does more with less. Just black background, thin lines, clean typography—and yet it instantly feels premium, smart,...
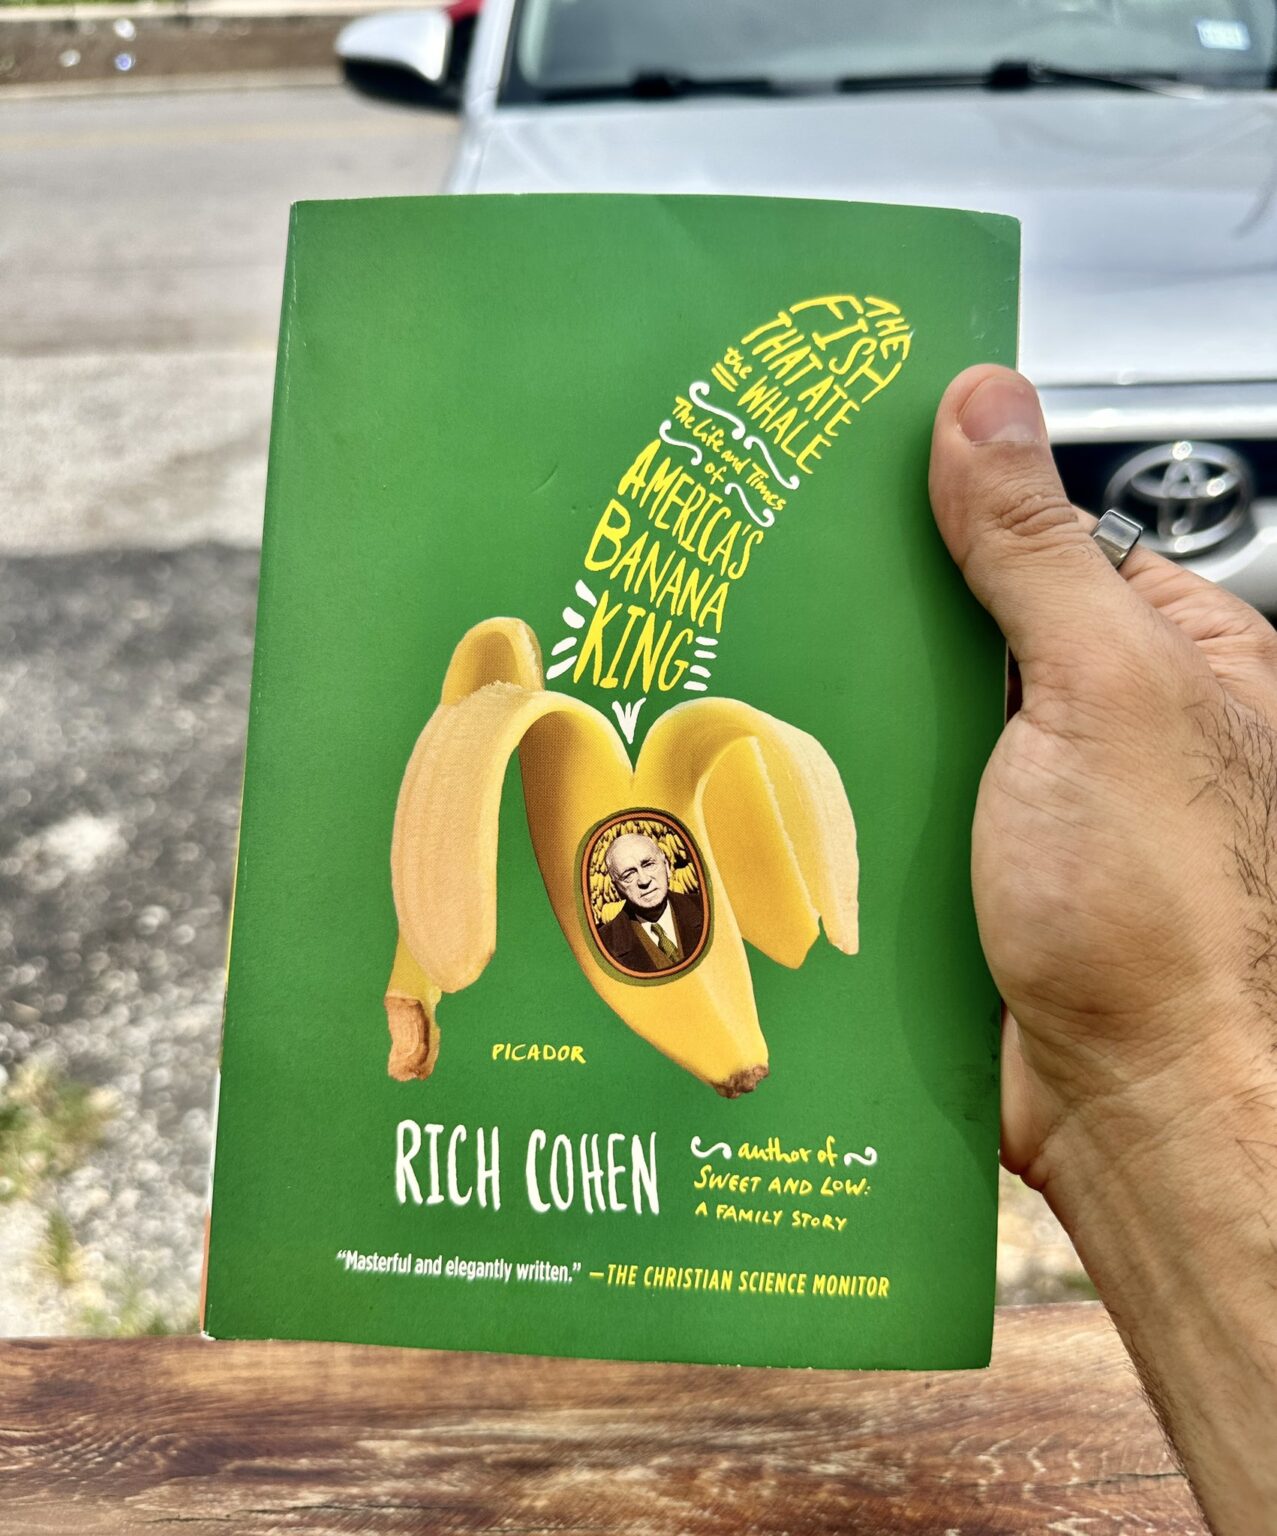
The Fish That Ate the Whale: The Life and Times of America's Banana King
A Russian immigrant sees Americans tossing out bananas with brown spots. He realizes they’re still good to eat. That tiny...

Pushing Ice
This photo nails something every marketer should remember: people don’t just buy things, they buy experiences. Marketing Analysis The image...

Stories Of Your Life And Others
This photo nails one thing perfectly: how design and storytelling can sell before you even open the book. Marketing Analysis...
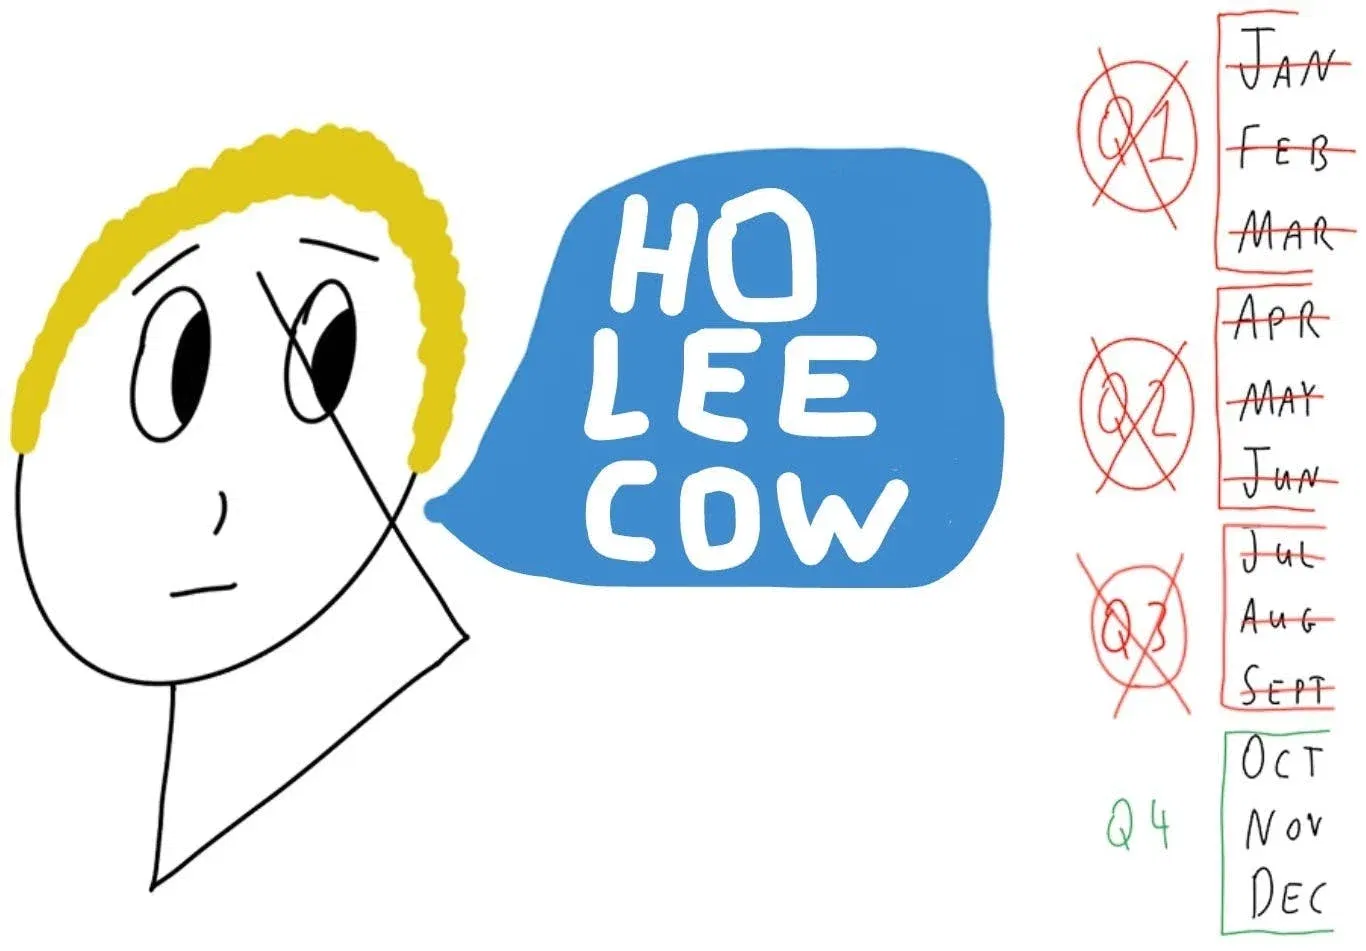
End of the year Q4 is the biggest time for promotions
October through December is marketing’s Super Bowl season. The image nails it—most of the year feels chill, but once Q4...
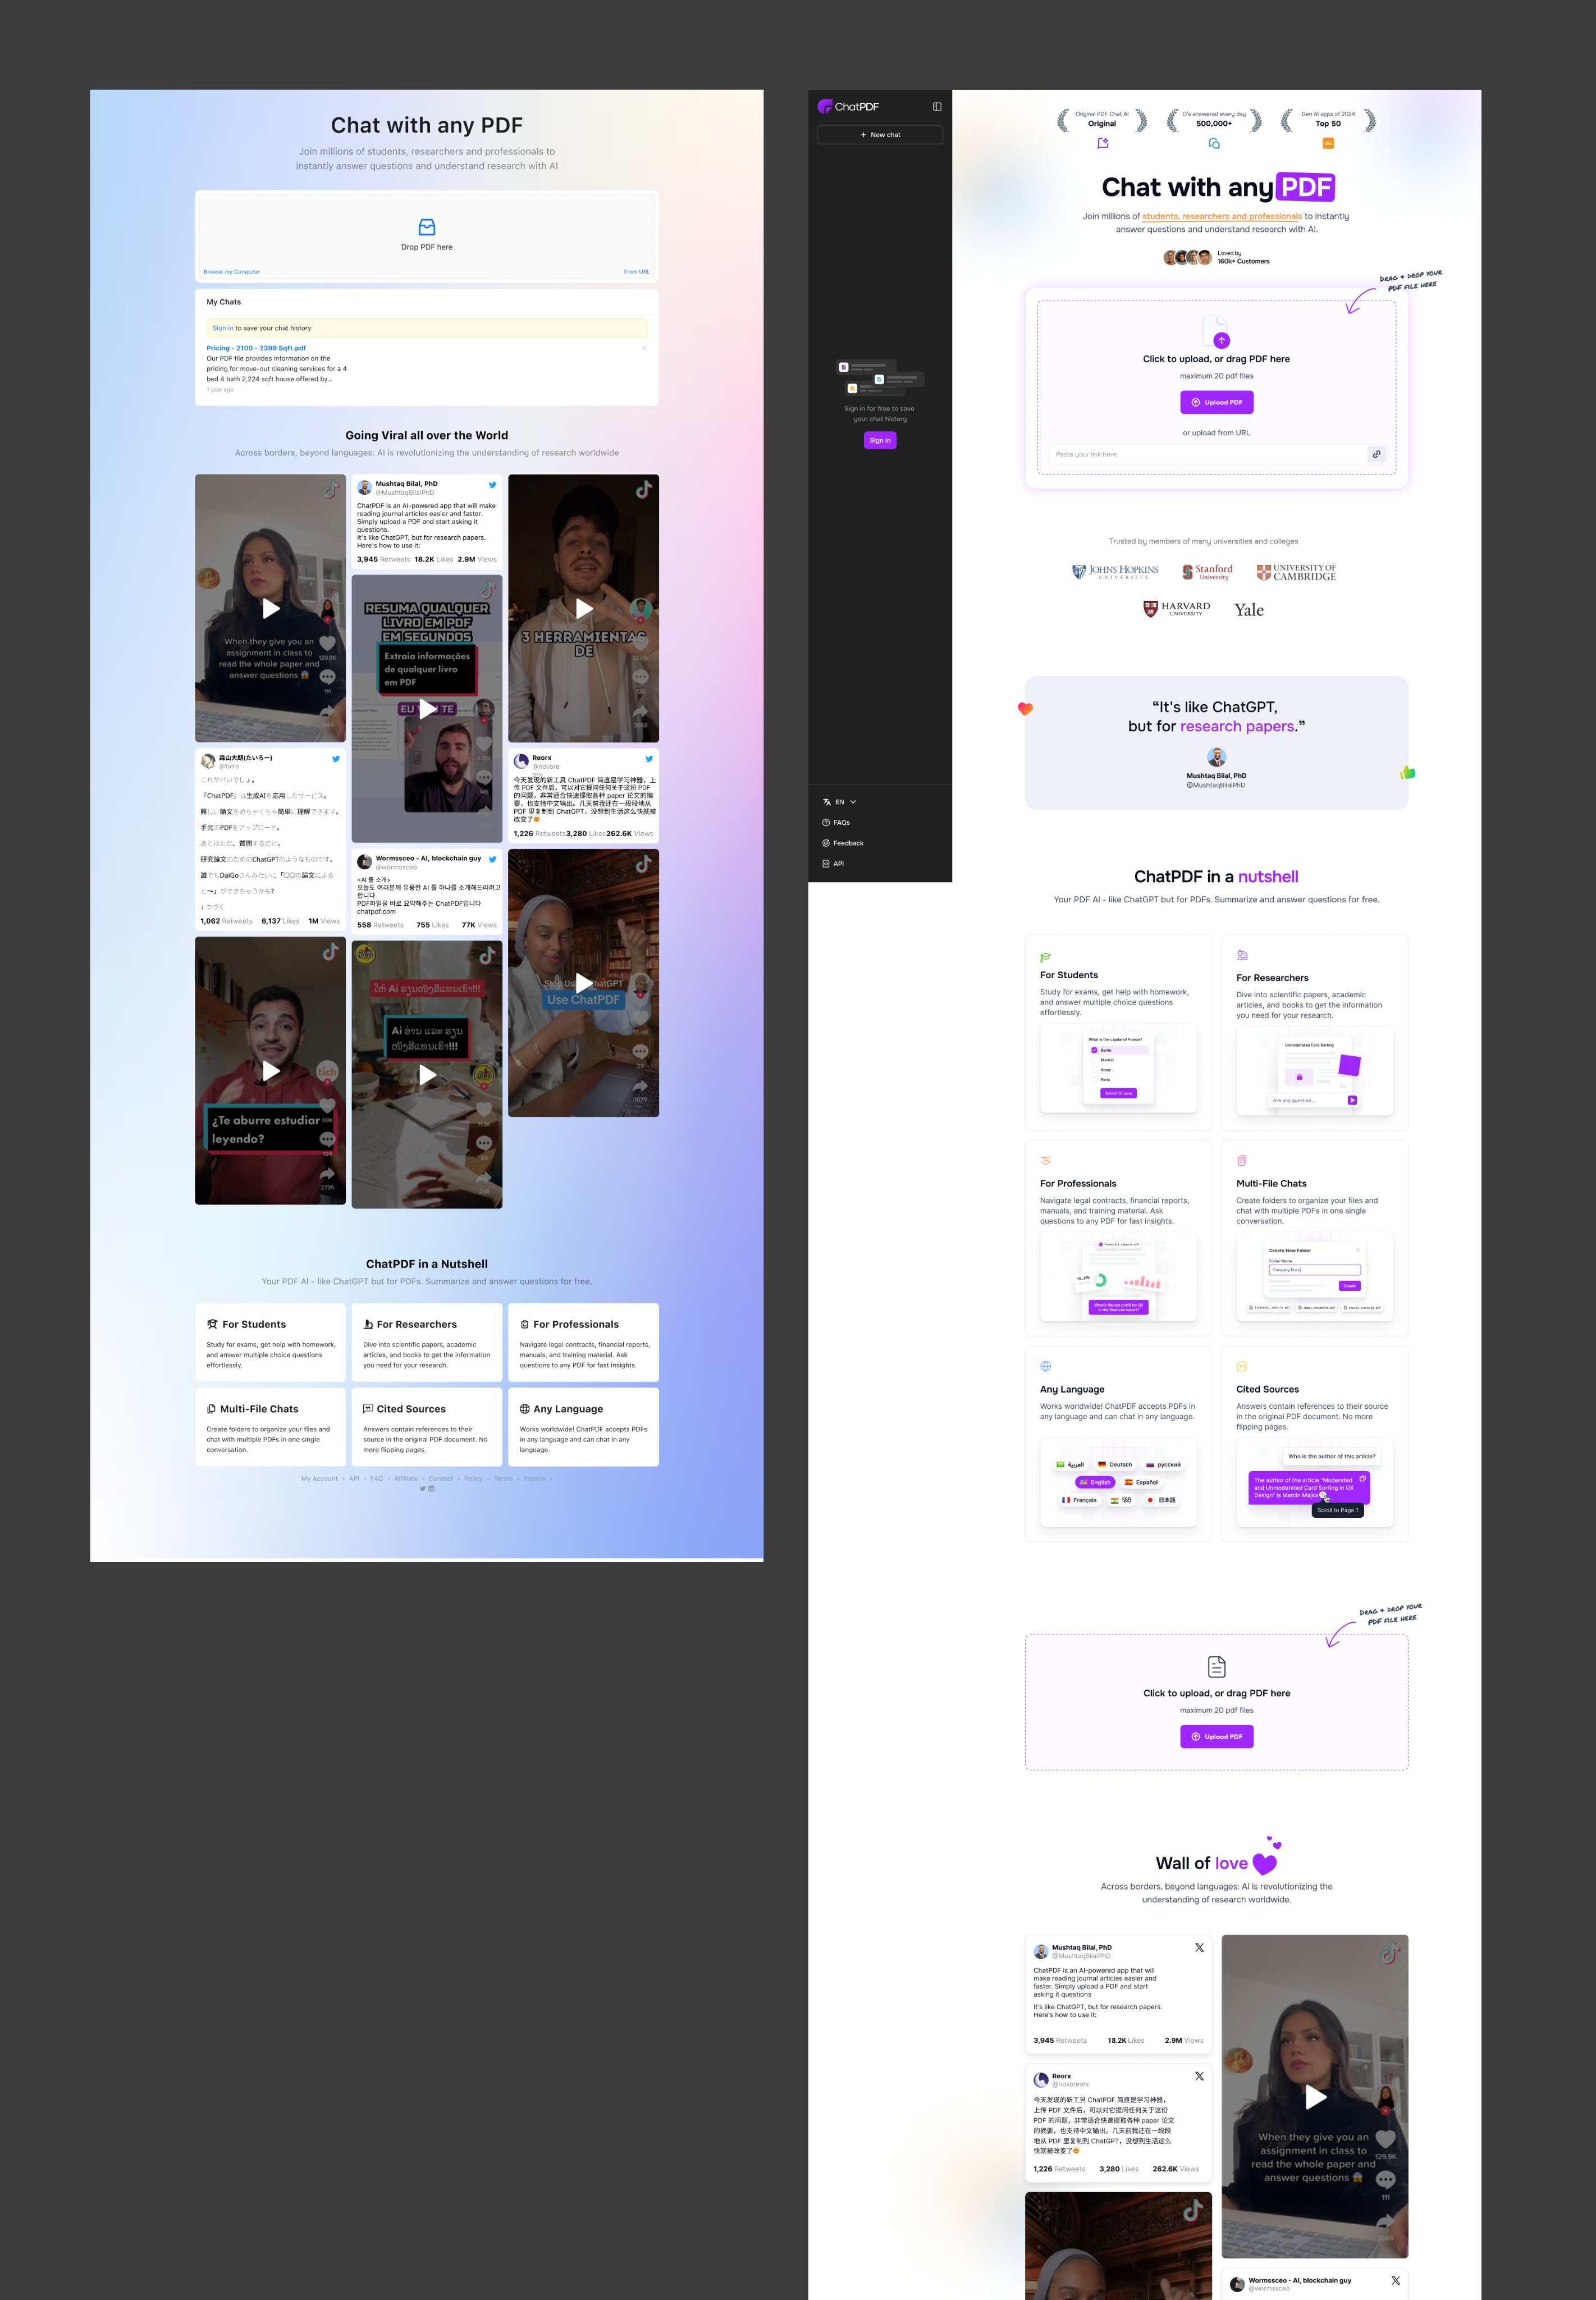
Before and After of Chat with any PDF Sales Page
The new Chat with any PDF site nailed a subtle but powerful marketing principle: clarity converts. The redesign makes it...
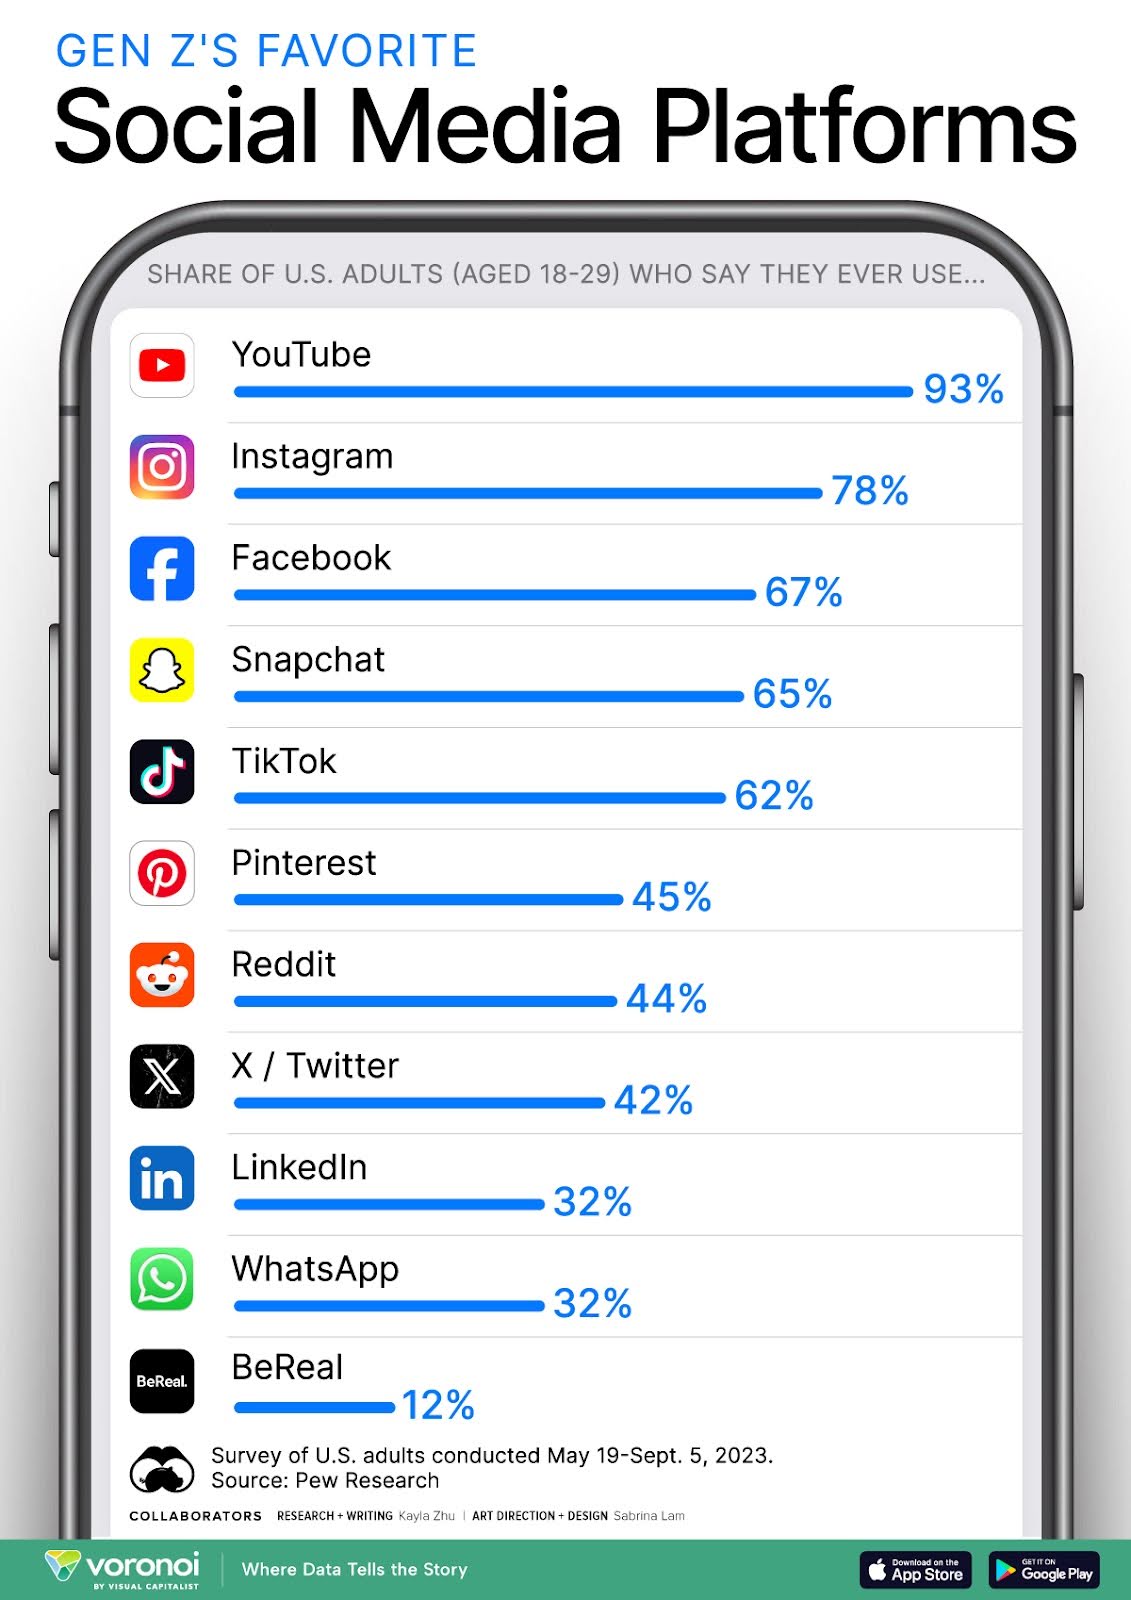
Gen Z's Favorite Social Media Platform
This chart nails down where 19–29 year olds actually spend their scrolling time. Spoiler: YouTube dominates with a massive 93%....
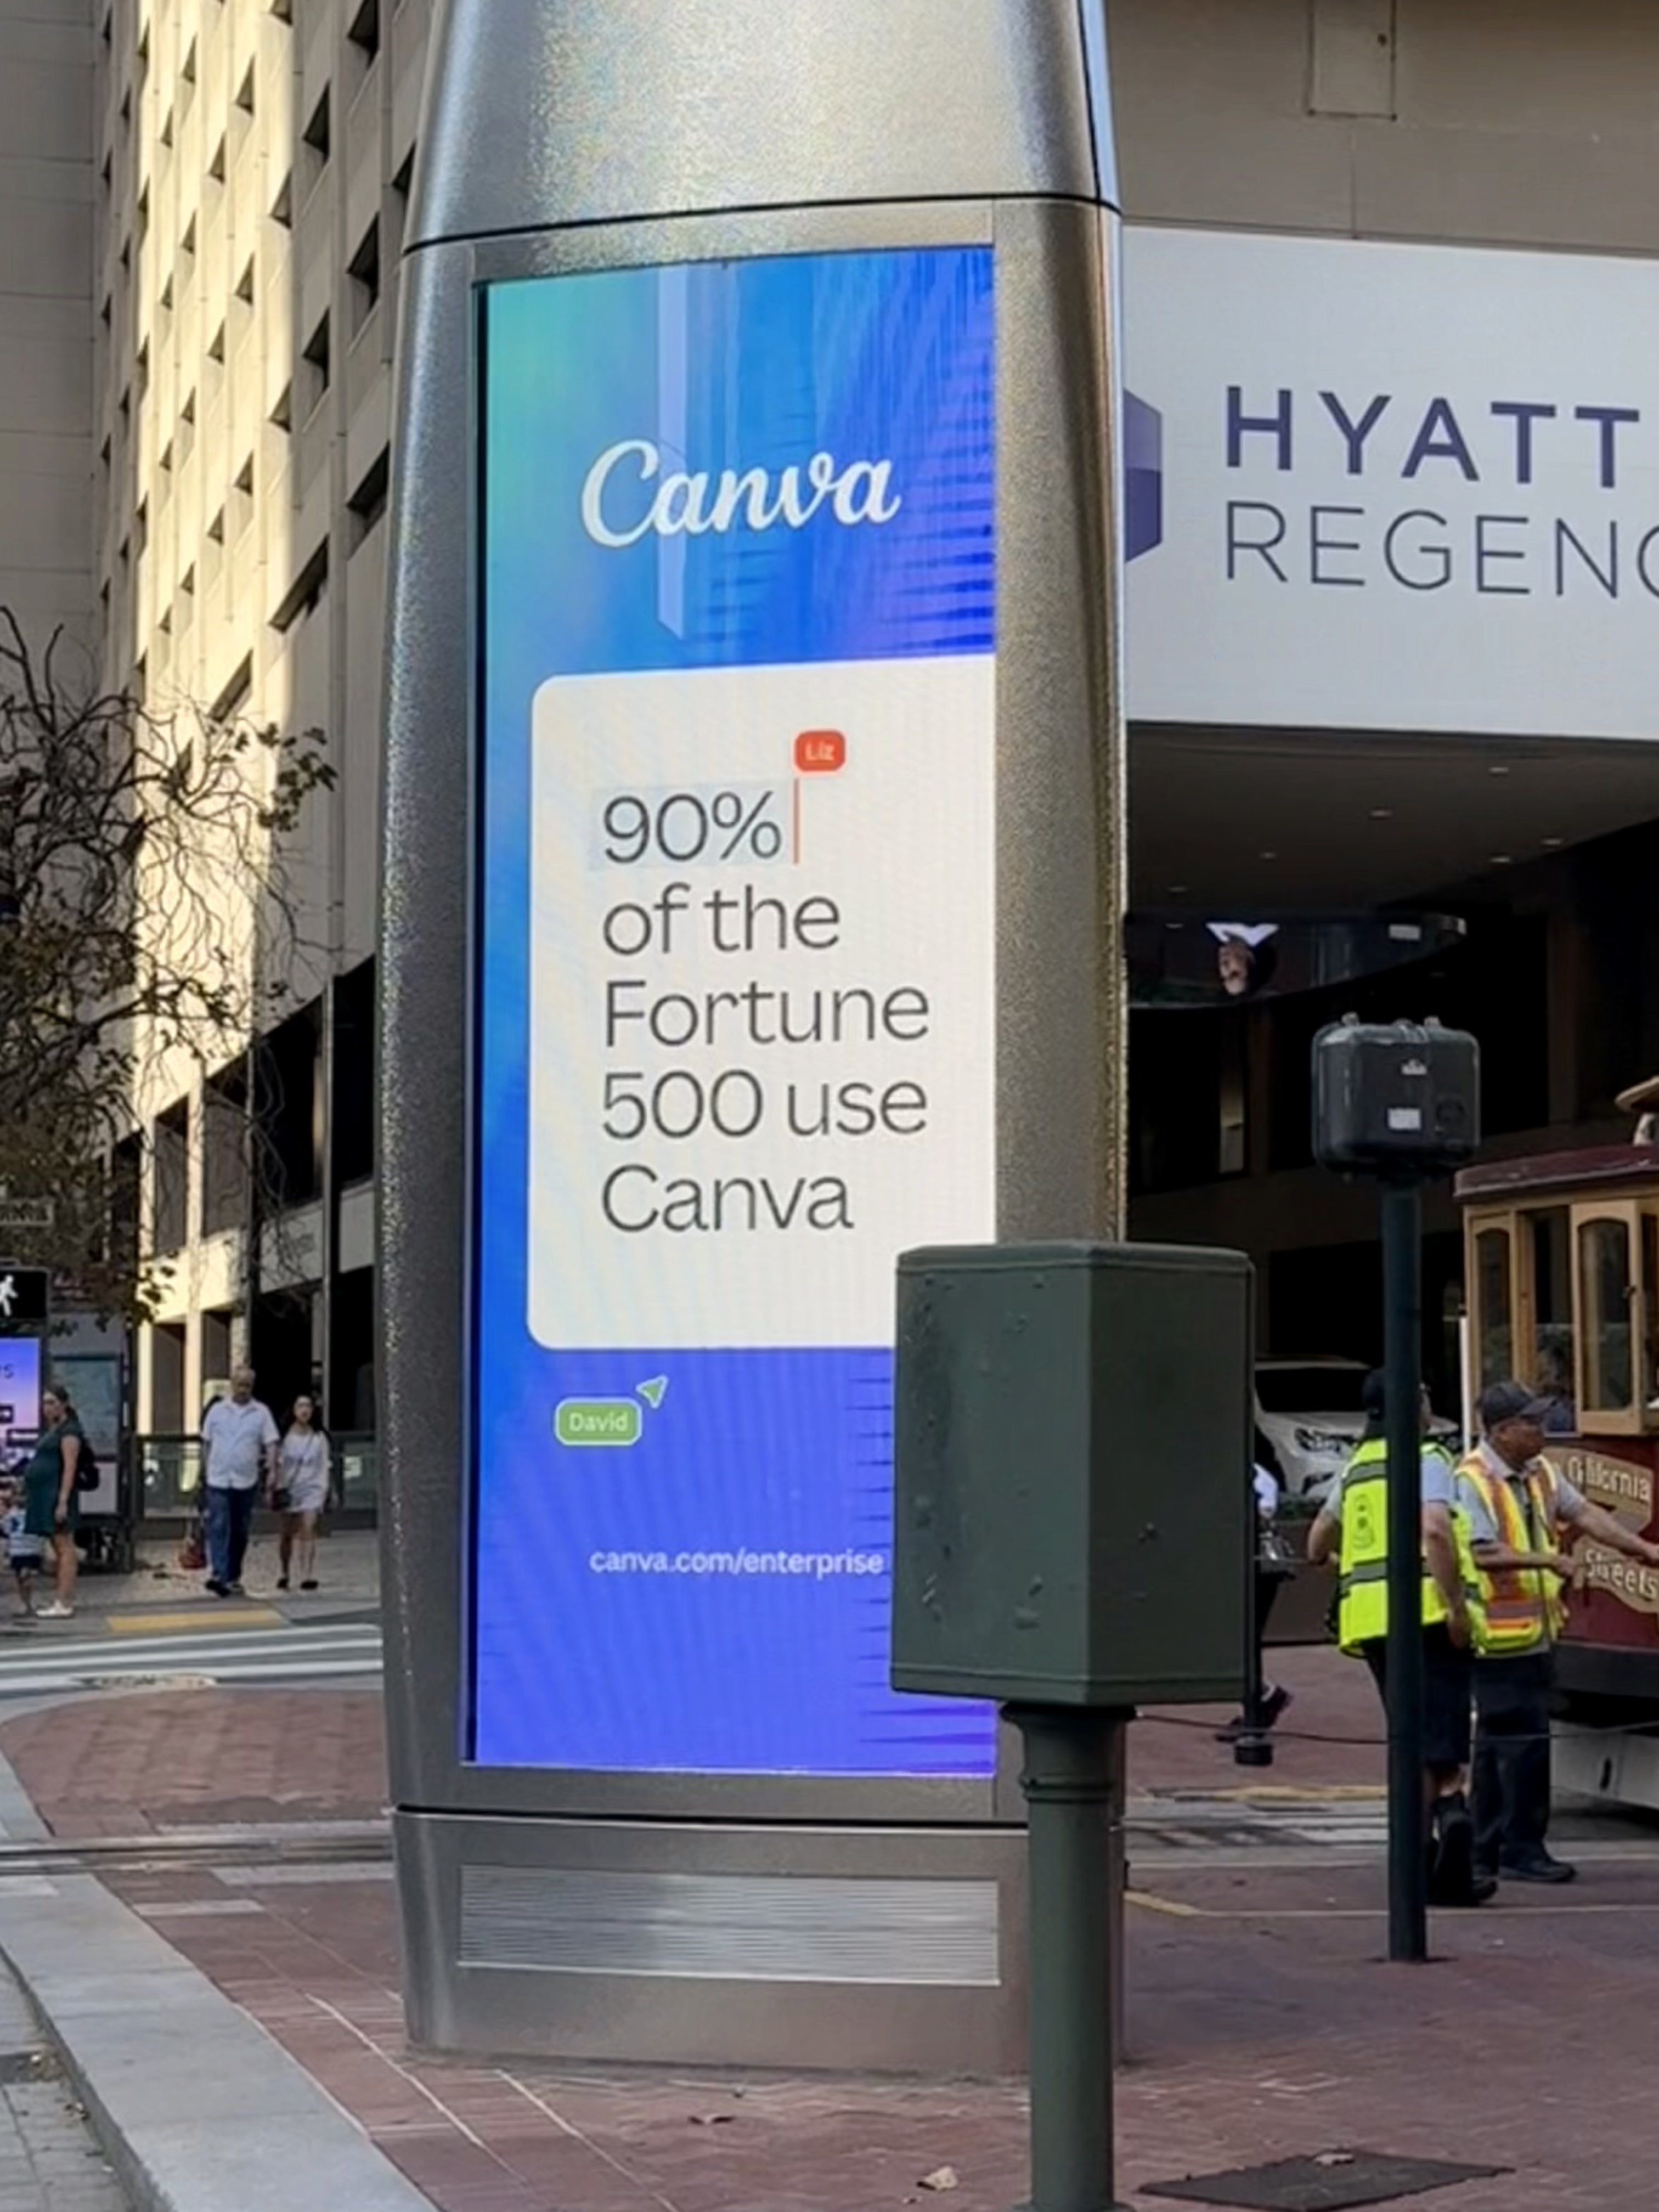
90% of the Fortune 500 use Canva Ad
Canva nailed the art of social proof with this clean, confident ad. One line: “90% of the Fortune 500 use...

What the masses know they should do -vs- a magic formula
This image nails one of marketing’s biggest truths: people crave instant results. One line points to “Healthy Habits” with a...
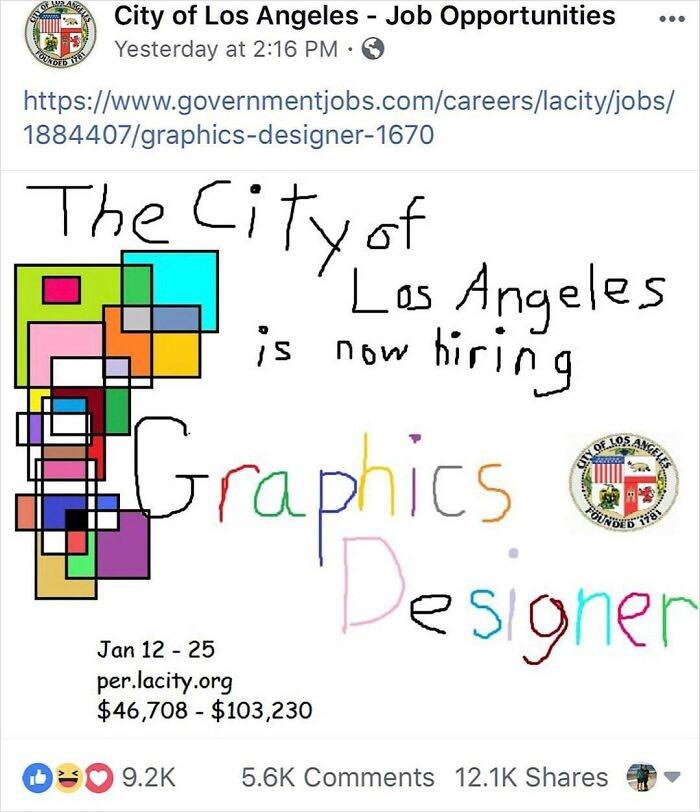
City of Los Angeles crappy designer ad
This City of Los Angeles job ad looks like it was drawn during recess. That’s exactly why it works. In...

How to learn copywriting, what order to learn skills
This one image sums up a killer marketing roadmap. Each month teaches one key copy skill — stack them all,...

Good vs. bad crypto wallet graph
Vitalik’s simple chart nails a massive UX truth: good products protect users from both external villains and their own oops...

LeadPages Speedy Social Media Ad
LeadPages nailed this one. Their ad shows a girl zipping on a bright pink scooter with one clear promise: fast...