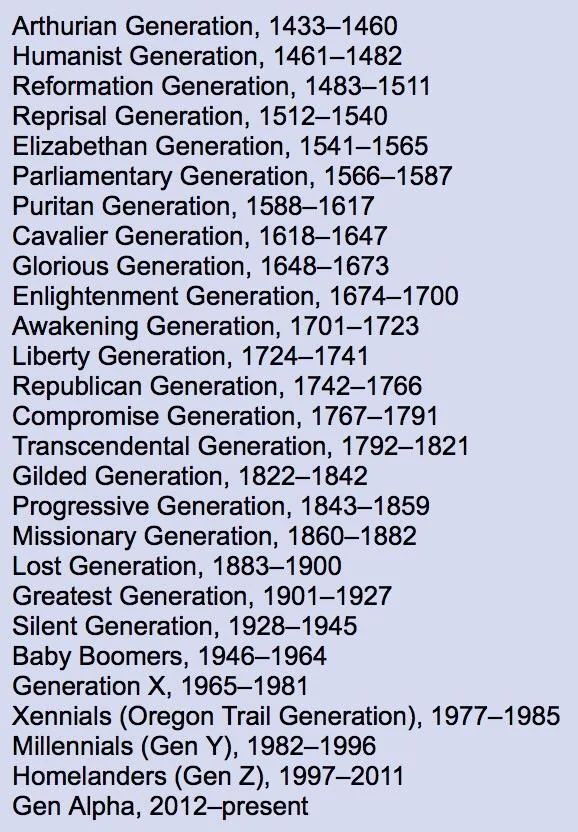
What every generation is called by year
People love labels. Always have. This list proves that naming generations didn’t start with Millennials or Gen Z. We’ve been...
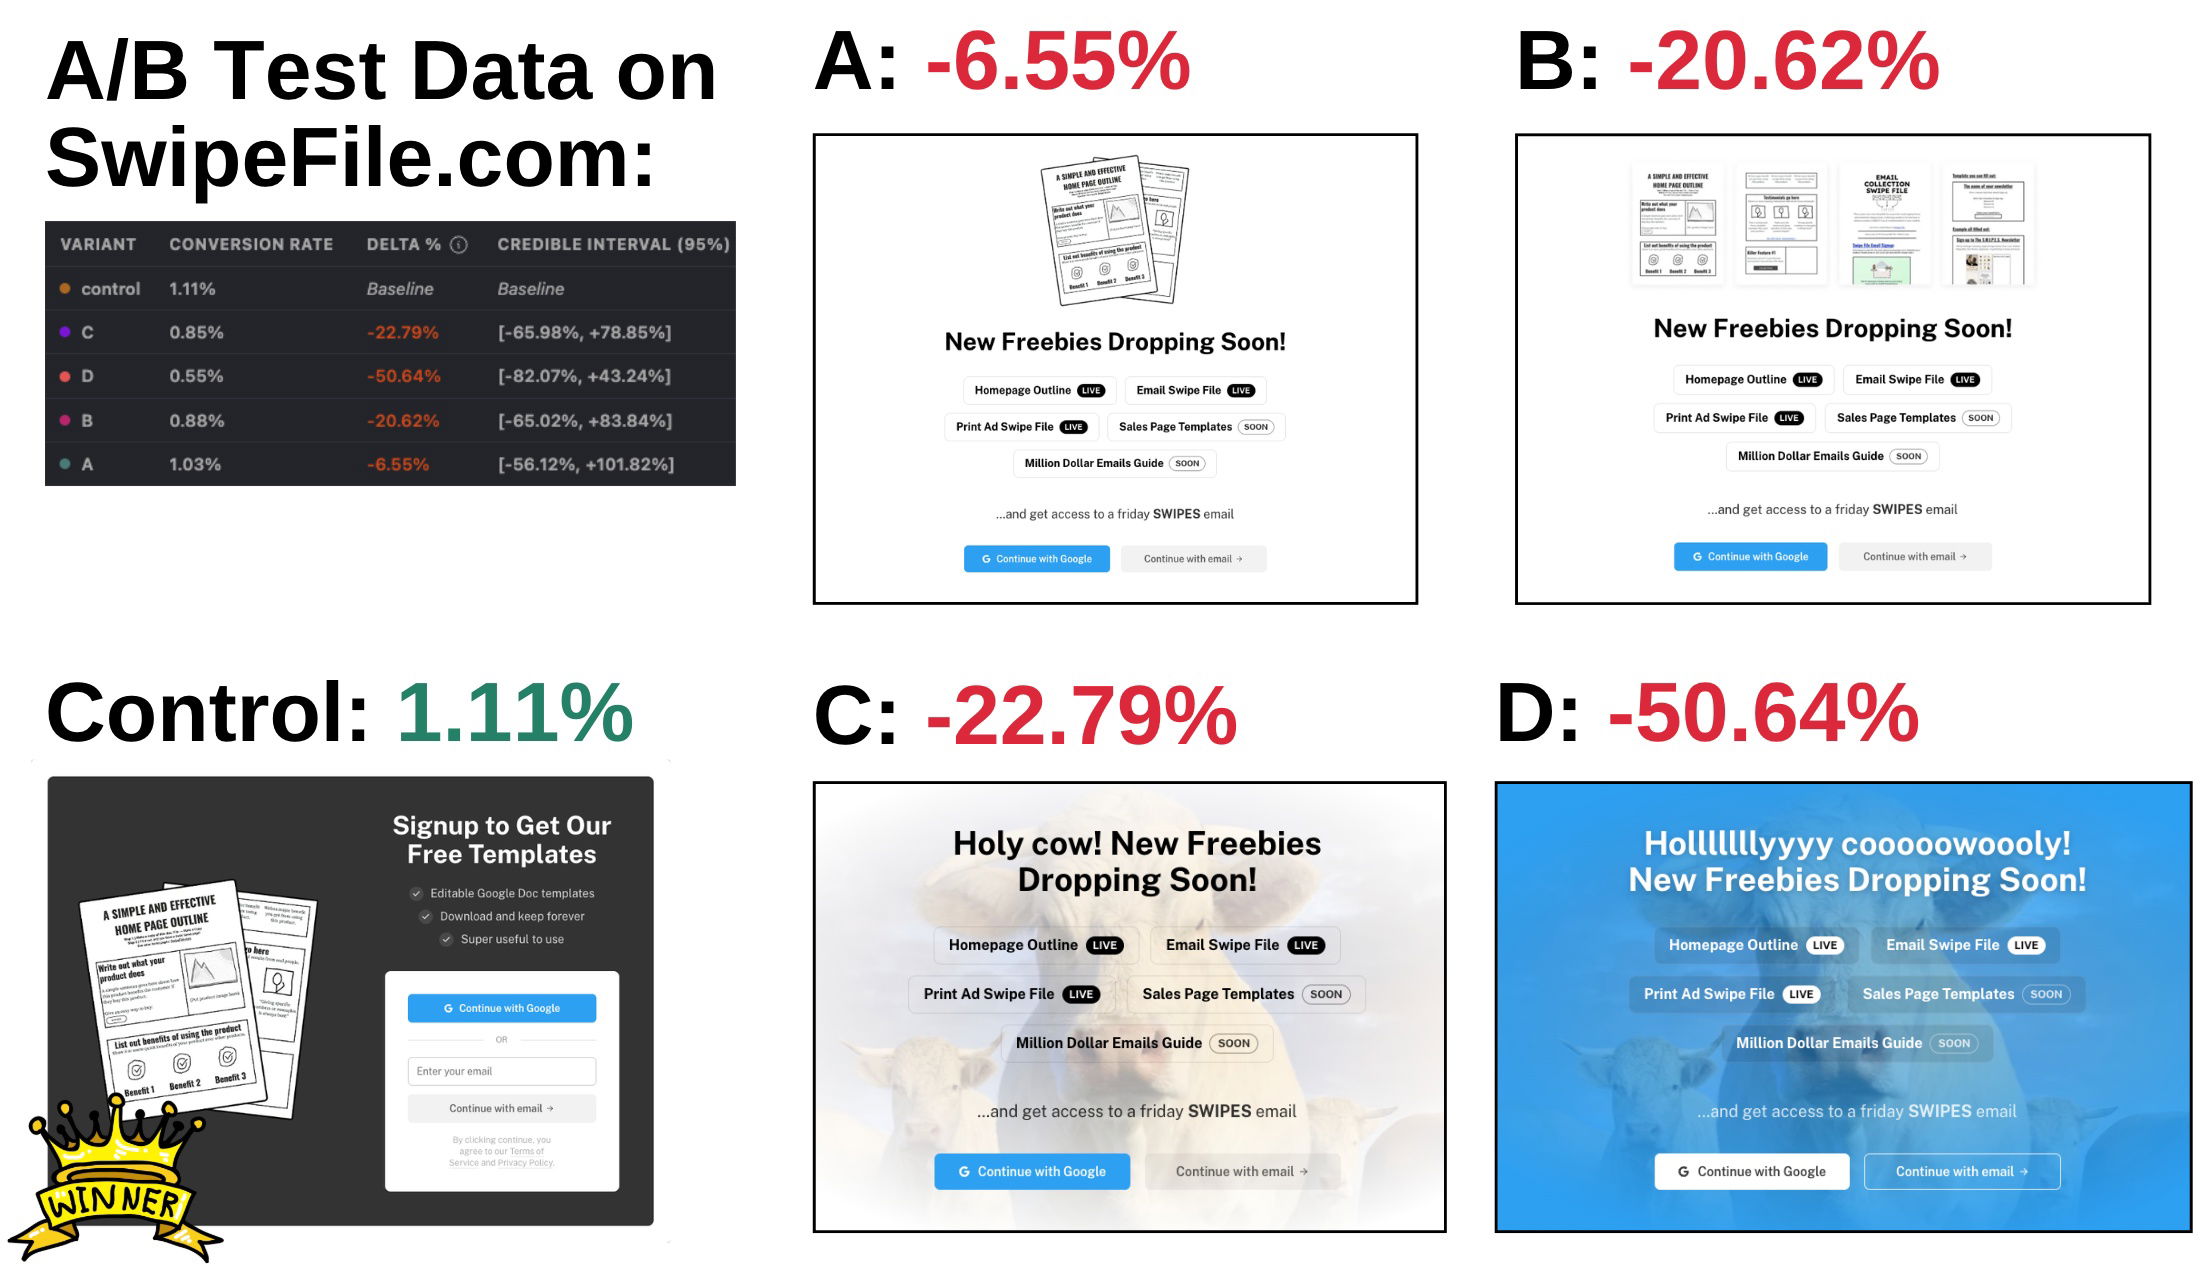
SwipeFile Signup A/B Split Test
Sometimes the ugly duckling is already a swan. SwipeFile.com ran a 3-week A/B test on their signup form, trying four...
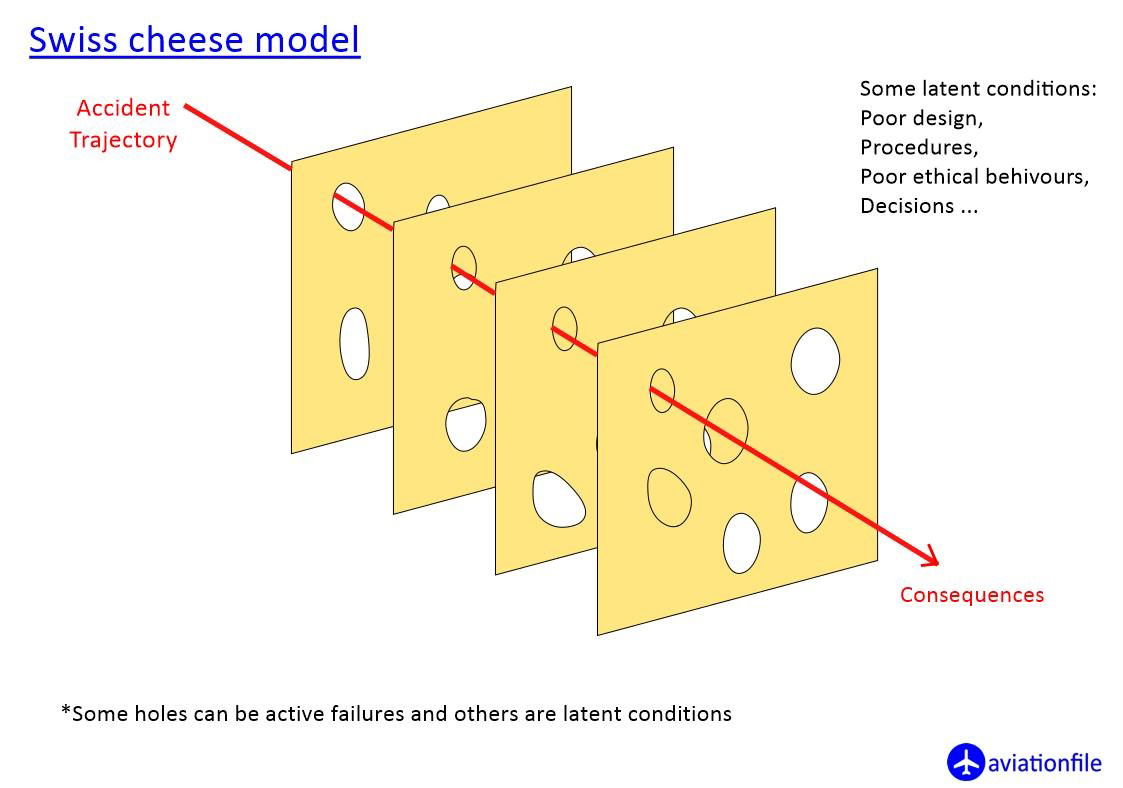
Swiss Cheese Aviation Accident Framework
Ever seen the Swiss Cheese Model from aviation safety? It’s a perfect metaphor for marketing fails. Each “slice” is a...
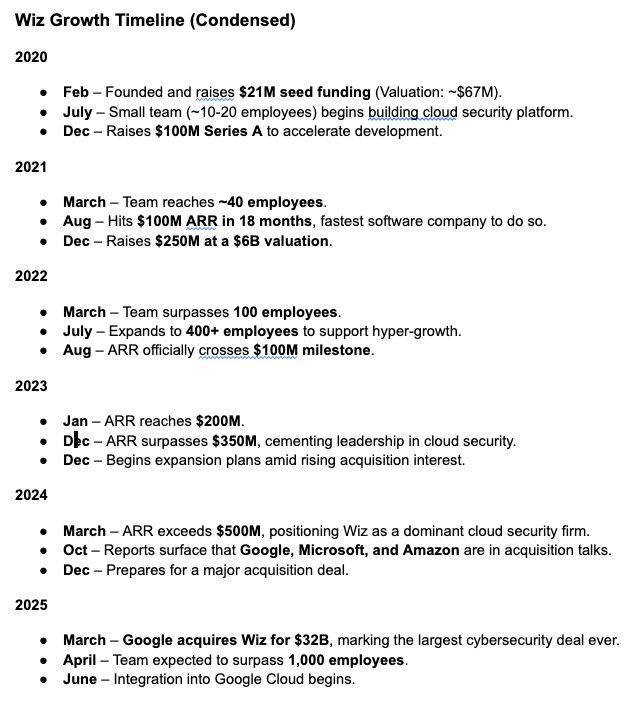
Wiz was founded in 2020, sold to Google 5 years later for $32 Billion
This growth chart looks fake. Founded in 2020, sold to Google in 2025 for $32 billion. That’s five years from...
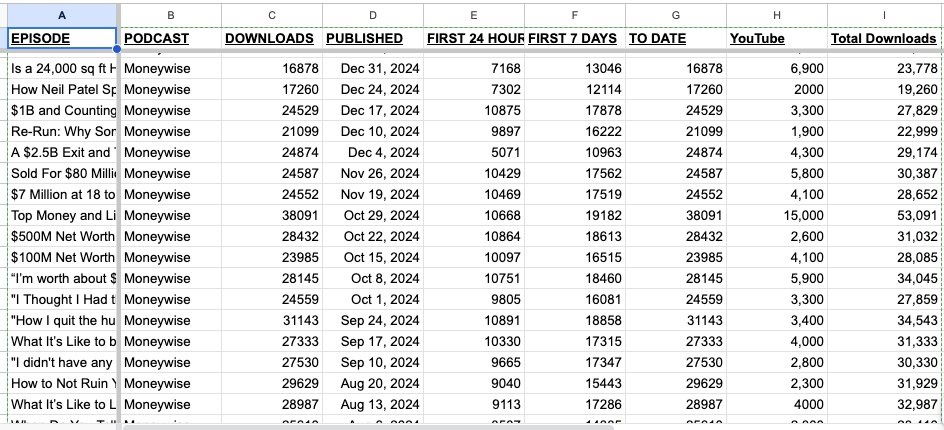
MoneyWise Podcast Download Numbers from Sam Parr
This spreadsheet gives a peek into MoneyWise, a podcast quietly pulling tens of thousands of downloads per episode. No flashy...
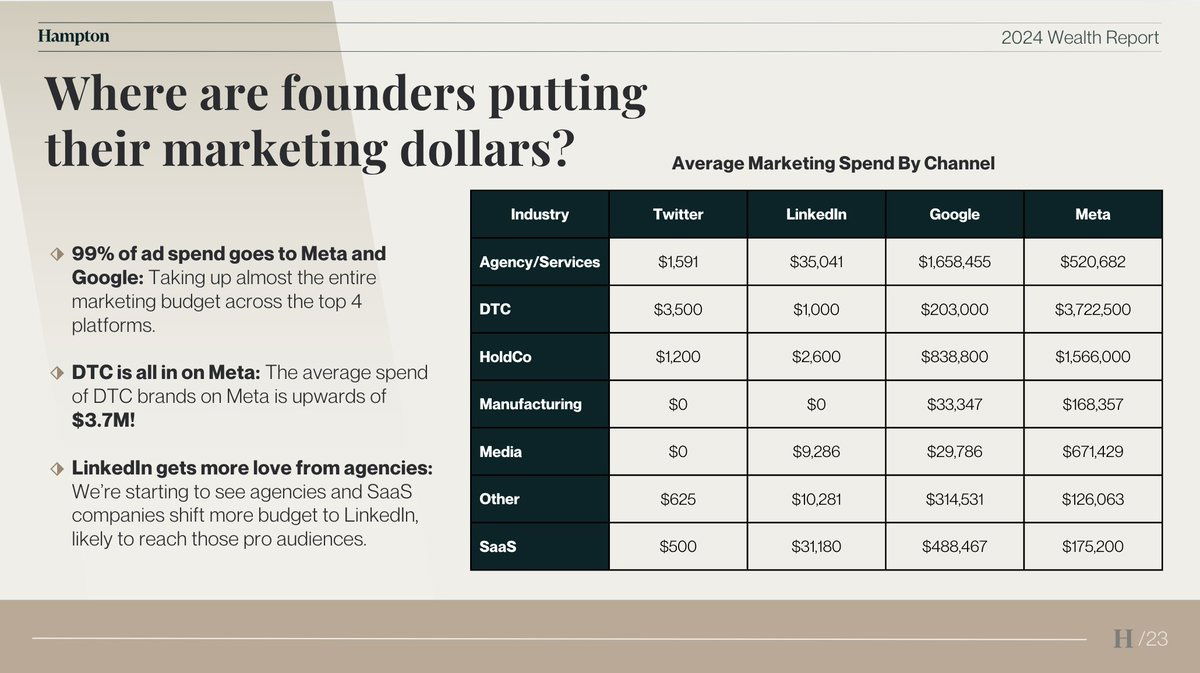
Where are founders putting their marketing dollars?
Sam Parr’s data drop from 100+ founders shows where the real ad money flows. Spoiler: it’s almost all Google and...

Rand Fishkin's "Audience Influence Spending" Slide
Rand Fishkin showed this killer chart comparing where audiences are influenced vs where marketers spend money. Spoiler: they don’t match...
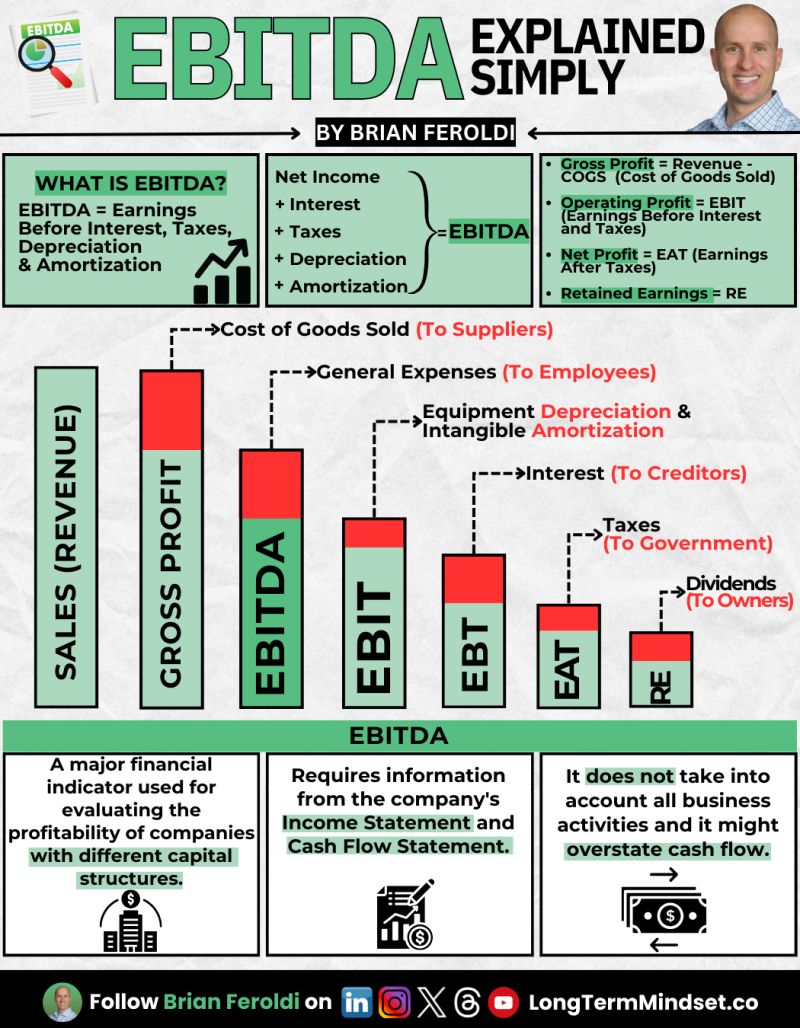
EBITDA Explained in one image
Ever heard Buffett call EBITDA “bulls**t earnings”? That’s because this little acronym likes to make companies look way shinier than...
One bad day, but longterm good
This visual nails a powerful truth: short dips don’t define long-term success. Whether in stocks, business, or marketing, one down...
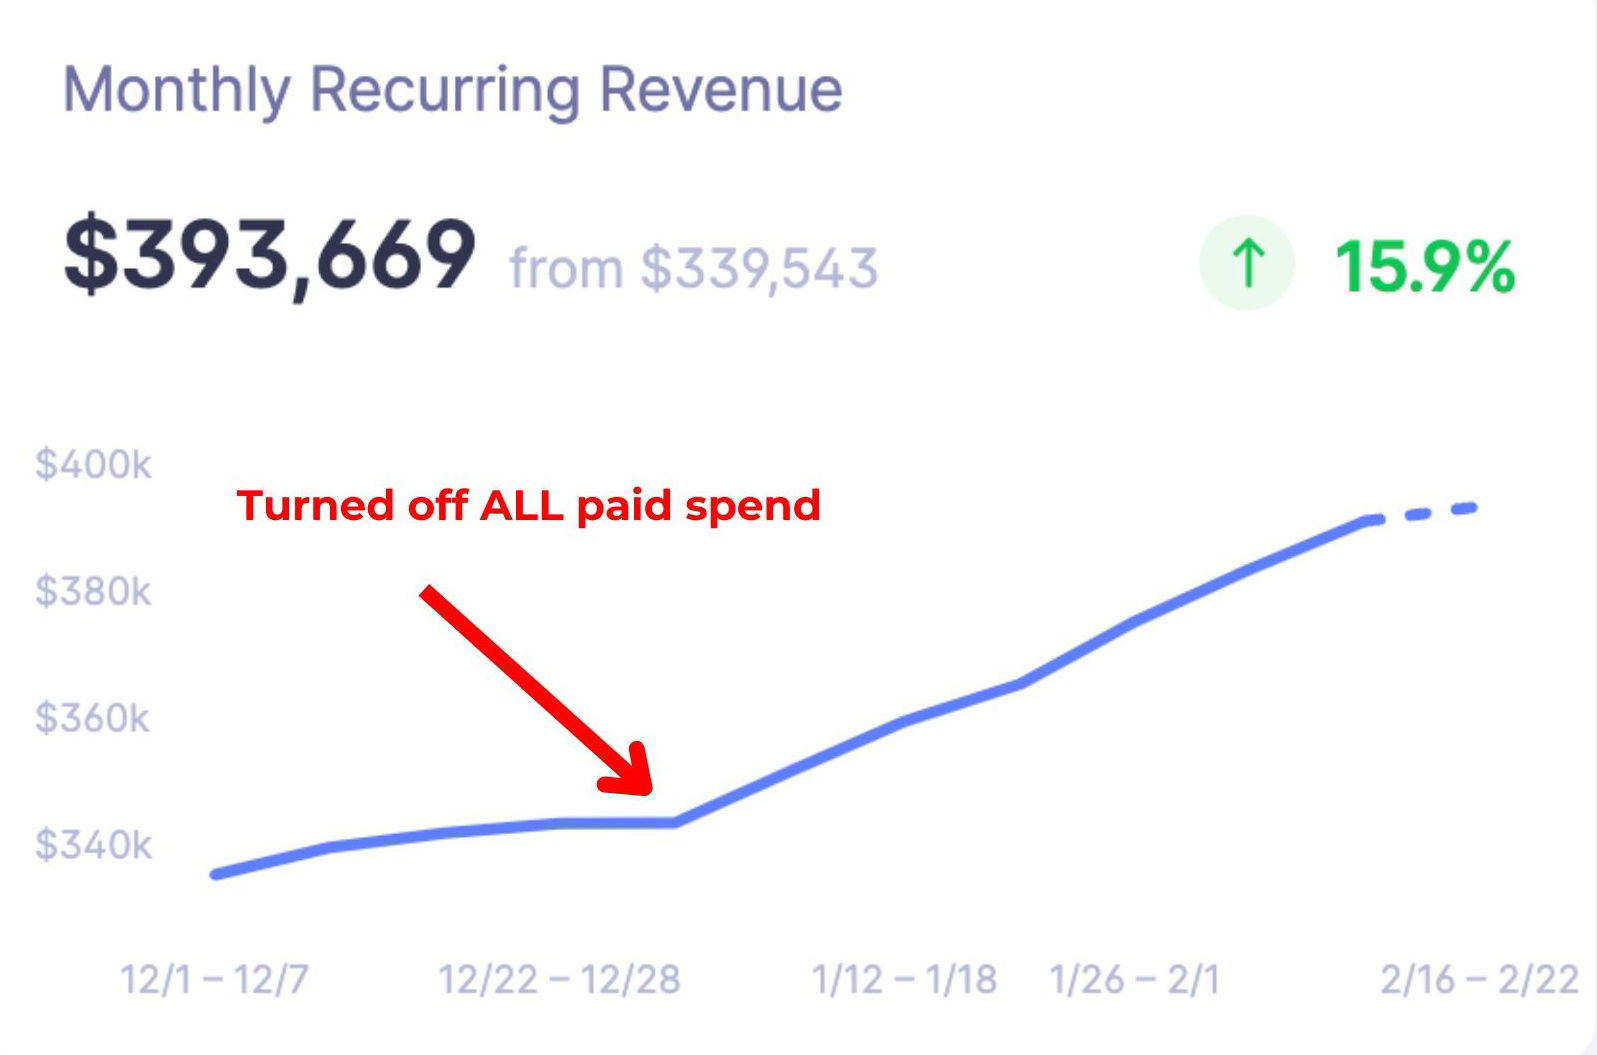
Stopped all paid spending, revenue went UP
Adam Robinson from Retention.com pulled a gutsy move: he turned off all paid ads. You’d expect revenue to tank, right?...
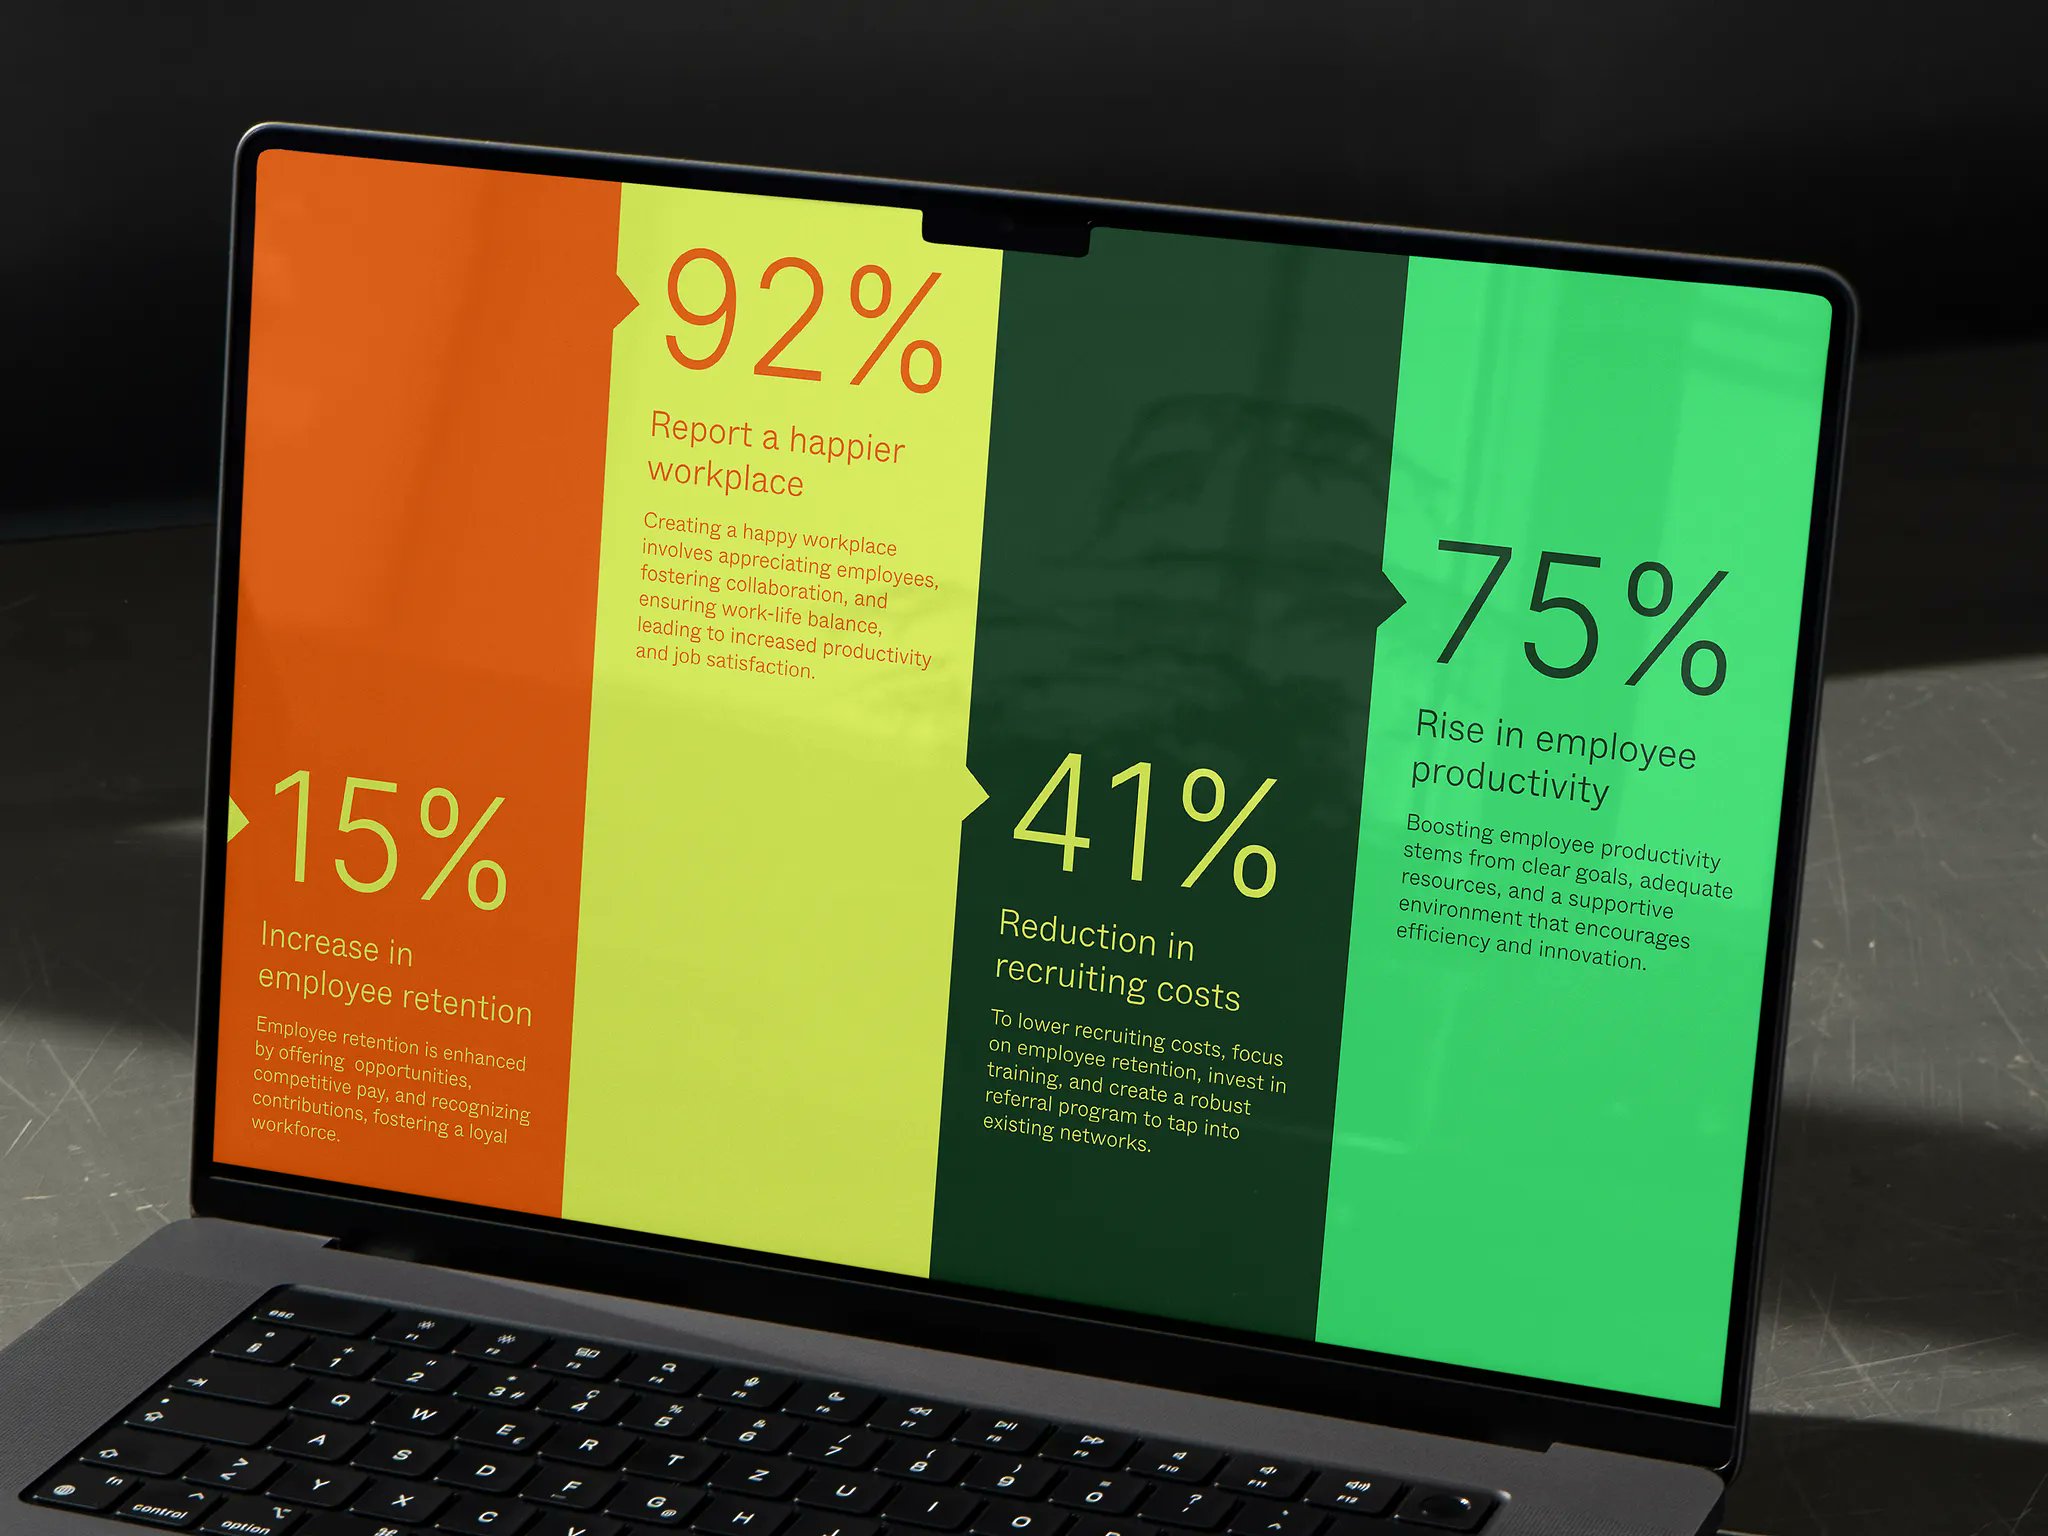
Big ole numbers are good
See those bright, bold percentages on the screen? They instantly grab your eyeballs and scream credibility. This is how you...
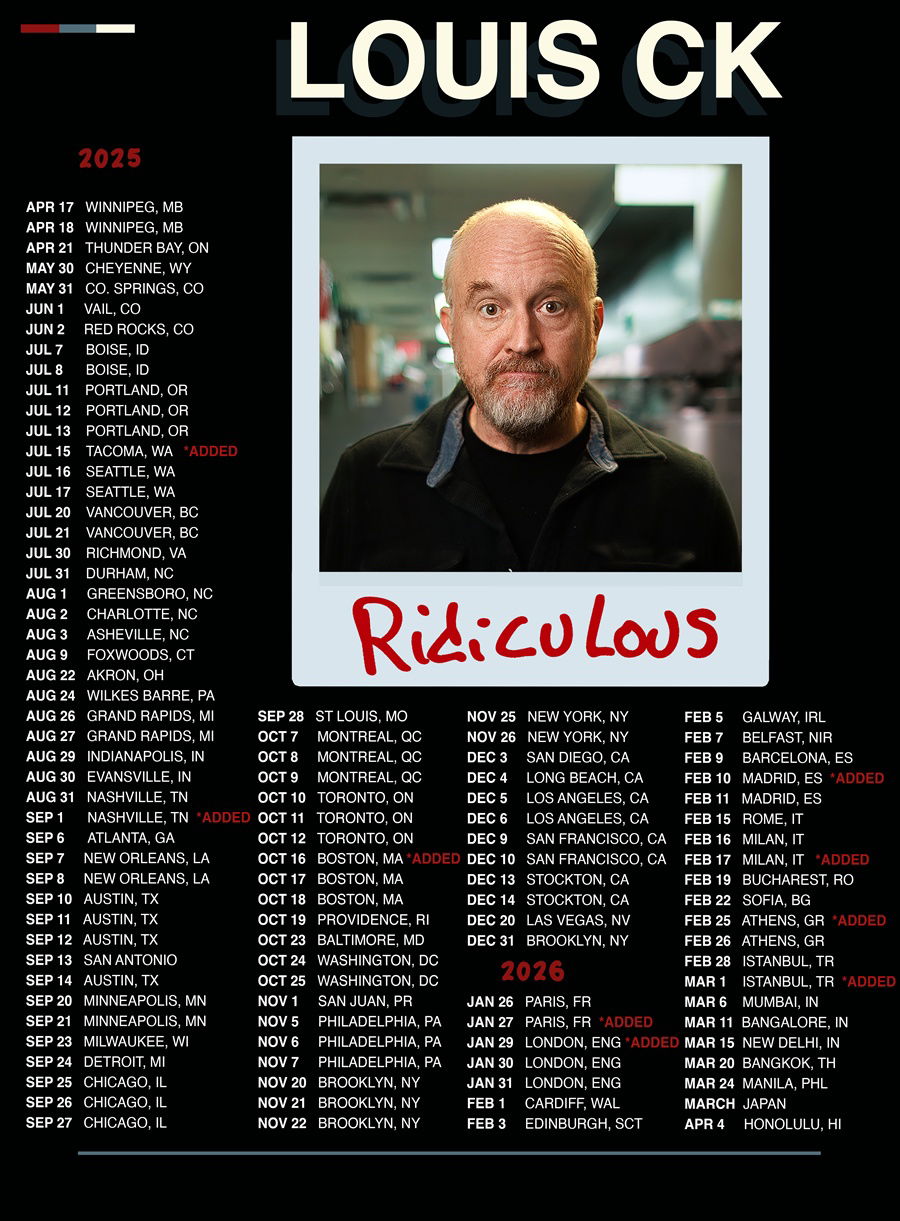
The absolutely insane travel schedule of a comedian
Stand-up comedy looks nothing like your average job. Louis C.K.’s 2025 tour proves it: 107 shows, 69 cities, 28,000+ miles...
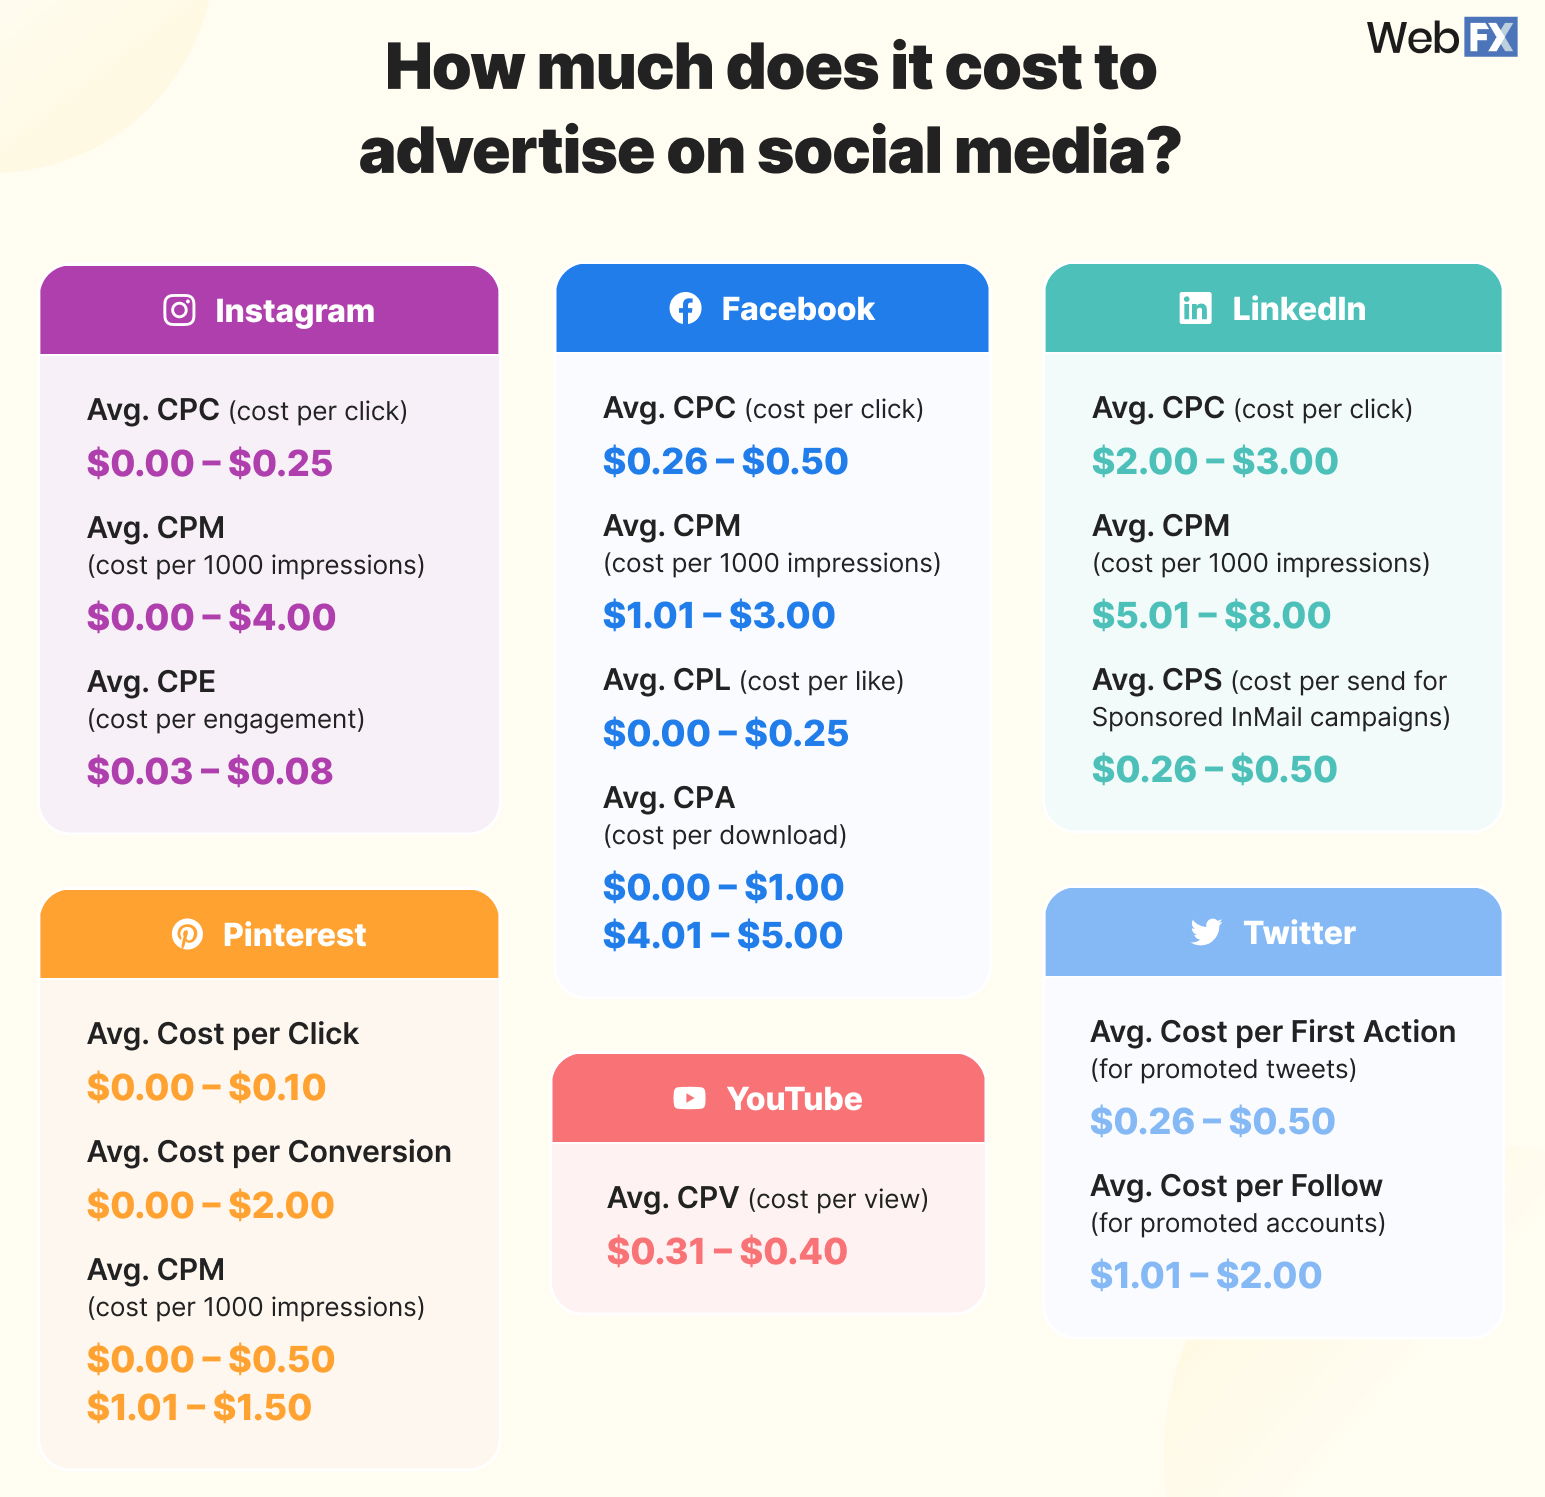
How much does it cost to advertise on social media chart
Ever wondered how much it actually costs to run ads on social media? This chart breaks it down beautifully and...
Be adjacent to expensive transactions. If you sell an $80,000 car and get a percentage, it could be a lot of money.
Before/After Software Ad for Icon
This ad from Icon is a masterclass in visual contrast. On one side: a chaotic pile of tools adding up...
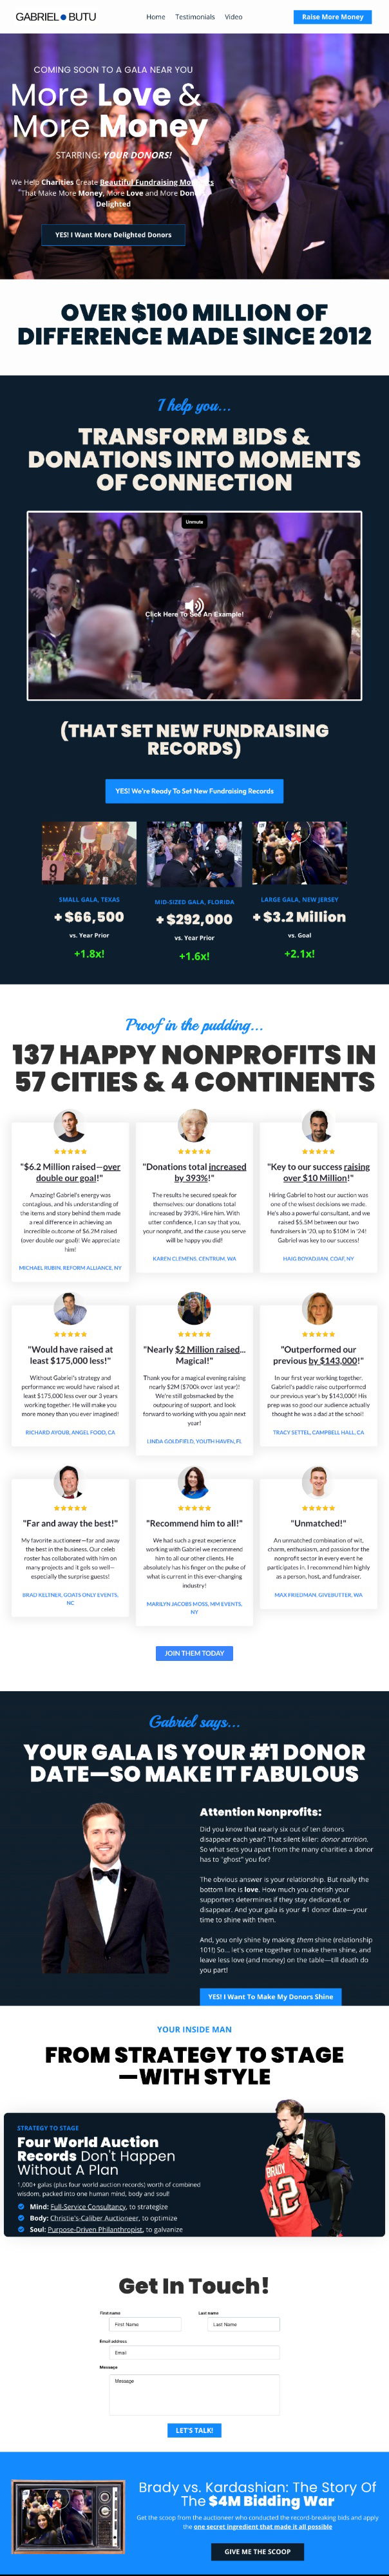
Homepage for professional charity gala auctioneer
Gabriel Butu’s landing page is a masterclass in authority and energy. He’s not just saying he’s great at fundraising—he’s proving...
These are the credit cards points that you want
Ever notice how some people get free flights while others barely snag a $50 gift card with the same spending?...
This is the real passive income
Neville Medhora once shared the best money advice he ever got: “Spend less than you make, and invest the rest.”...

Natural Balance Pet Food Insider Signup
Natural Balance nails their signup form with one simple move: they ask for your pet’s breed. That tiny question turns...
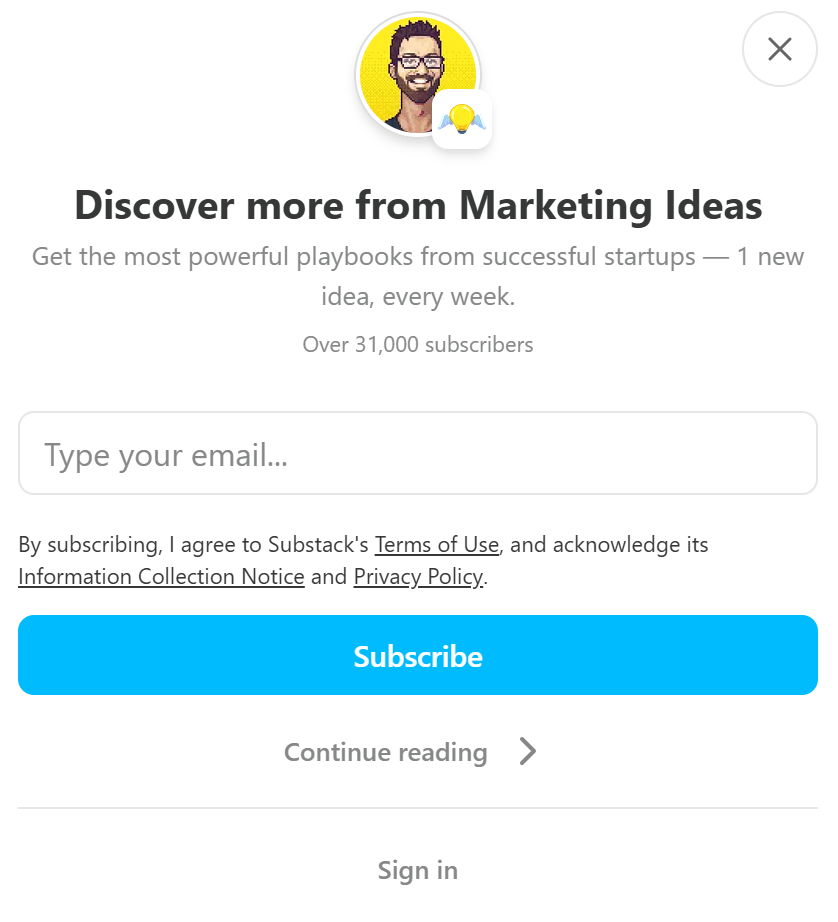
Marketing Ideas one idea a week email signup
A clean, promise-driven email signup can be a growth machine. This one for “Marketing Ideas” nails it with zero distractions...

Dharmesh's "Strong Market Need" Graph
Dharmesh Shah (founder of HubSpot) drops a truth bomb: don’t obsess over building the “perfect product” first. Instead, start with...

Big numbers on a pitch deck are helpful
Nothing grabs attention faster than large, bold numbers. Designer Anthony Miller nails this idea by making numbers like “$100M” and...
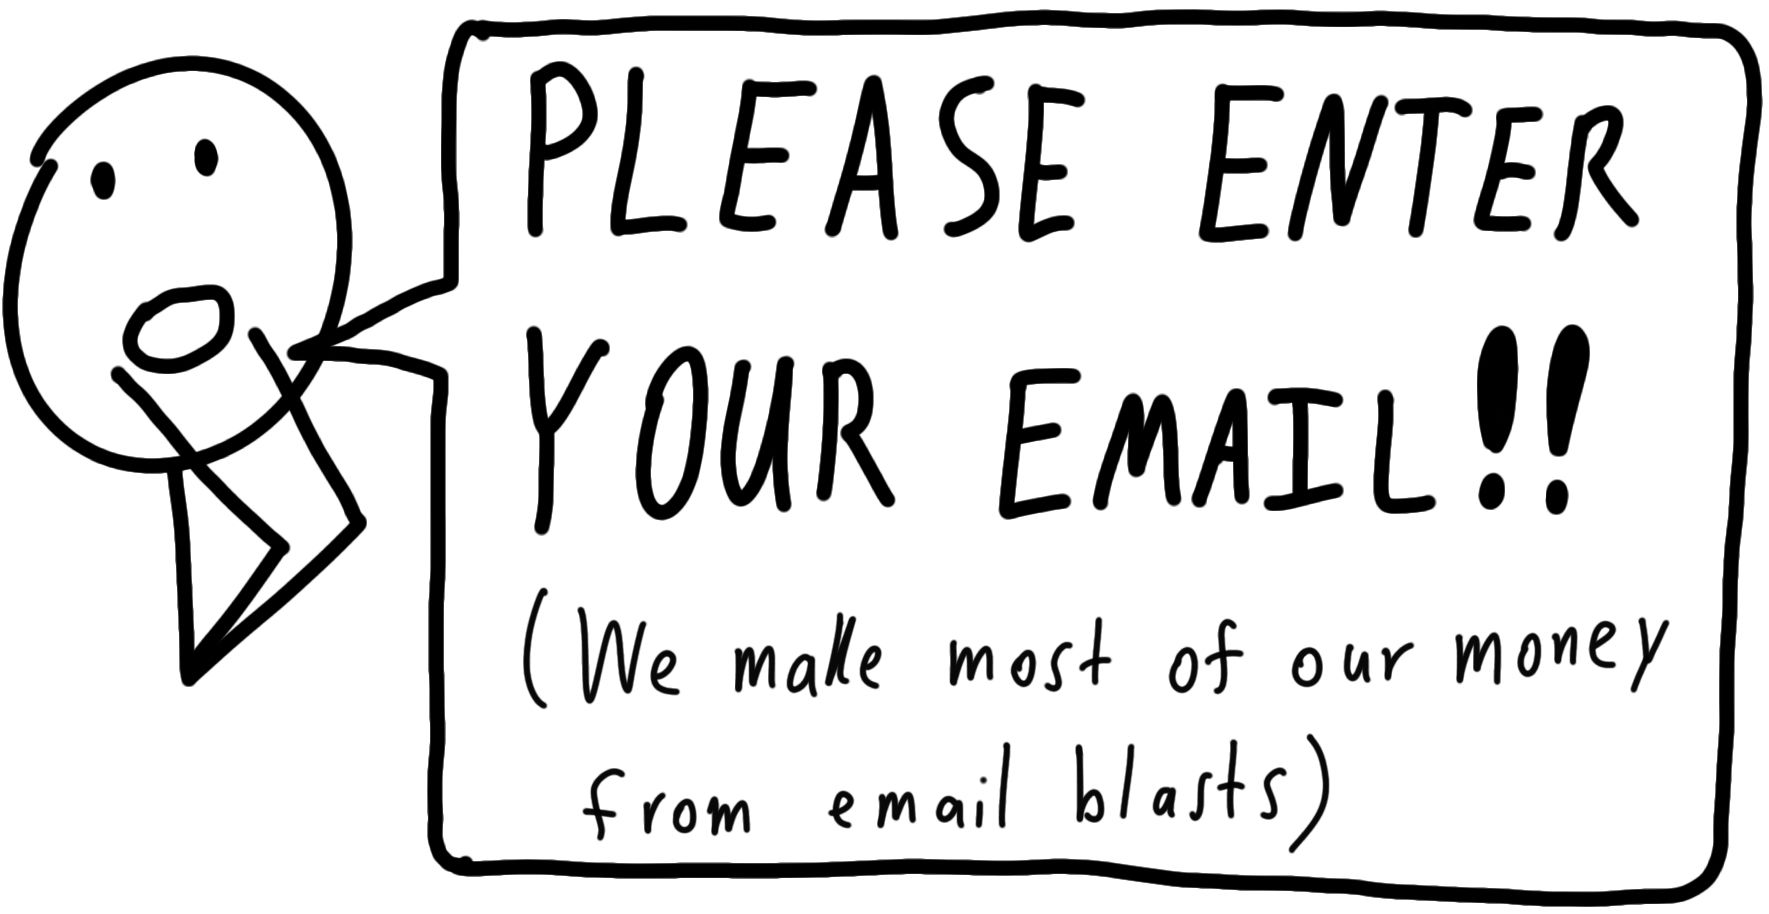
Everyone wants your email address
Look at that cartoon yelling: “PLEASE ENTER YOUR EMAIL!!” It’s funny because it’s true. Every website you land on wants...

Getting good sleep tips
This infographic nails it. One clear image, clean arrows, short explanations, and practical tips—all in under a minute of reading...