
Big numbers on a pitch deck are helpful
Nothing grabs attention faster than large, bold numbers. Designer Anthony Miller nails this idea by making numbers like “$100M” and...
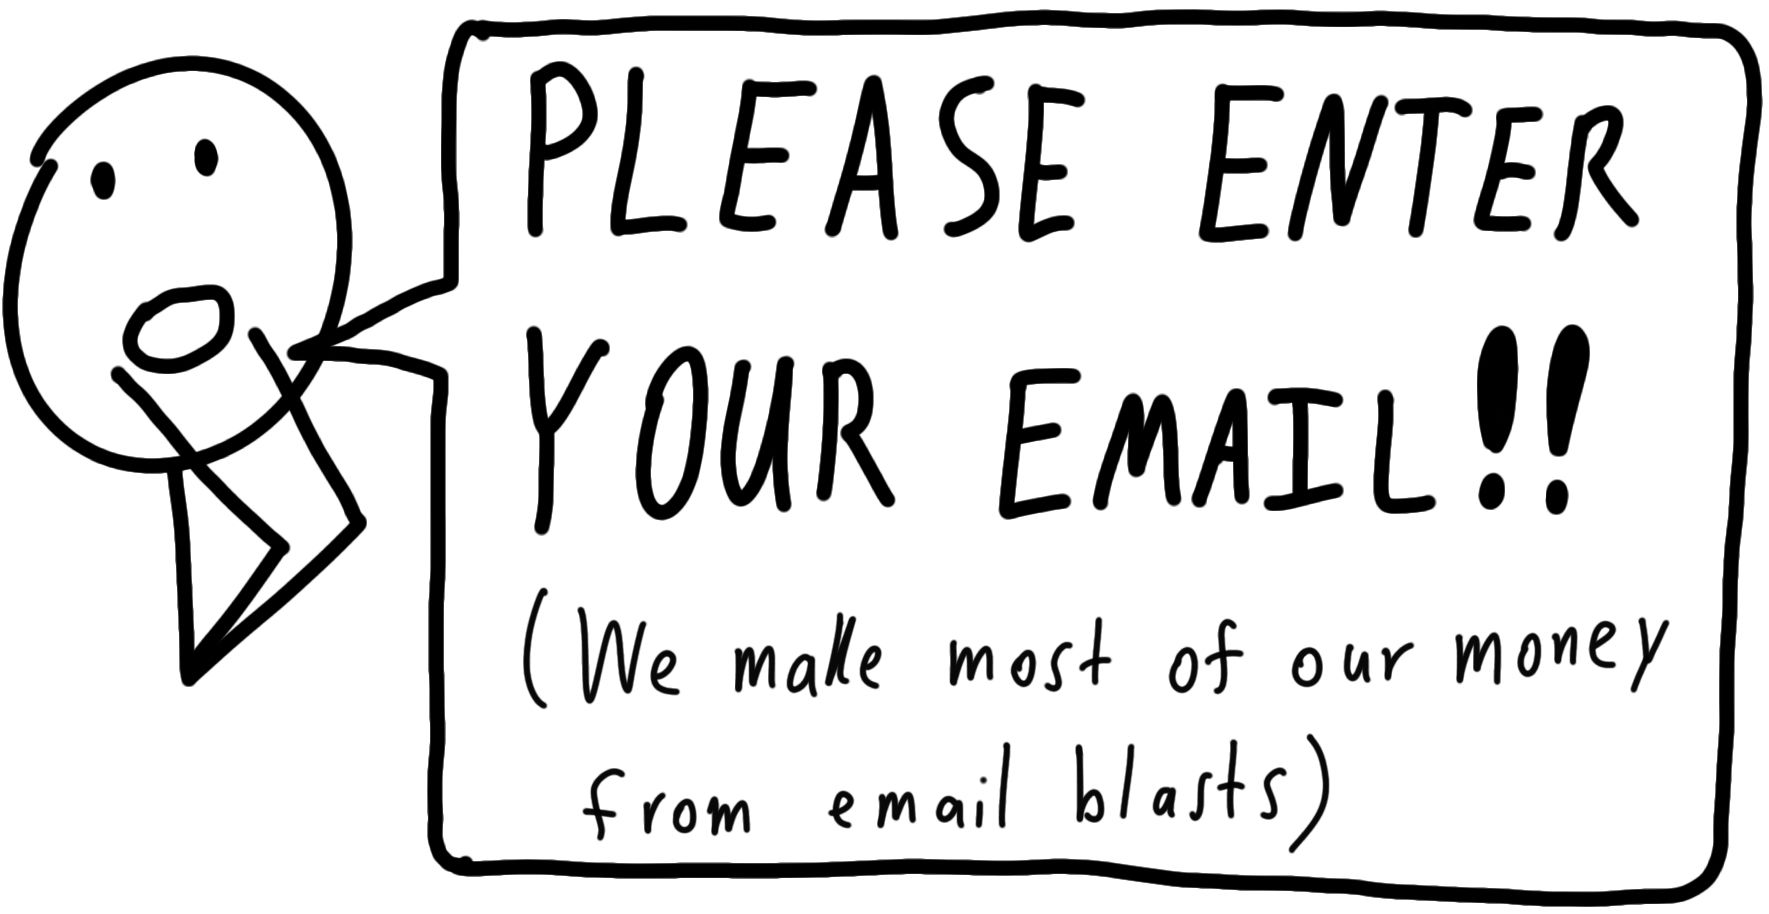
Everyone wants your email address
Look at that cartoon yelling: “PLEASE ENTER YOUR EMAIL!!” It’s funny because it’s true. Every website you land on wants...

Getting good sleep tips
This infographic nails it. One clear image, clean arrows, short explanations, and practical tips—all in under a minute of reading...
How I Increased This Busines Revenue By 50% In A Month Using Copywriting
Nev ran a test at a local Shoe Hospital. All he did was put out a big, clear sign that...

Copywriting Course Email Signup
Simple. Bold. Fun. That’s what makes this copywriting course signup page work. It doesn’t use fluff or fancy design tricks,...
Value as Influencer = Influence x Buying Power x Quantity of Them— Sam Parr
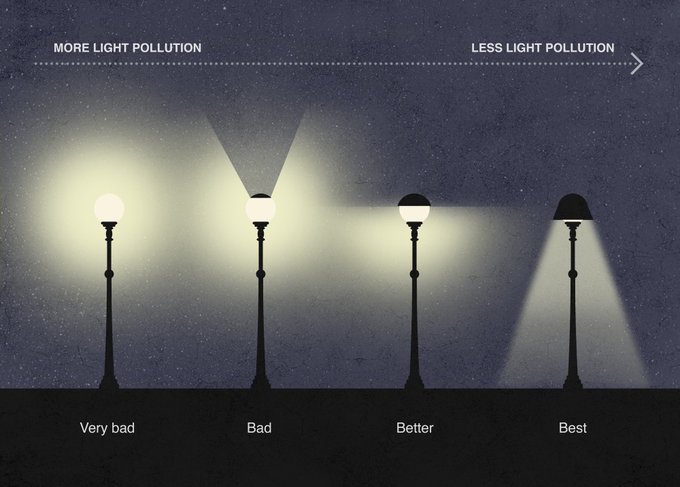
Light pollution reducing design
This graphic nails a big marketing truth: focus your energy where it actually matters. Just like a streetlight shines brighter...
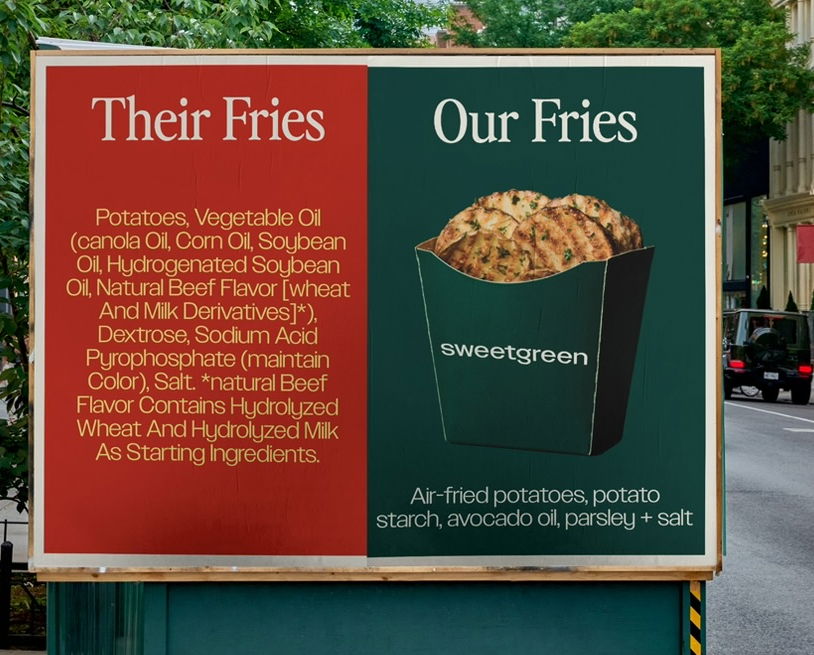
Sweetgreen Fries Ingredients (Us -vs- Them) Ad
A billboard split in half. One side crammed with hard-to-pronounce chemicals. The other? Just five clean, simple ingredients next to...
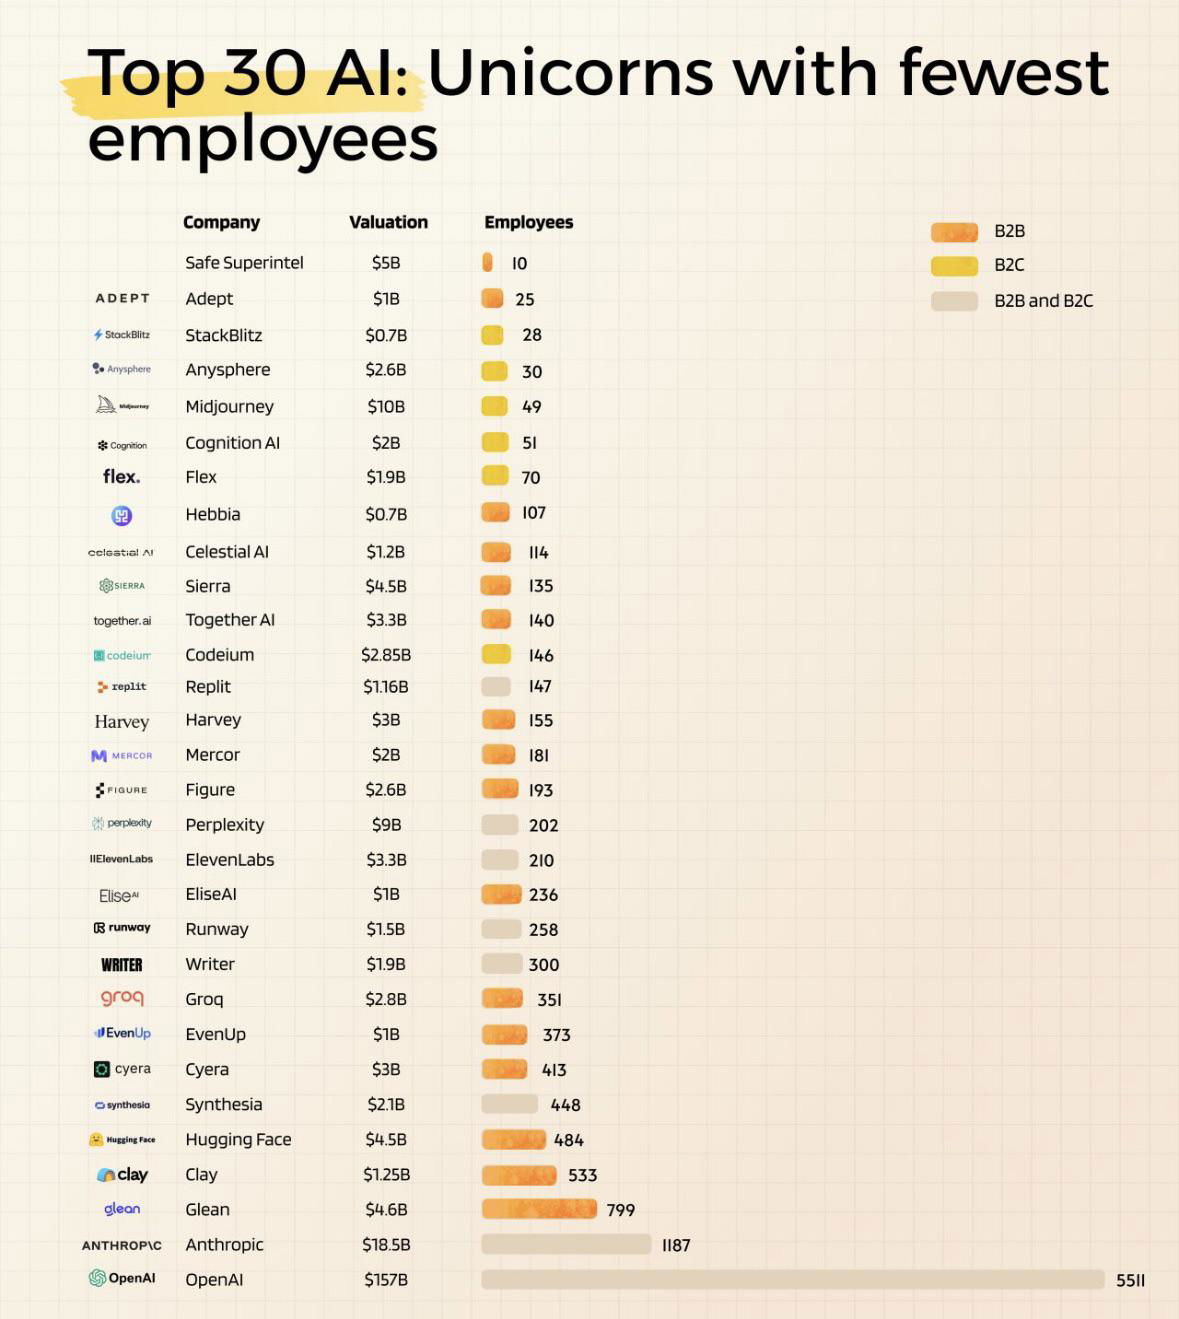
AI unicorn companies with fewest employees
This chart shows something wild: AI companies worth billions, with fewer humans than a local diner. Safe Superintelligent is worth...
Amazon dropshippers getting squeeze out?
The glory days of easy Amazon drop shipping are fading. Fees are up, competition is fierce, and customers want fast,...
$100,00 reach out tactic we design for our clients
Most people think direct mail is dead. But the best marketers know it’s a secret weapon for landing big clients...
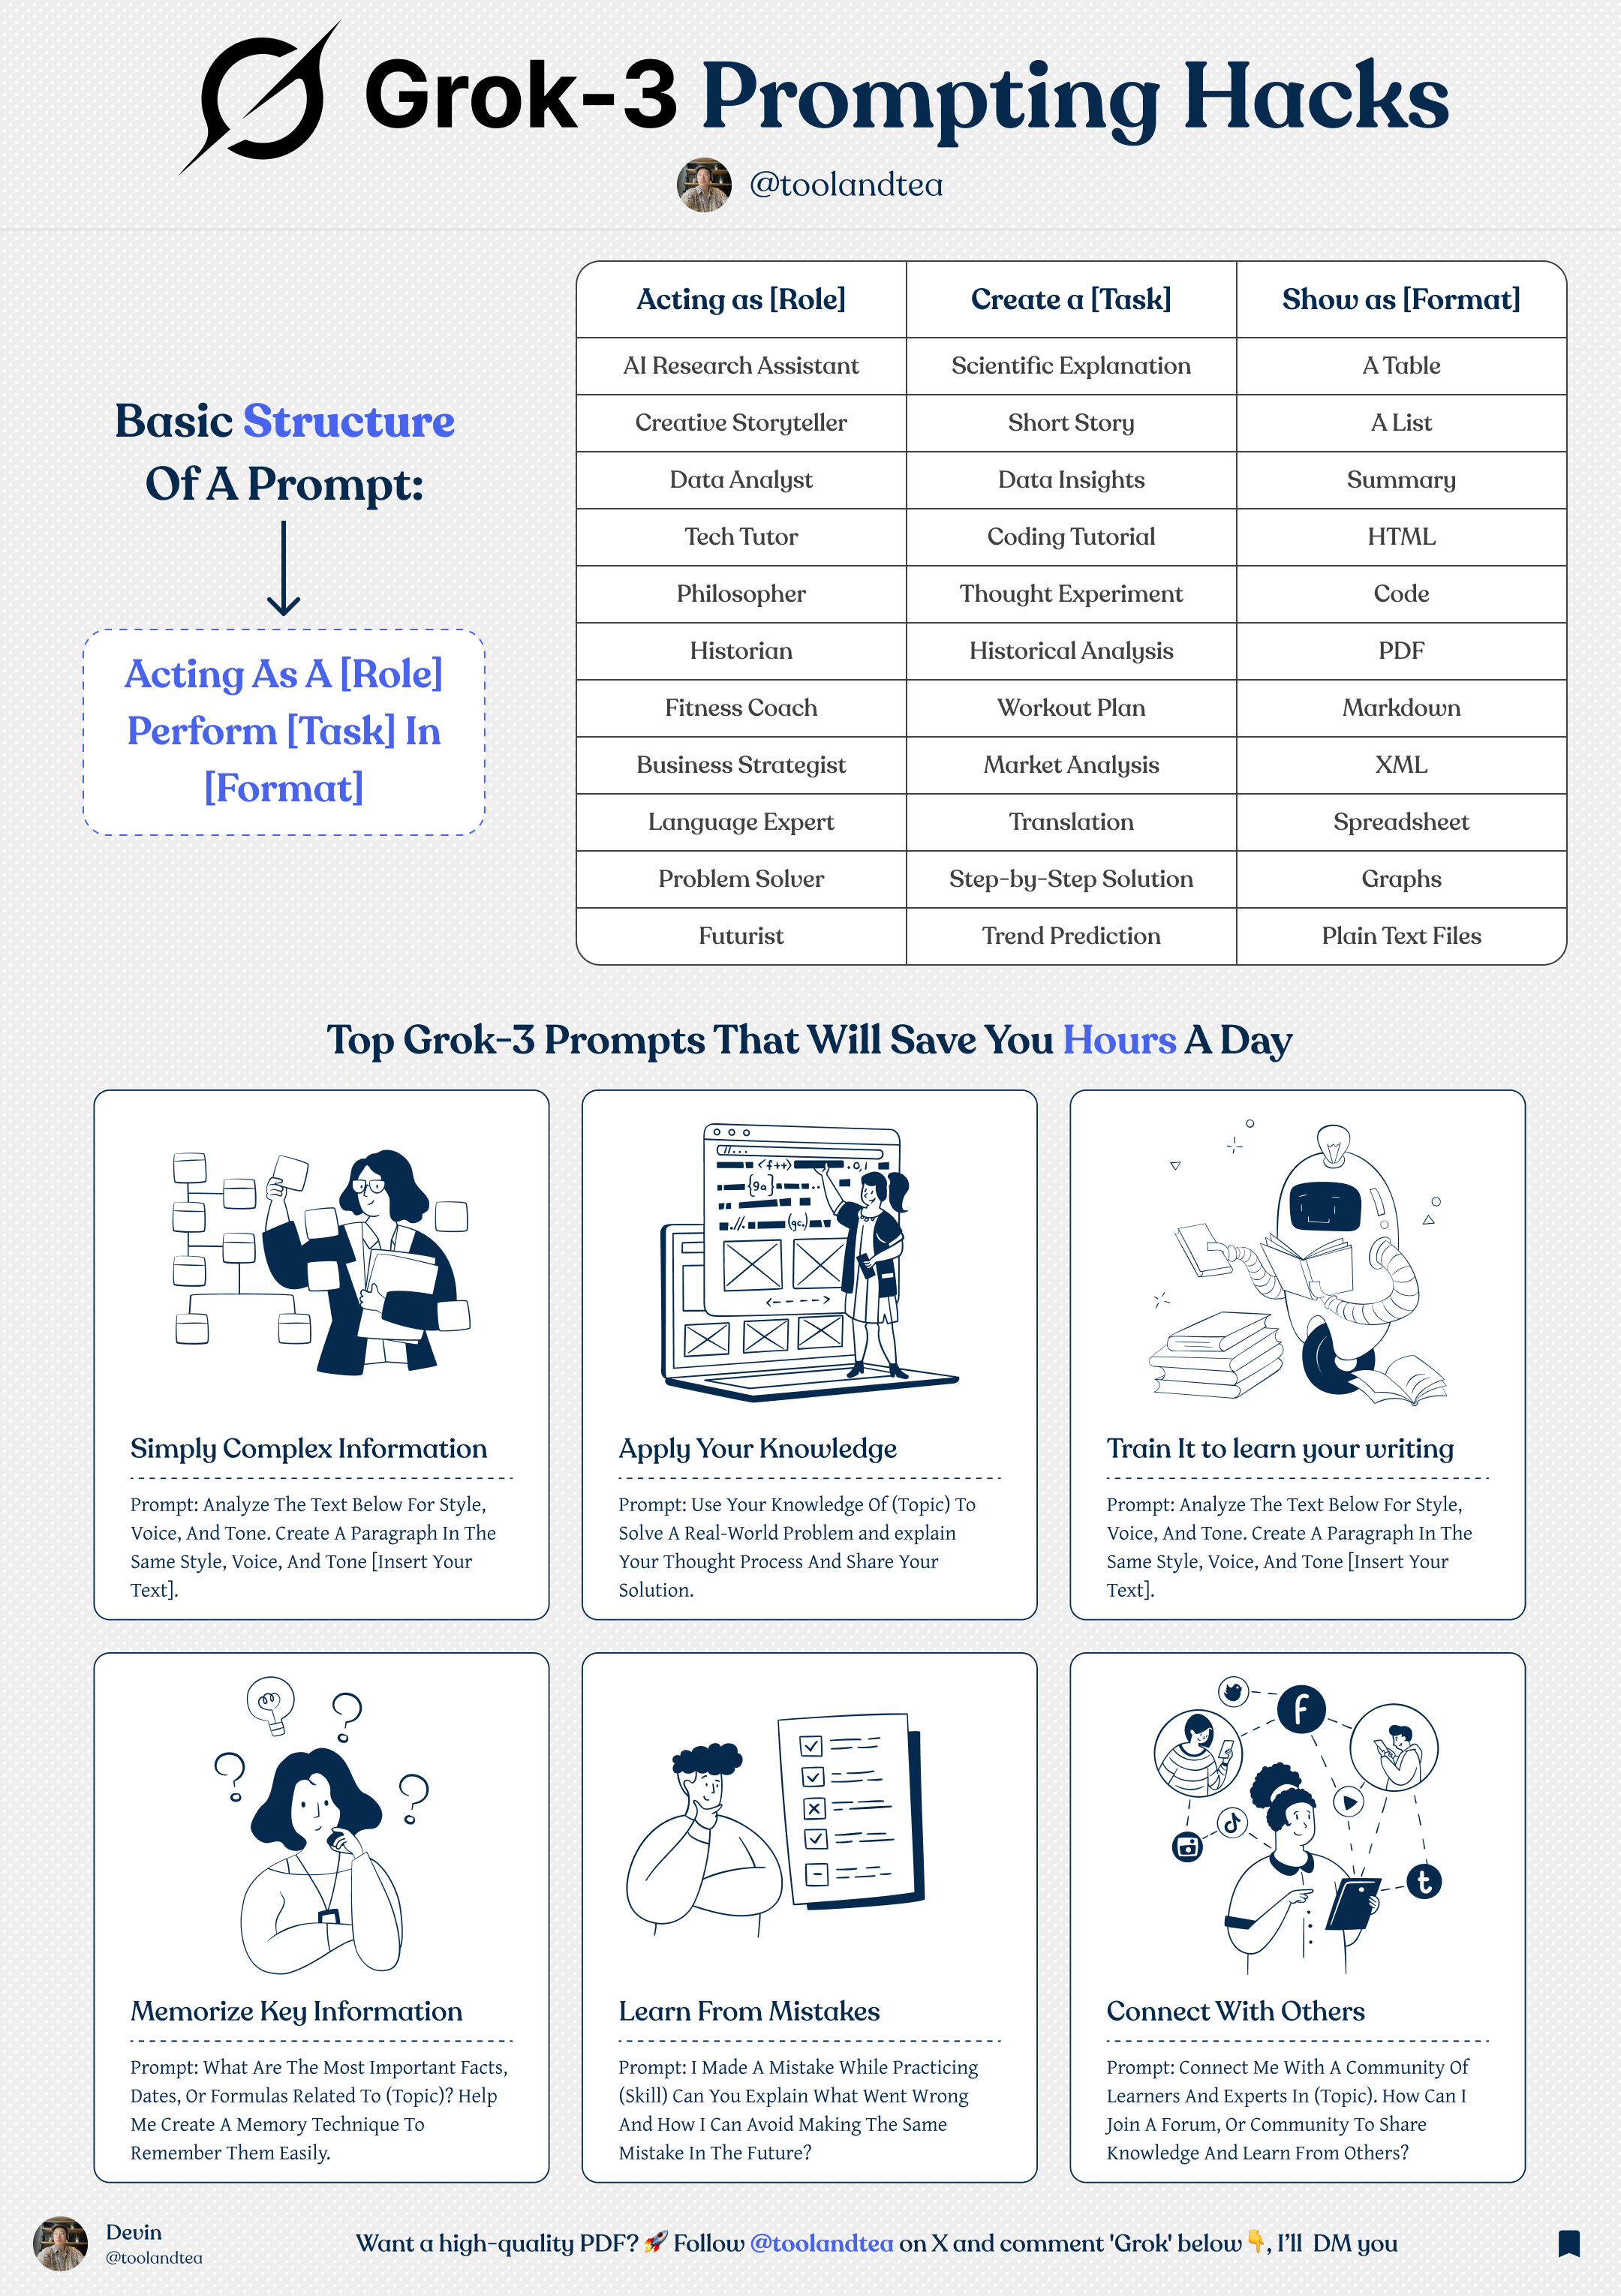
Grok 3 AI Prompting Hacks
Want better answers from ChatGPT (or any LLM)? Use this simple prompt formula from @toolandtea’s visual guide: Acting as [Role],...
Only few people knew that AI can do this
Ever waste hours digging through boring research papers? Nev shows how AI can chew through them for you and spit...
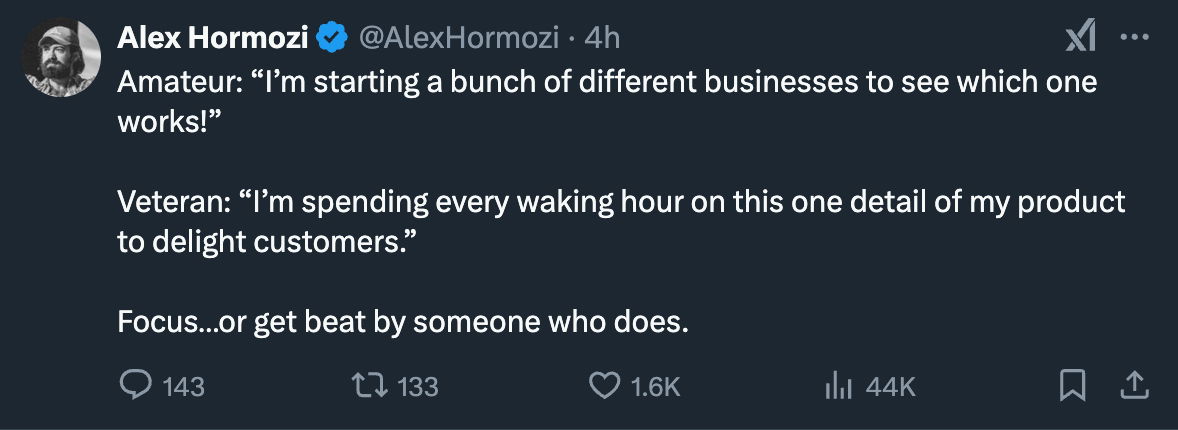
Amateur vs Perfecting the Product
Alex Hormozi nails it here: amateurs chase shiny objects, veterans chase better products. The tweet highlights a core truth—success often...
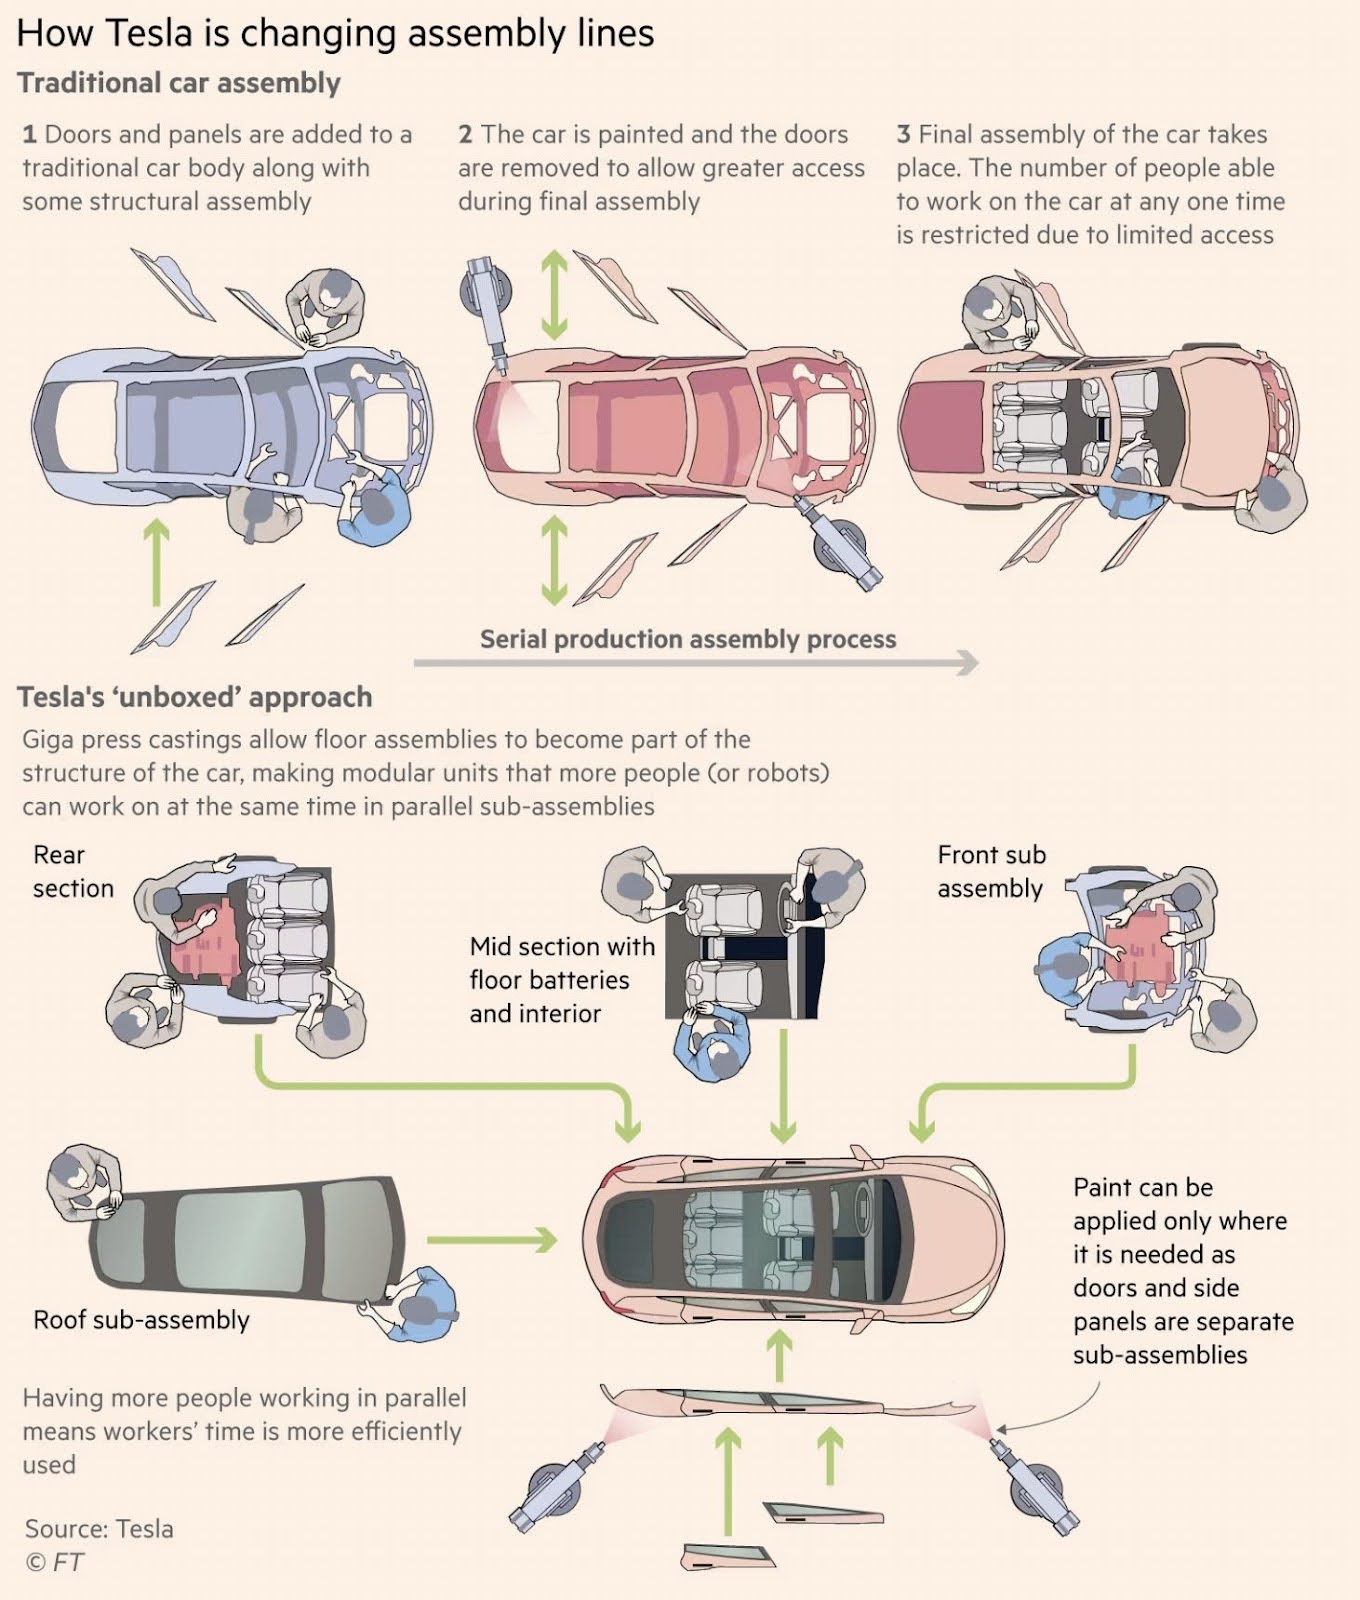
How Tesla is changing assembly lines
Tesla took apart the car assembly line like a marketer revamping a funnel. The traditional car build is a long...

Cybertruck advertising for roofind company
Spotted in Houston: a Tesla Cybertruck wrapped in bold red “Soto’s Roofing & Supply” branding. It’s not just a truck—it’s...
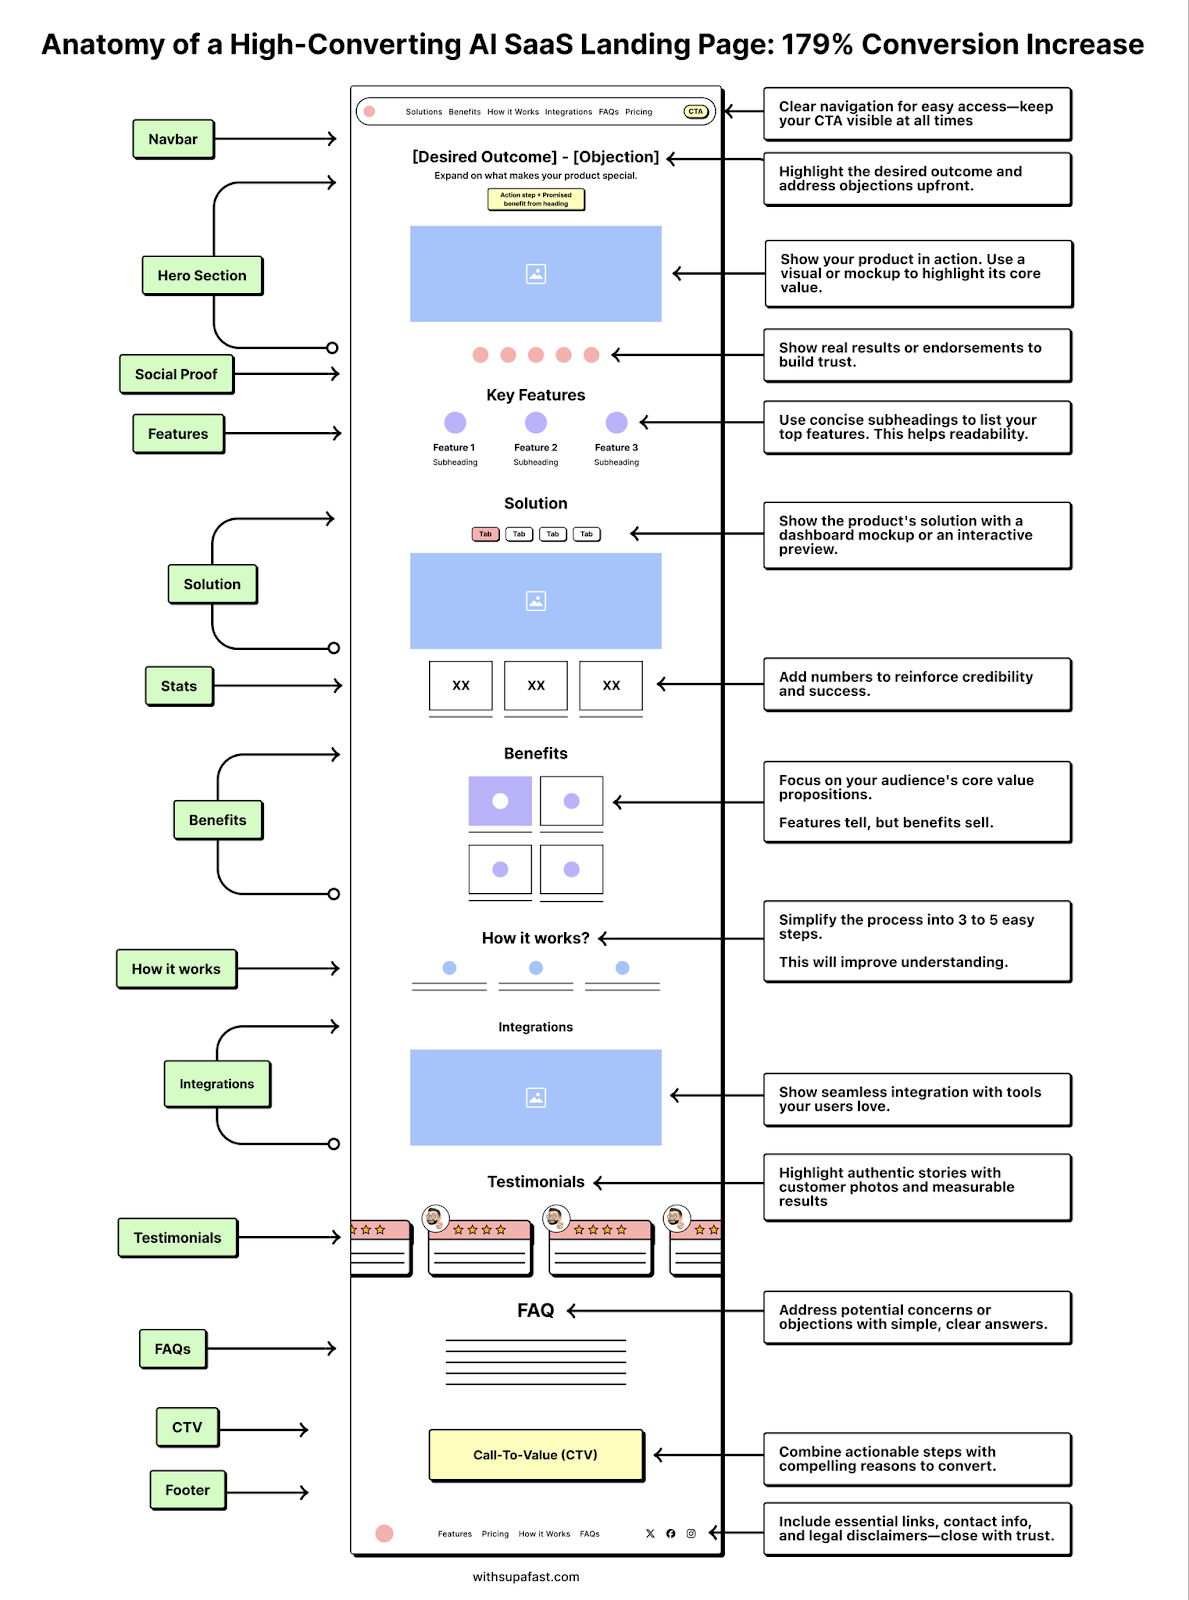
Anatomy of an AI SaaS Landing page
This landing page teardown maps every move that took a SaaS company from “okay” to “wow” — a 179% conversion...
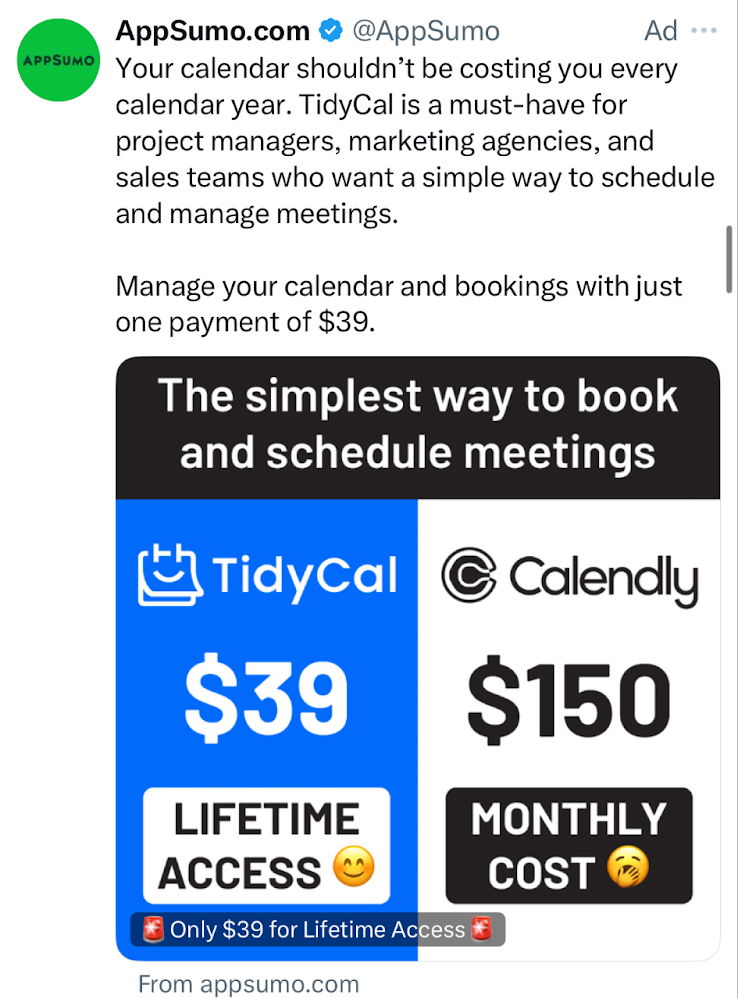
AppSumo calendar savings ad.
AppSumo nails it with this ad for TidyCal. One image. Two prices. Instant gut reaction: “Why pay more?” It’s a...

The intersection of copywriting, design, and development
Great landing pages don’t just look good or sound clever — they work. And this diagram nails it: copywriting, design,...
What Tesla's train Full Self Driving (FSD) on
Tesla cars are like self-learning marketers. They record everything, feed it into a giant brain, and get smarter over time....
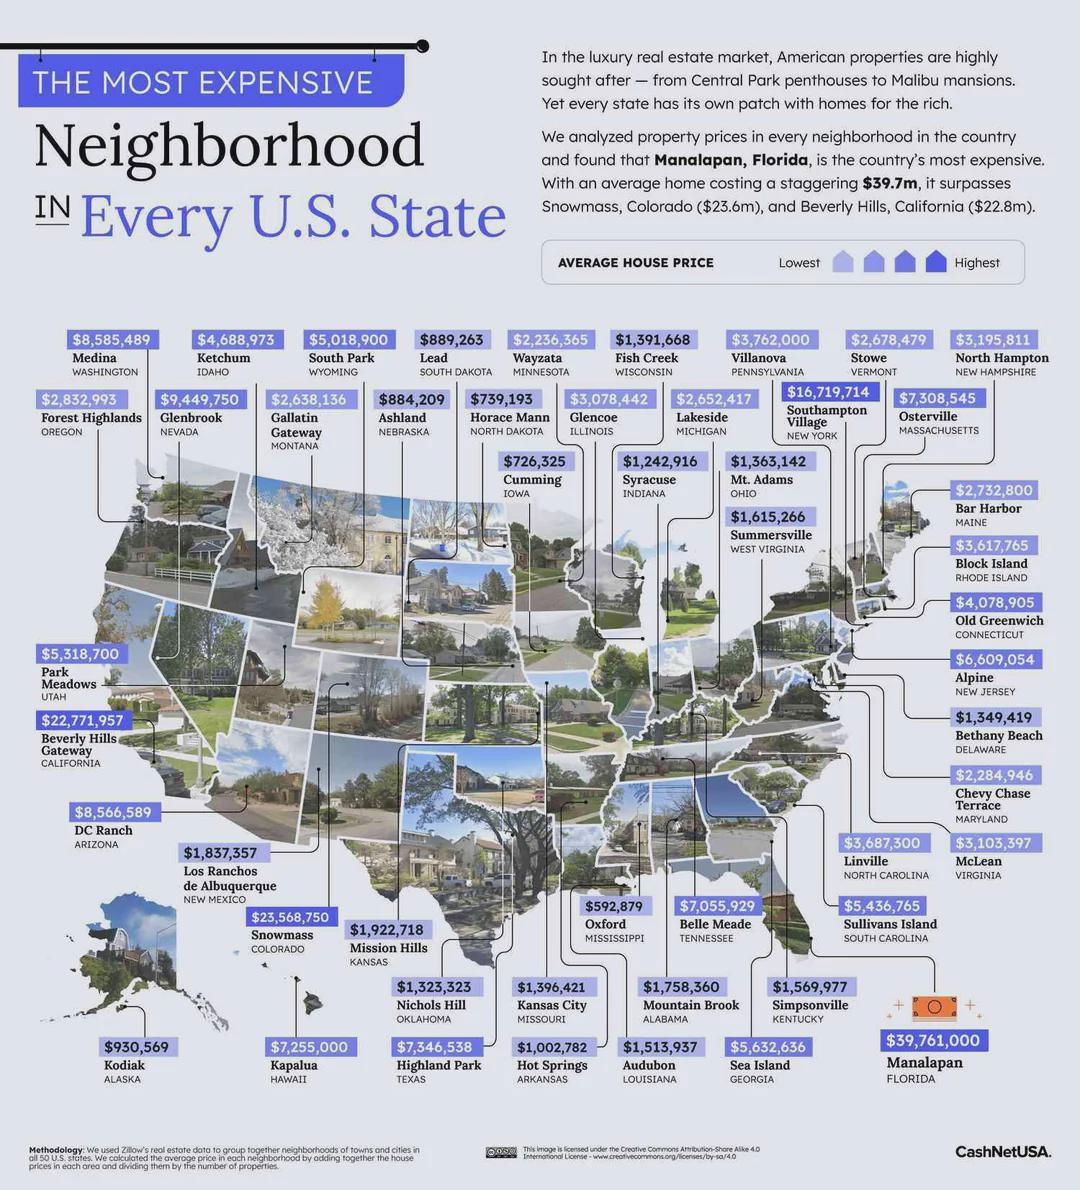
Most expensive neighborhood in each state
A plain spreadsheet of real estate prices is boring. But add photos, colors, and location labels, and suddenly you’ve got...
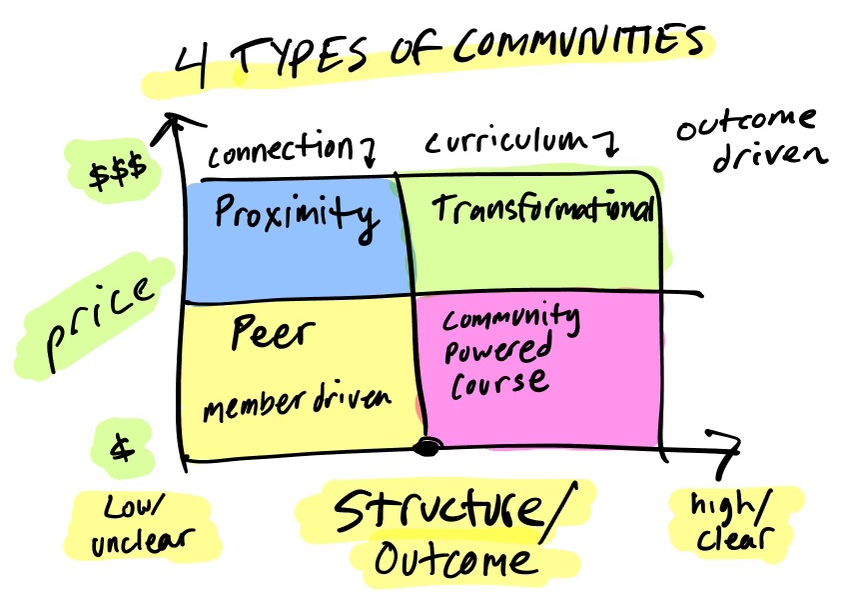
4 Types of Communities Chart
This chart by Jordan Godbey nails how community type drives price. Each quadrant shows how structure and connection change the...
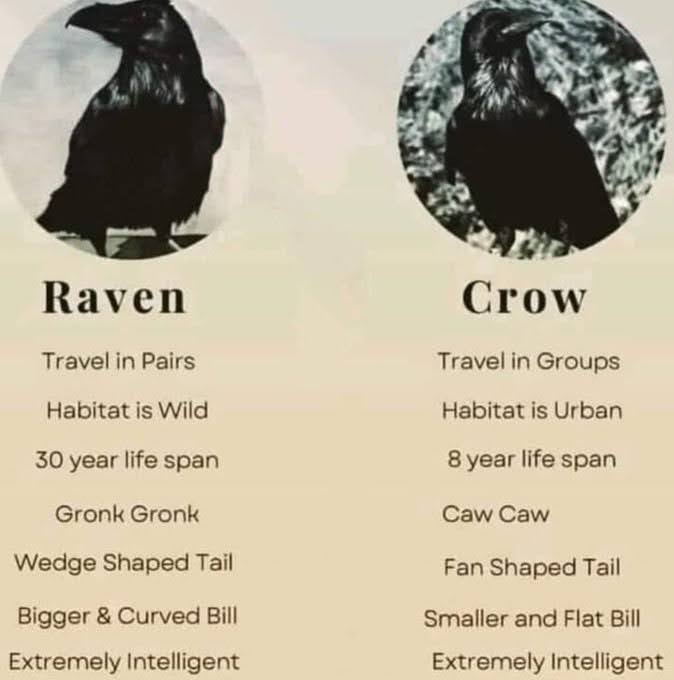
Raven or Crow cheat sheet
This Raven vs Crow image is a perfect example of how simple visual comparisons can teach complex info—fast. It’s short,...
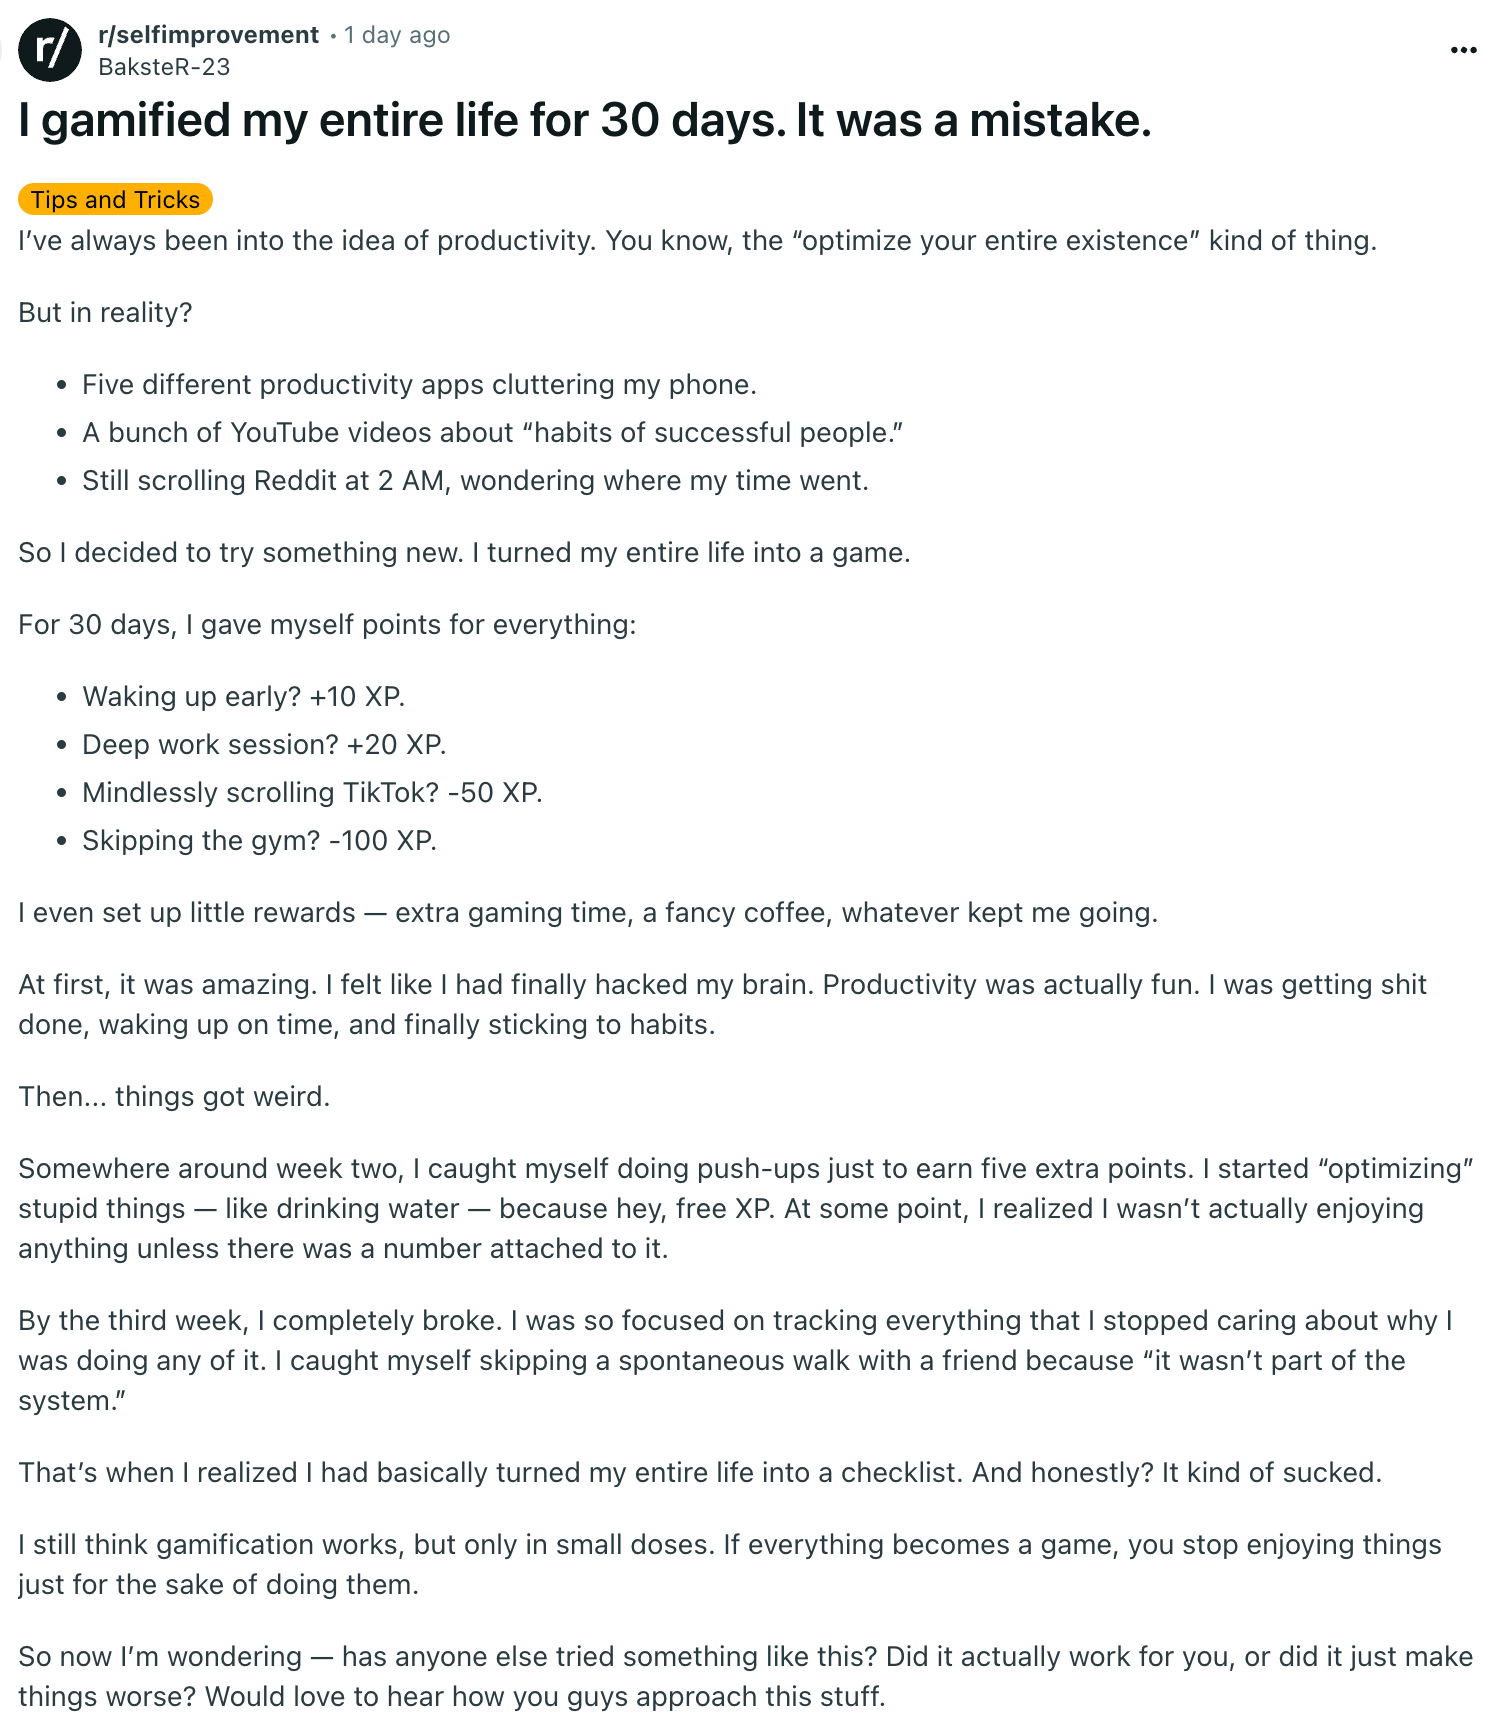
Gamify your life for productivity
This Redditor turned their life into a game. Every task earned or lost points: +10 for waking early, +20 for...