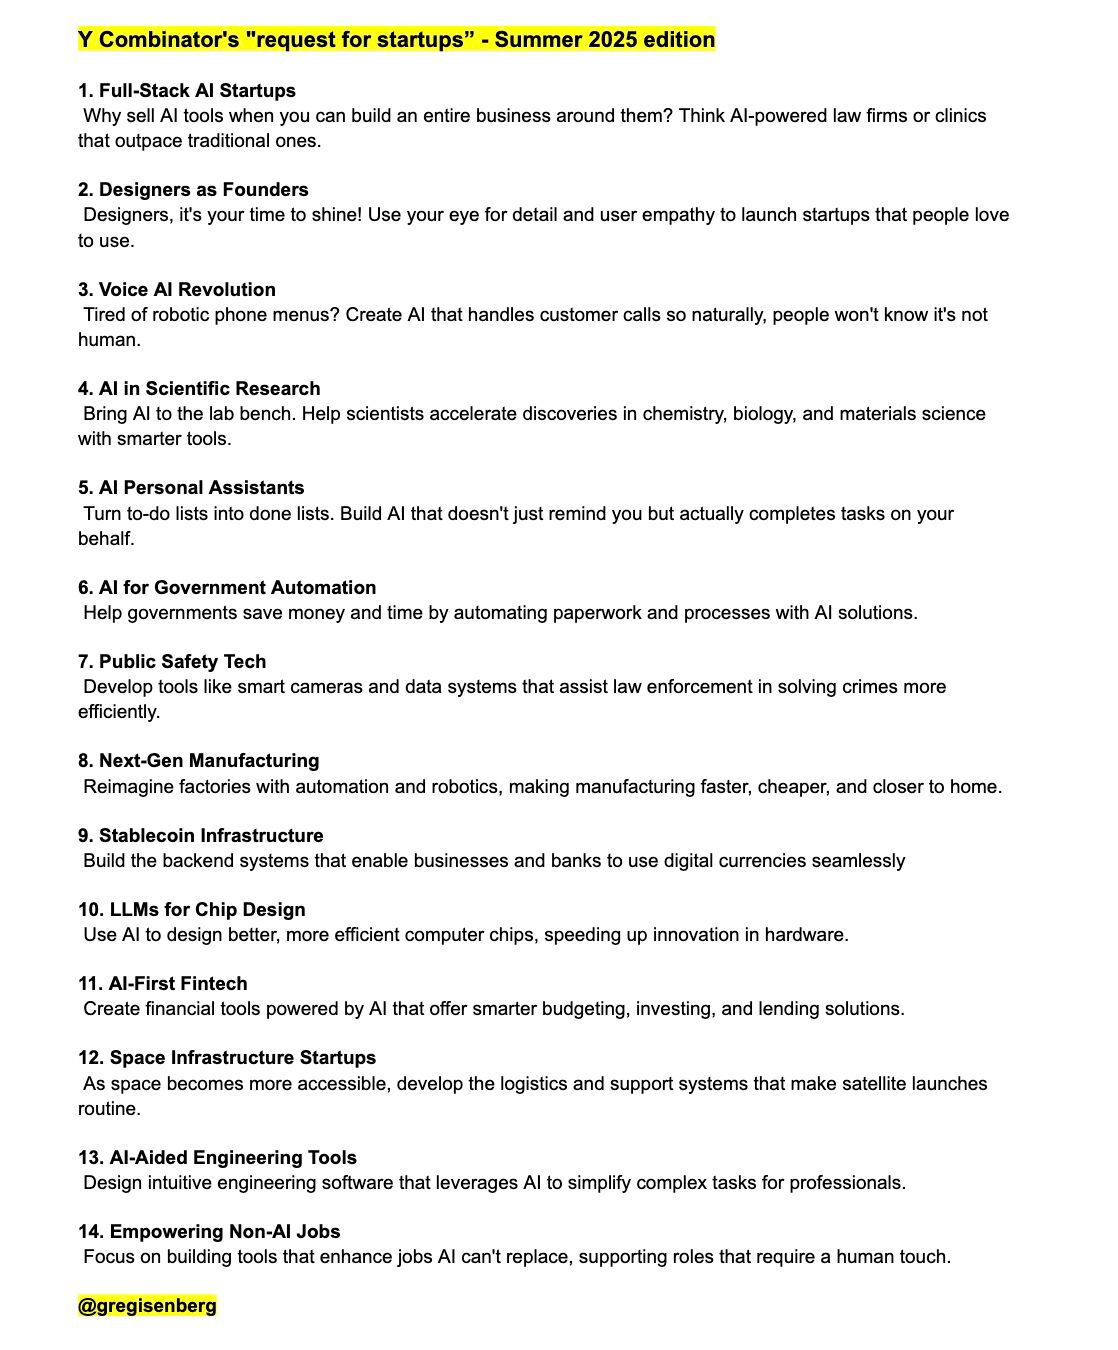
Y combinators investment wishlist 2025
Y Combinator just dropped their “Request for Startups” list, and the 2025 batch is all-in on one theme: AI that...
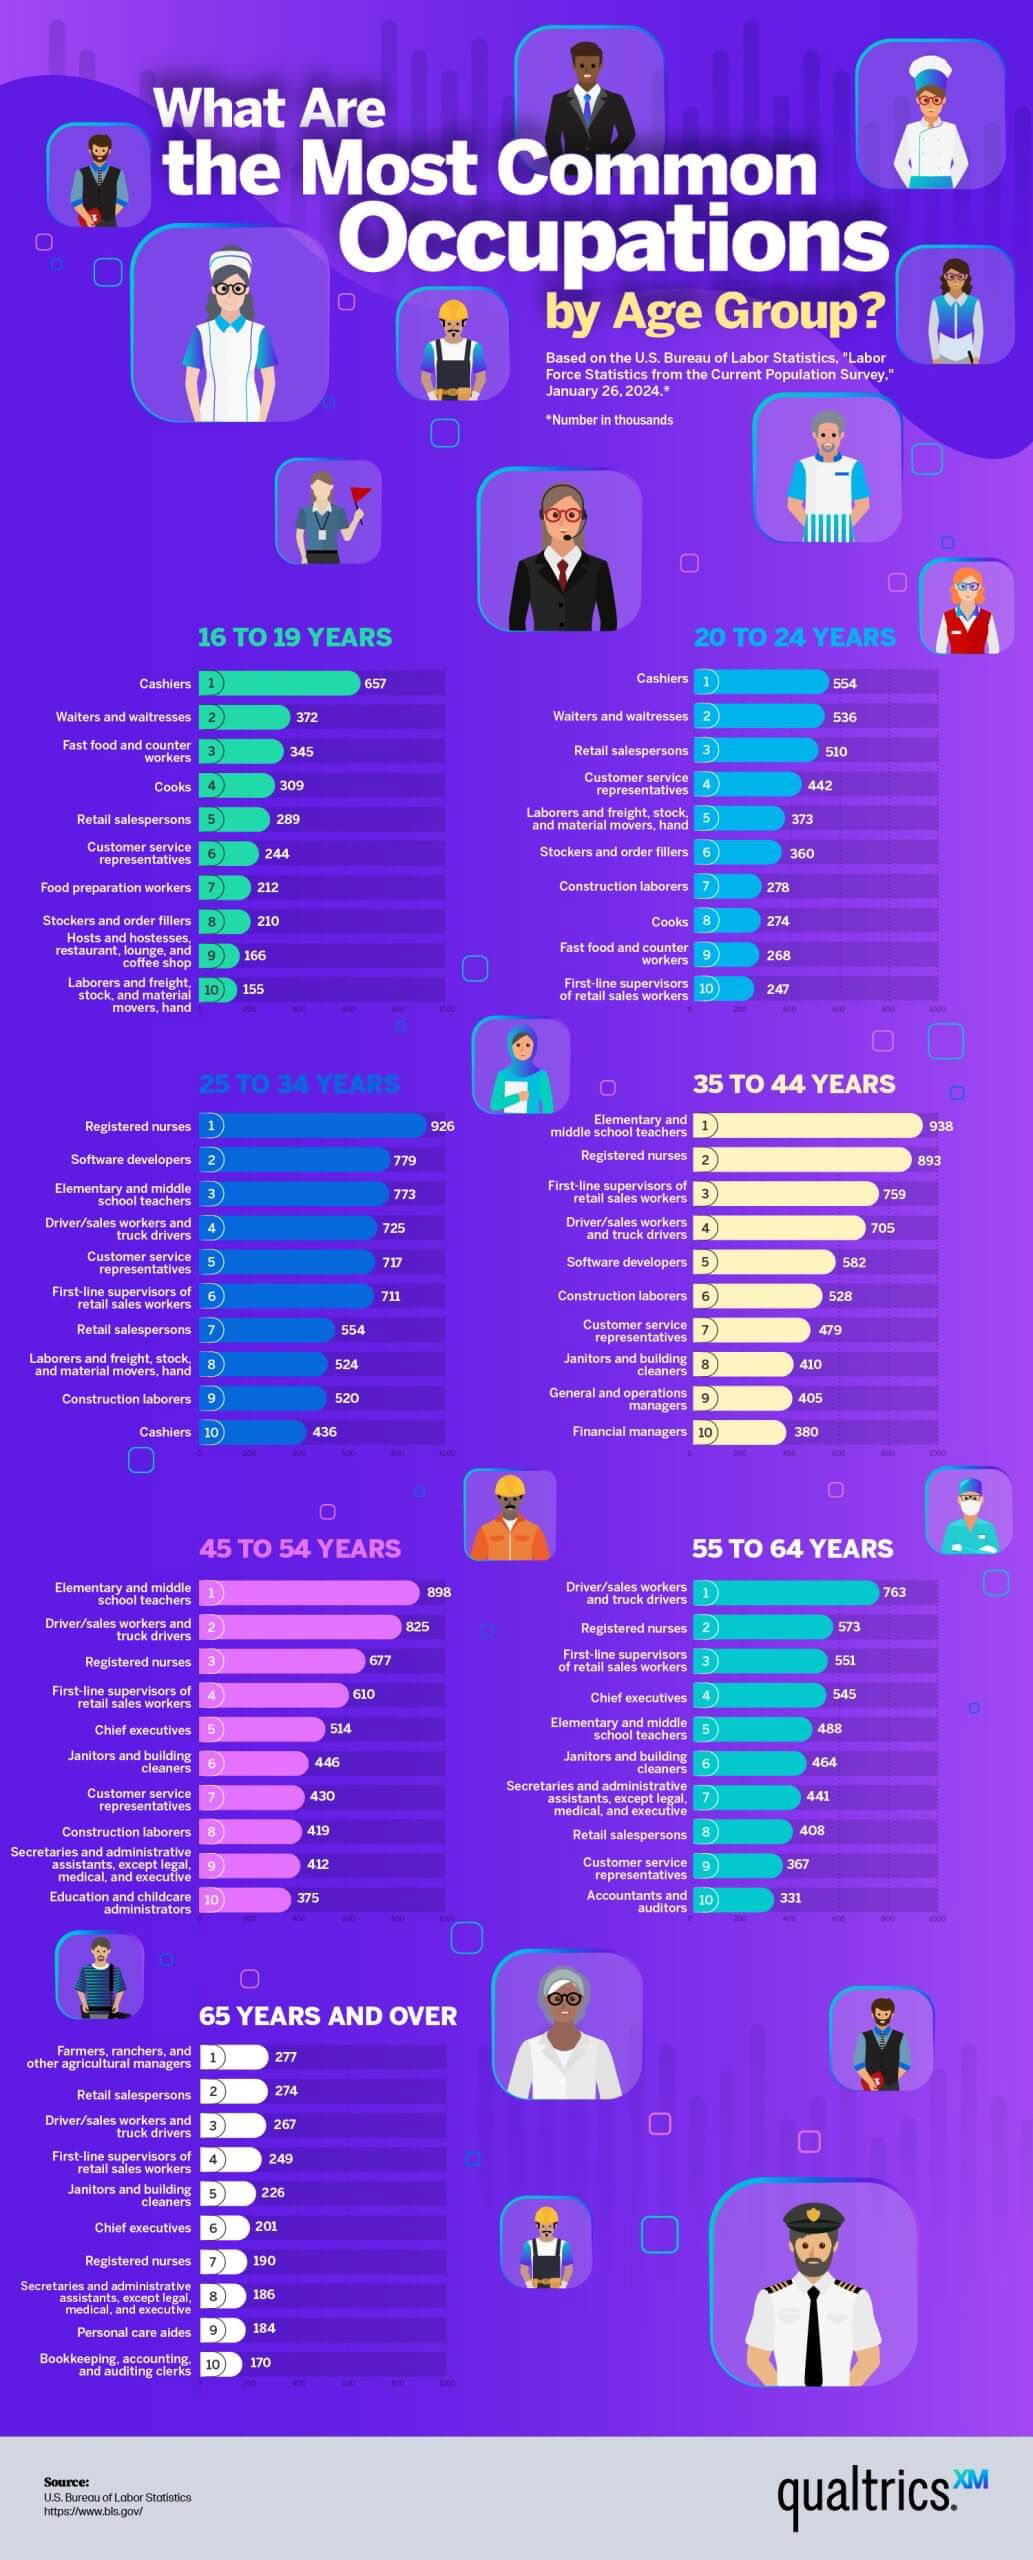
The most common jobs by age group graphic
This infographic from Qualtrics shows the most common jobs by age group. From teen cashiers to elderly farmers — it...
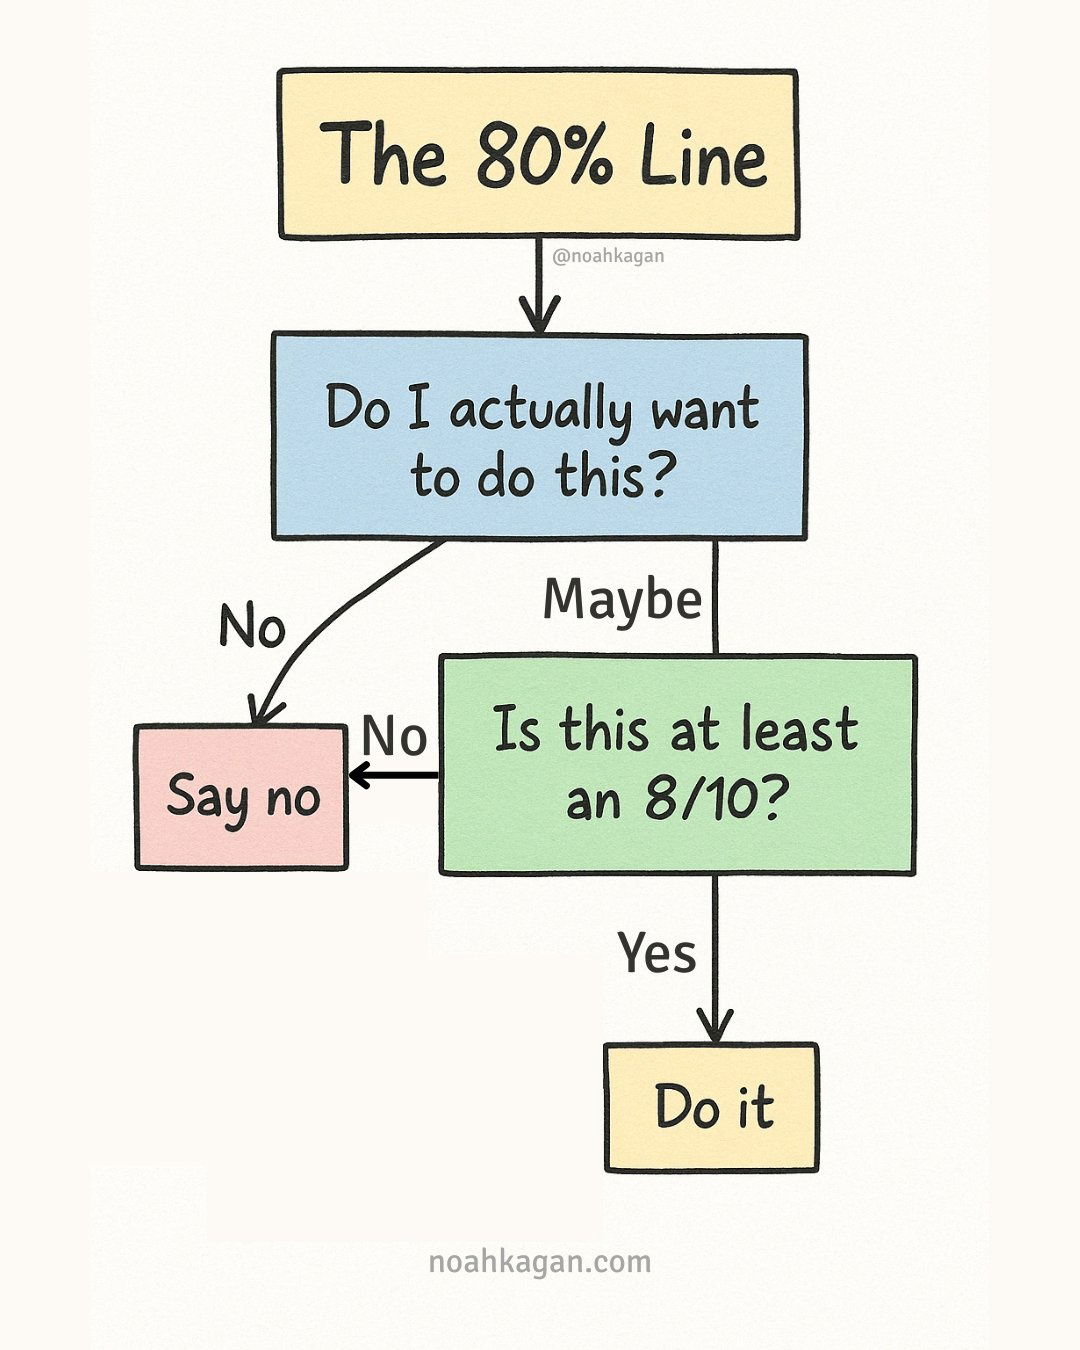
The 80% Line Test for Doing What You Actually Want
Ever say yes to something and instantly regret it? Enter Noah Kagan’s “80% Line” chart — a super simple way...
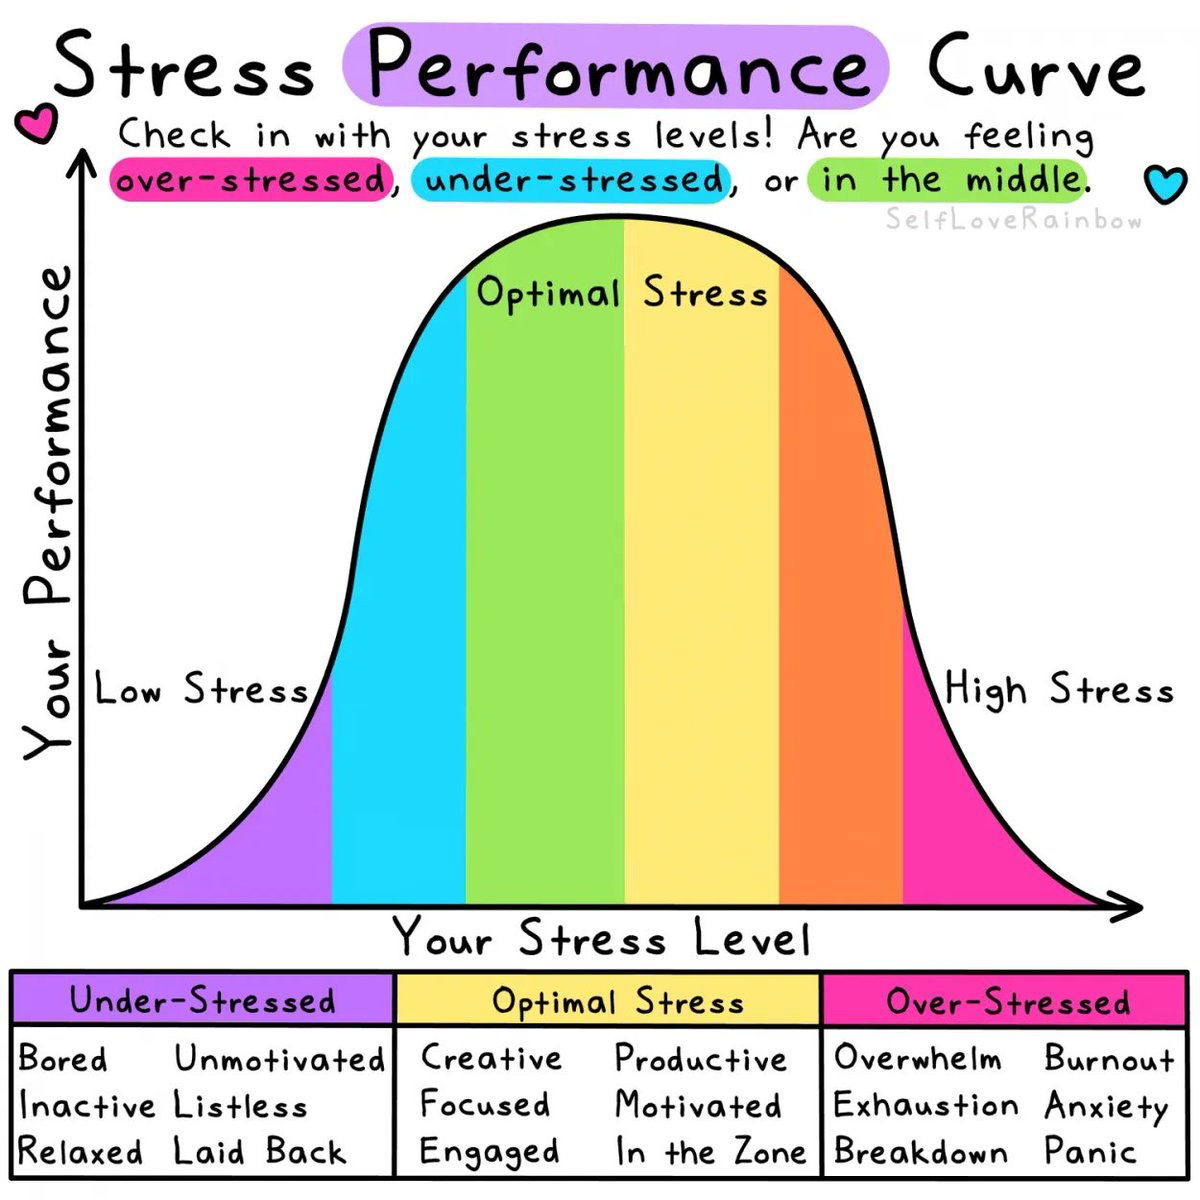
Stress Levels and Performance Curve
This chart nails something every marketer feels: stress can make or break performance. Too little, and you’re bored. Too much,...

Vitalik Buterin shows his personal focuses for 2025.
Vitalik Buterin just dropped his 2025 goals publicly. Not in a press release. Not hidden in a company update. Right...

Tropicana Orange Juice rebranding design failure.
Tropicana once swapped its classic orange-with-a-straw packaging for a minimalist glass of juice. The result? $30 million in lost sales....
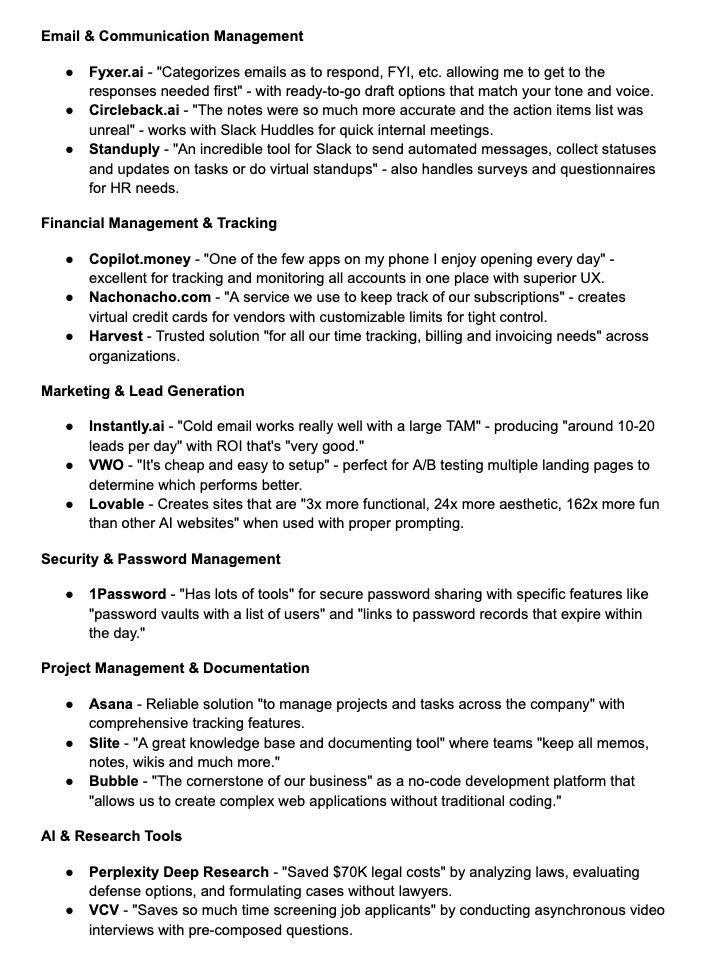
Tools and software recommendations made by founders and CEOs in Hampton
Ever wonder what kind of tools top founders actually use? This list from Hampton peeks into the operating stacks of...

Hilarious lose control ad
Omniconvert nailed attention with this ad. It uses a clever play on words about “losing control” — a phrase from...

Profit Margin by Industry List
Some industries are money-printing machines, others barely scrape by. The charts here show banks and finance companies with sky-high margins...

SwipeFile.com Email Signup Split Test
SwipeFile tested five versions of their email signup popup, and Version A crushed it with a massive 367% lift in...
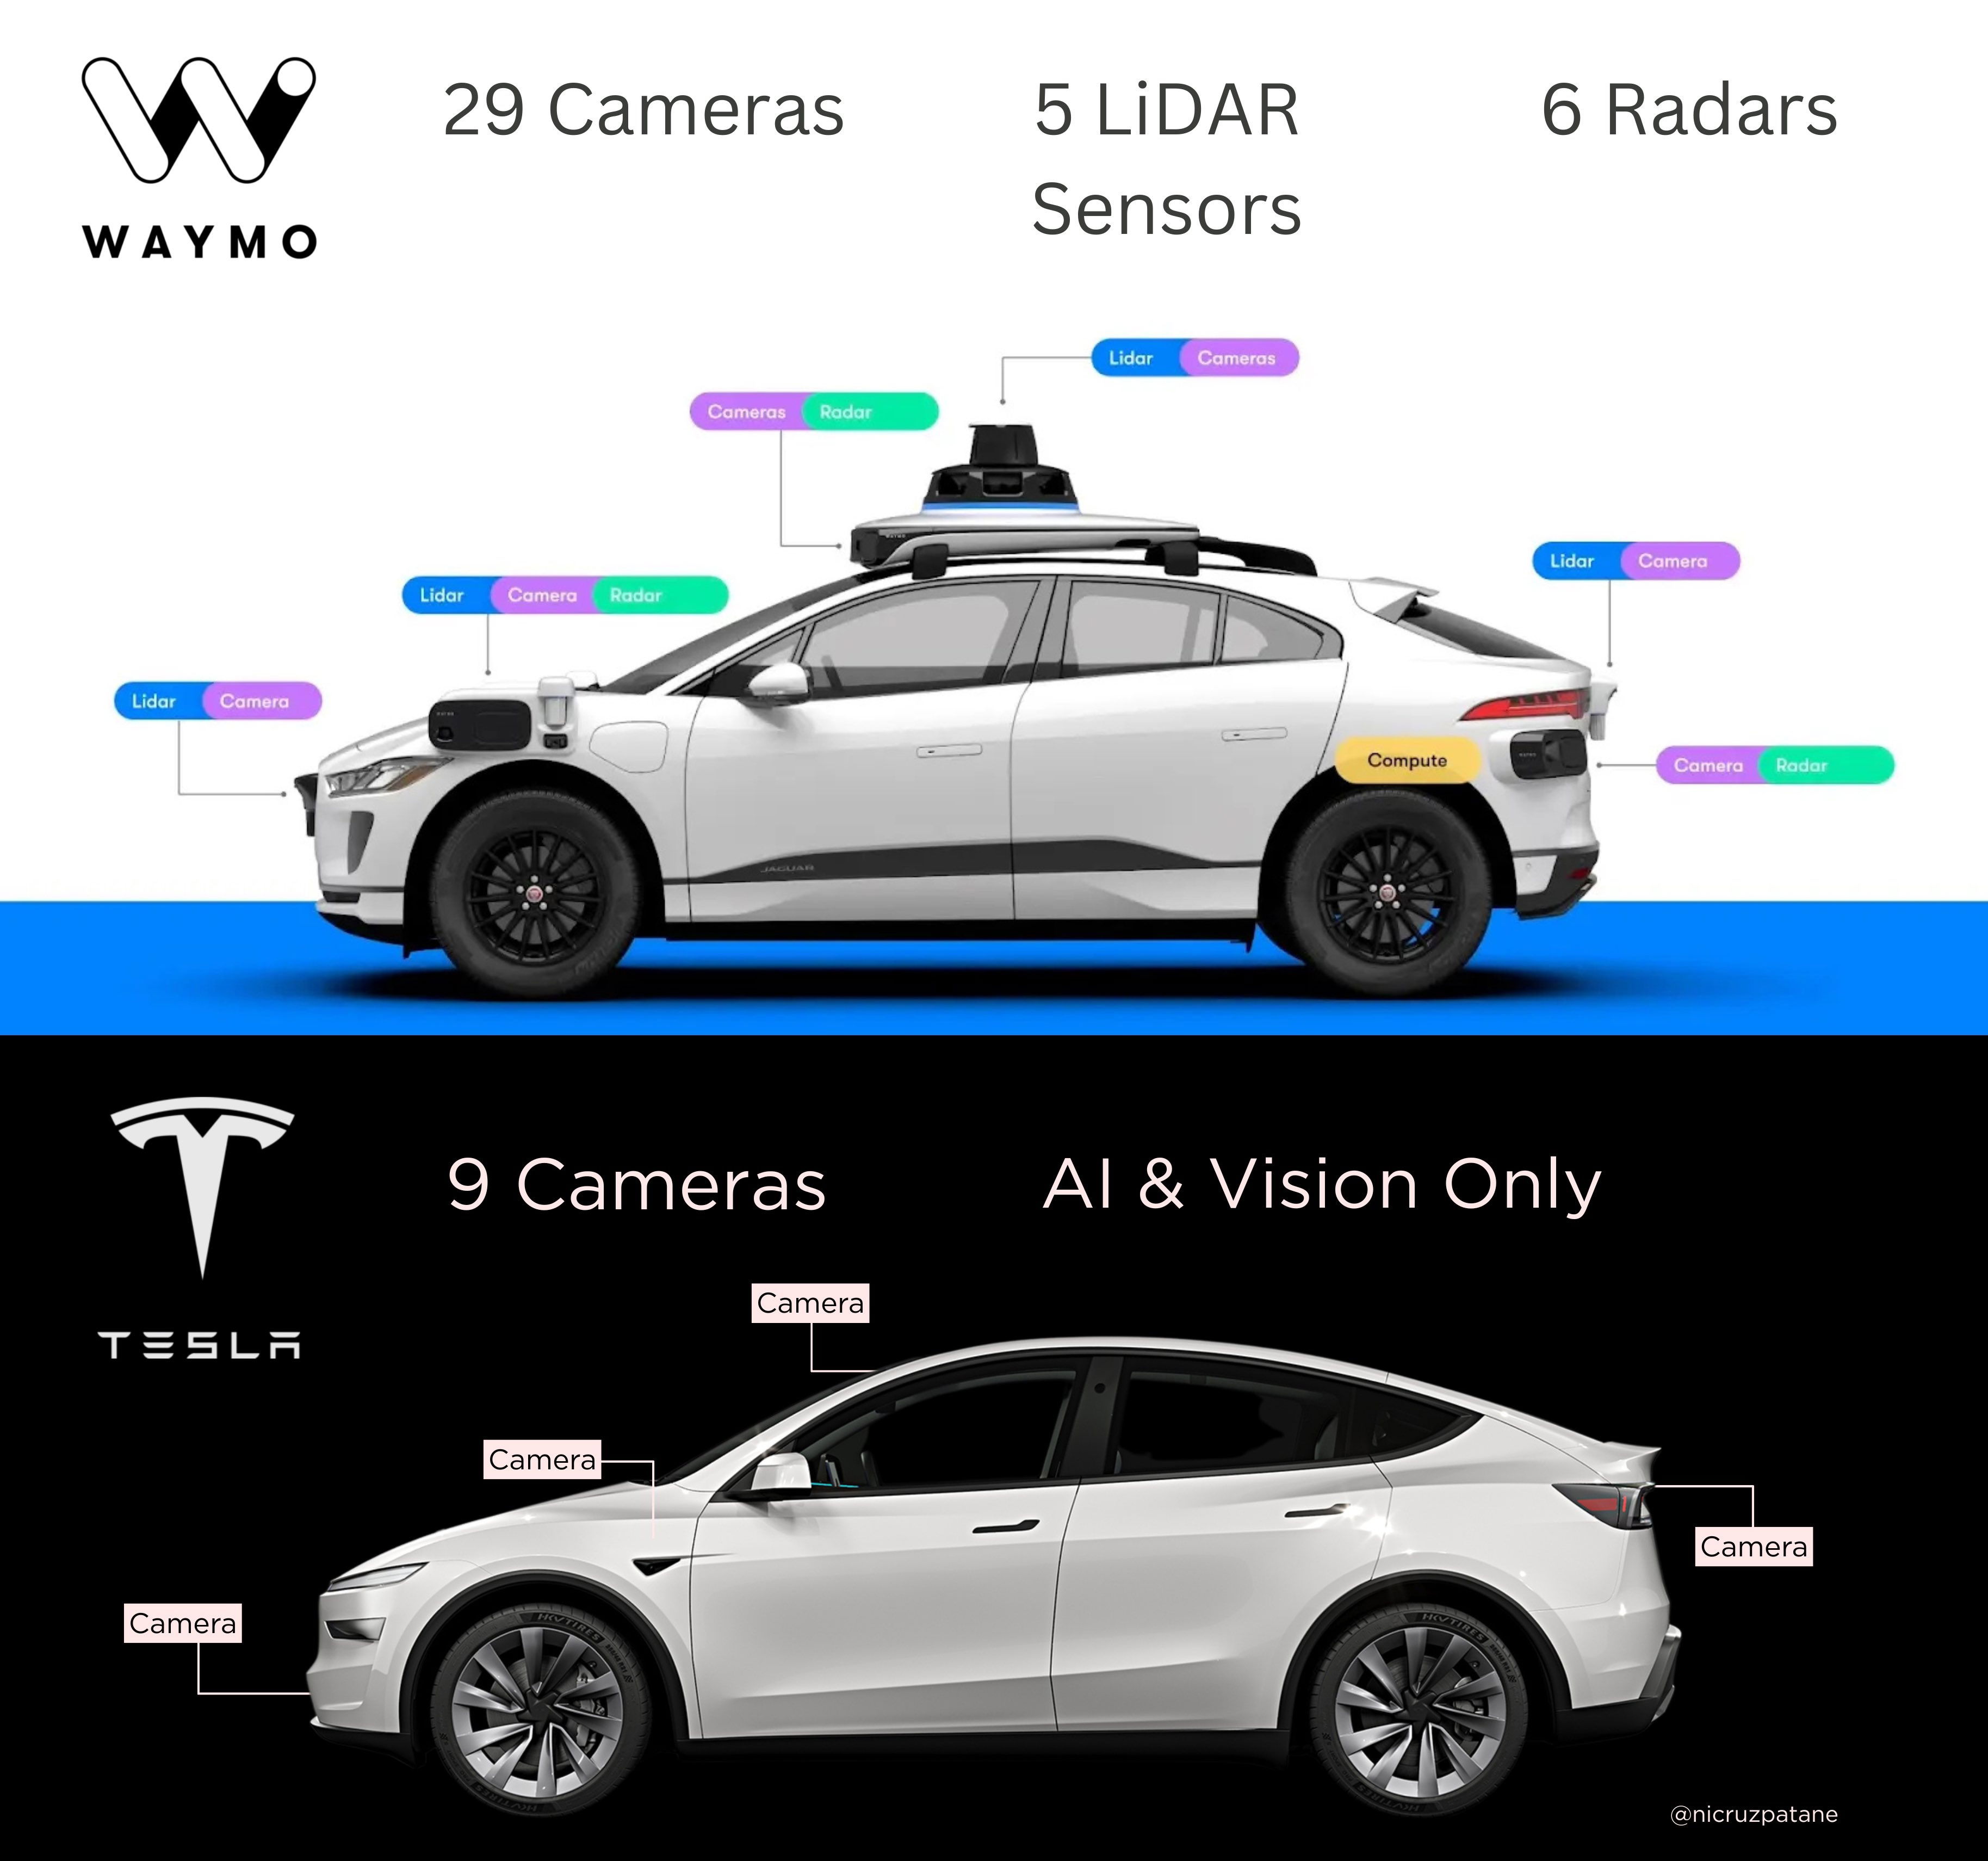
Waymo vs Tesla Sensor Suite
This side-by-side image of Tesla and Waymo tells a clear story: one bets on fewer sensors and smarter software, the...
Why You’re NOT Rich
Ever see someone blow up online and think, “Dang, they just got lucky!” Spoiler: they probably didn’t. They just did...
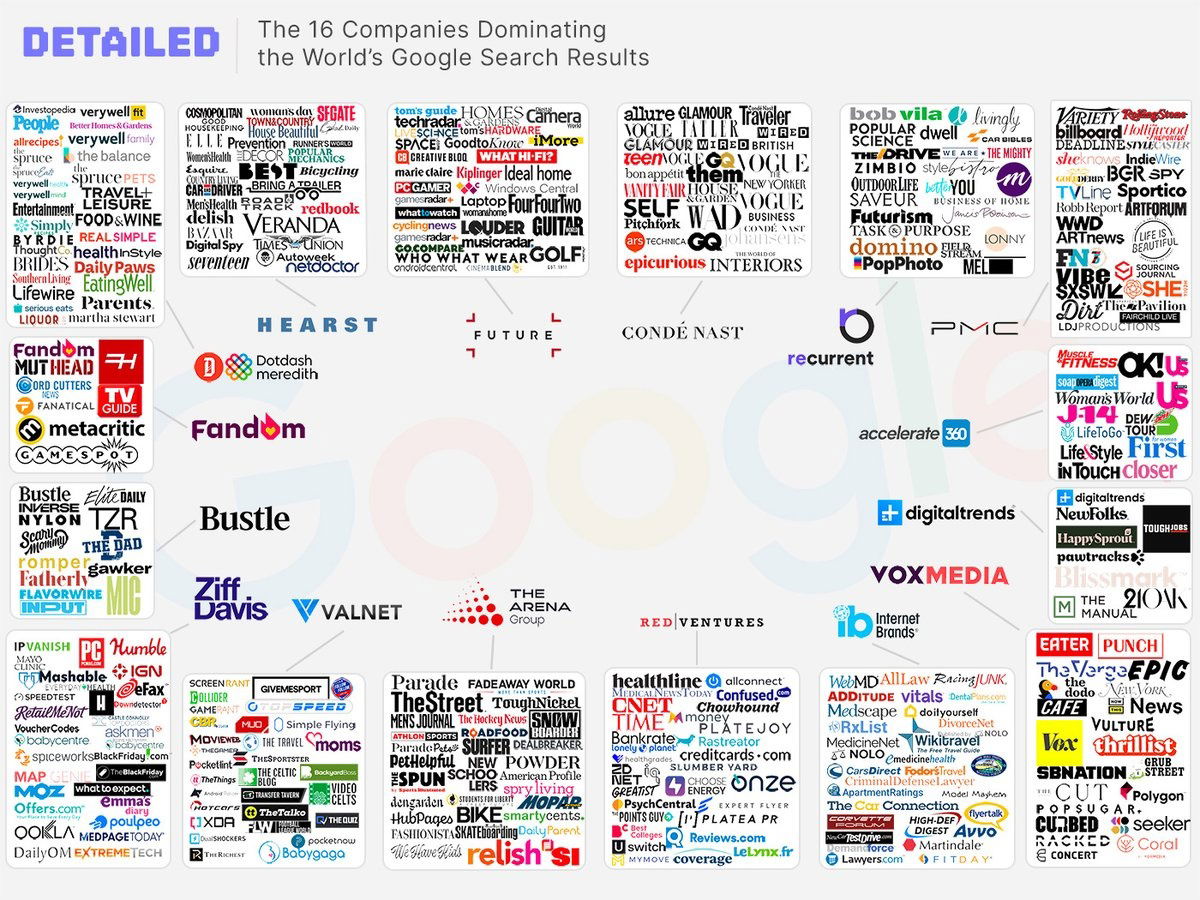
16 Companies That Dominate Google Search Results.
Take a look at this image. Sixteen giant media companies basically own your Google search results. What looks like hundreds...
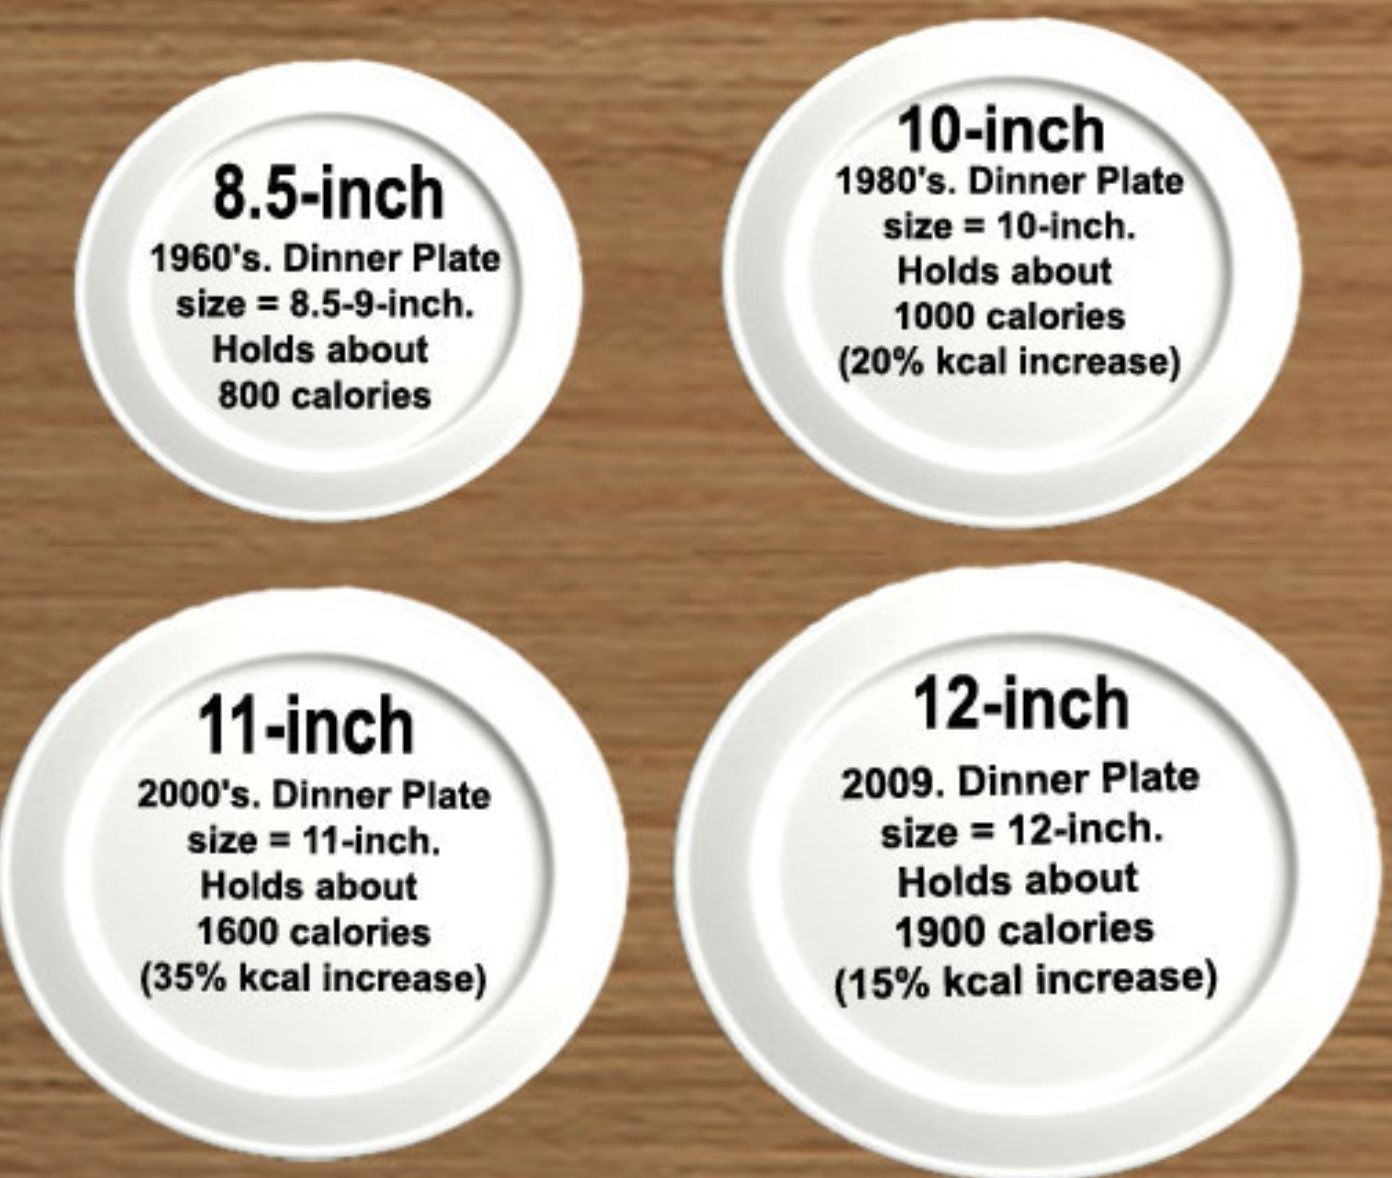
Dinner plate comparison sizes over the years
Look at this image: dinner plates have grown from 8.5 inches in the 1960s to 12 inches today. Calories nearly...
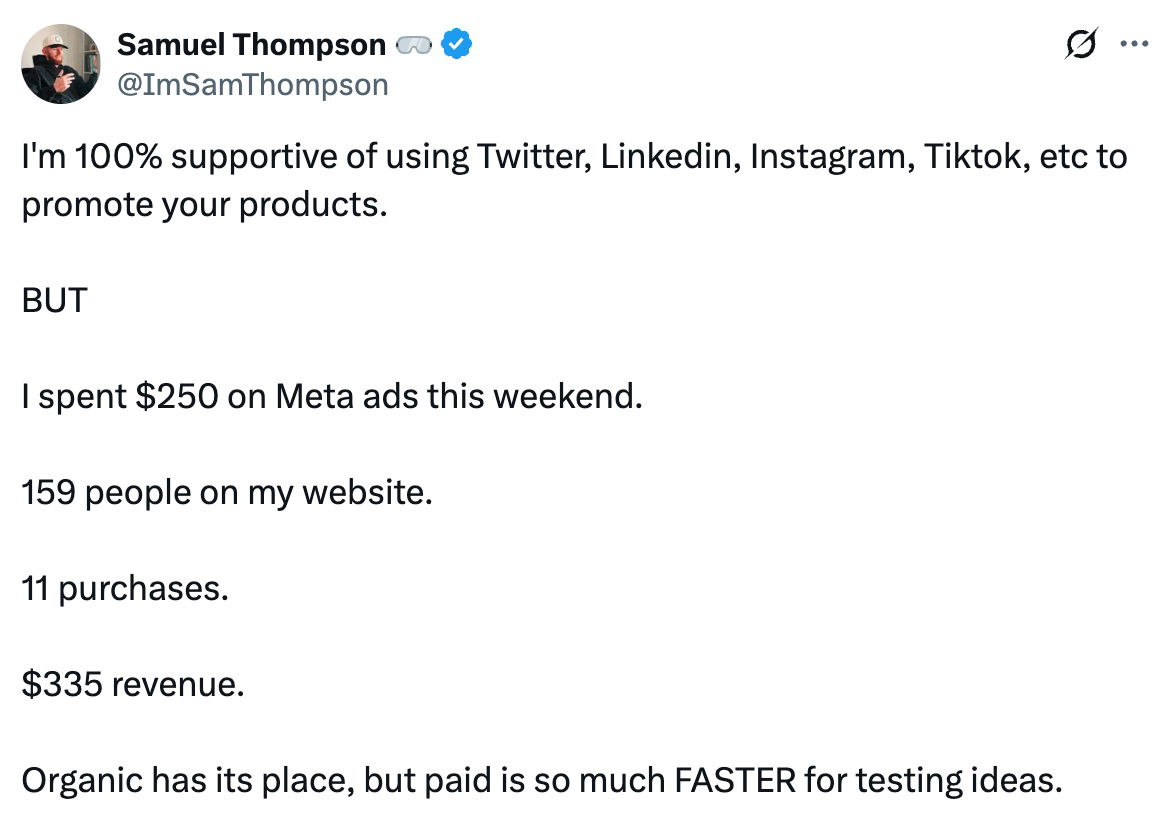
Sometimes paying for traffic is faster than organic
This tweet nails it: organic marketing builds a solid long game, but paid traffic is the speed hack for learning...
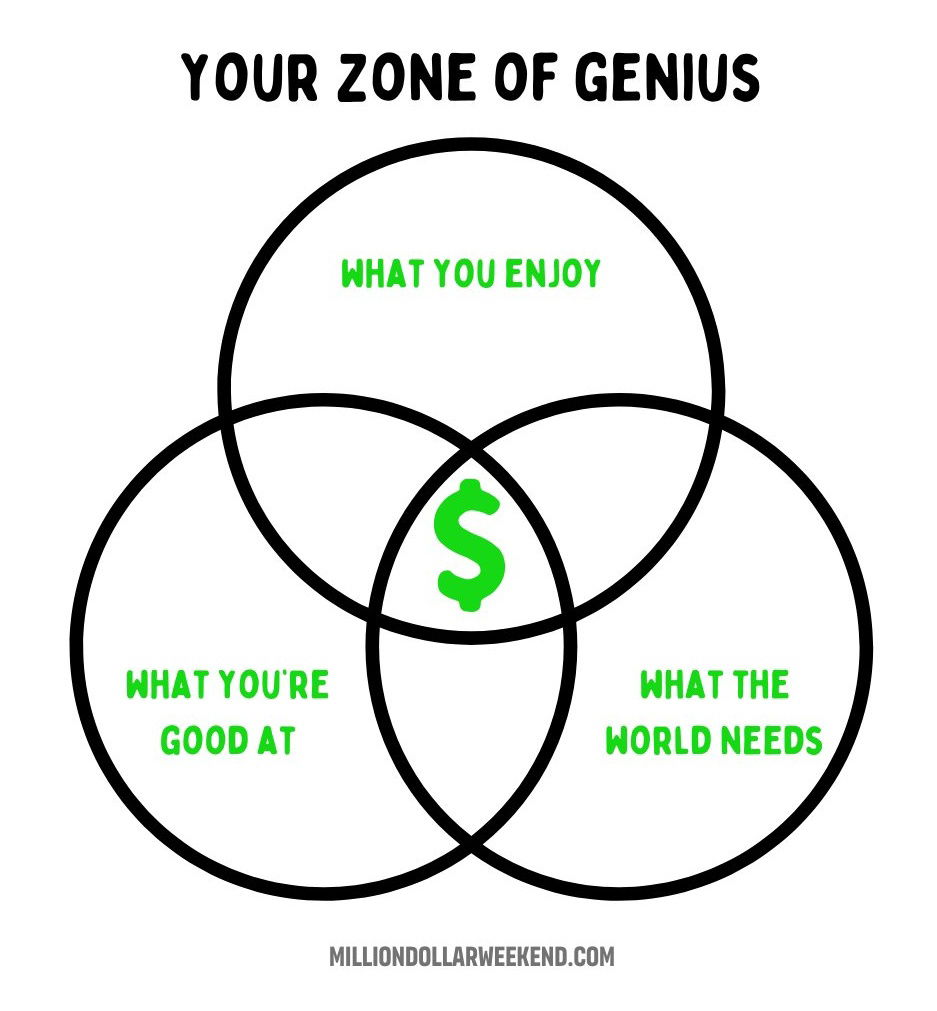
Your Zone of Genius Venn Diagram
Everyone's seen the Venn diagram showing where your passion, skills, and market demand overlap. That’s where money and meaning meet....

McDonald's Calories vs Real Food
This image nails a simple but powerful idea: what you think is “a little” can actually be a lot. Two...
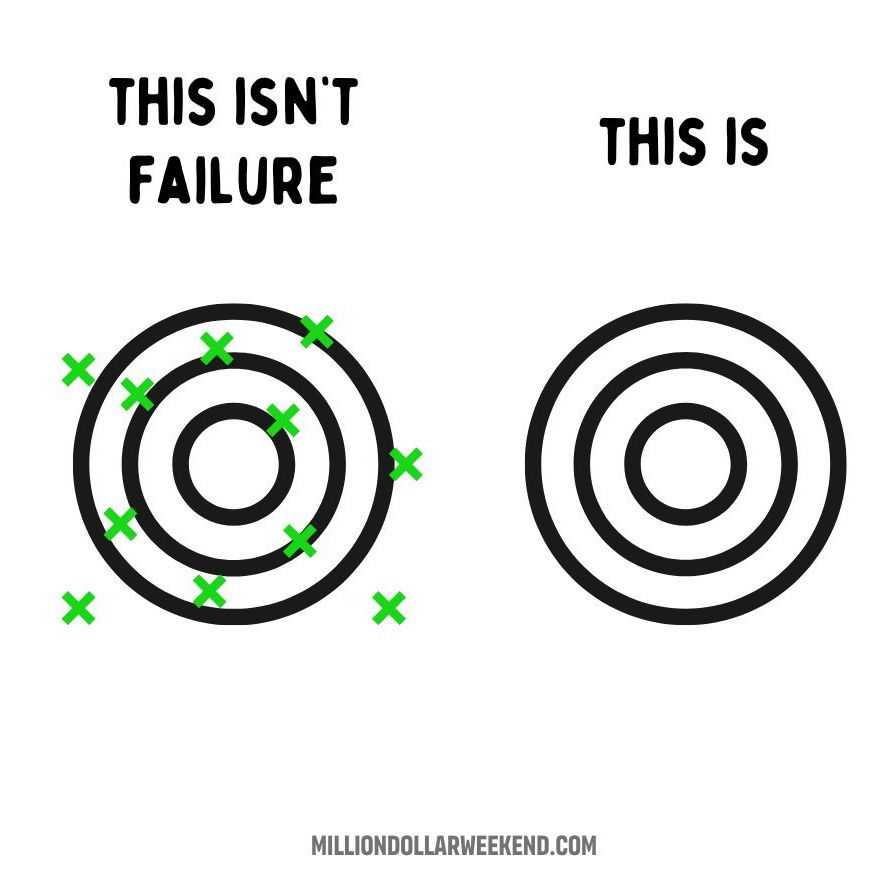
This isn't failure target illustration
This image nails a truth every marketer forgets sometimes: missing isn’t failing, not aiming is. On the left, you see...
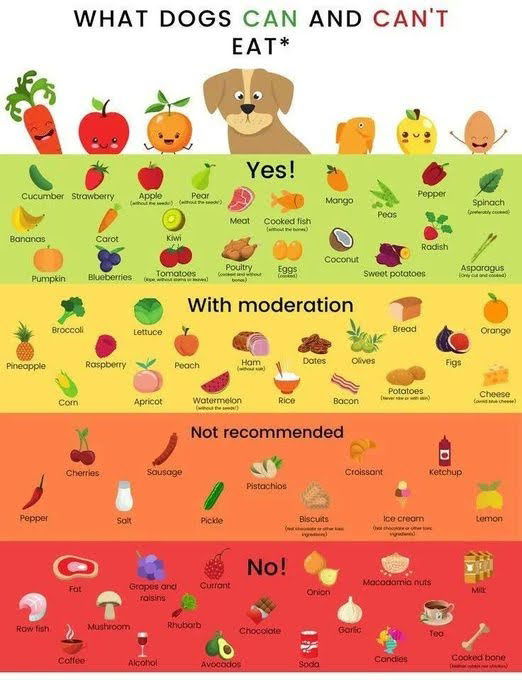
What dogs can and can’t eat
This one image explains everything a dog owner needs to know about dog-safe foods. It’s colorful, compact, and stupidly easy...

Before and After style results testimonial for CRO Optimizations
This testimonial nails it. Instead of explaining copywriting tactics, it just shows a clear before-and-after result: from 0 calls a...
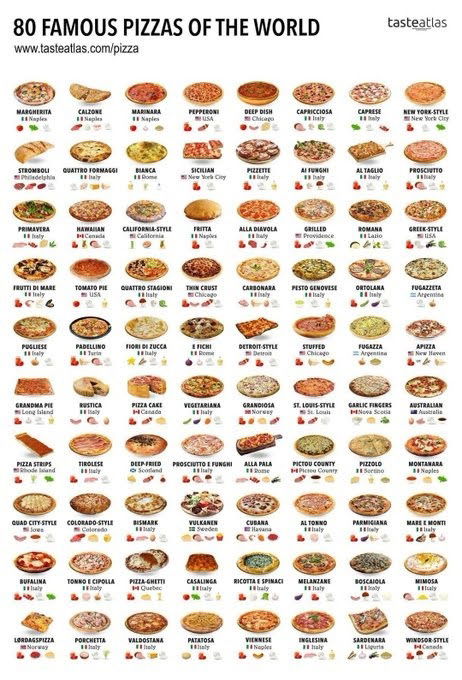
80 pizzas and where they’re from
This single image lists 80 pizzas from around the world, complete with names, origins, and ingredients. It’s not just mouthwatering—it’s...
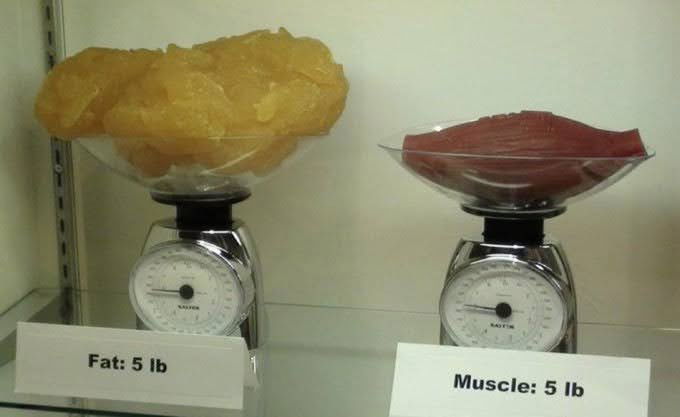
Fat vs Muscle visualization
Here’s a photo that fitness marketers have nailed for years. Two identical scales. Both hold five pounds. One’s filled with...
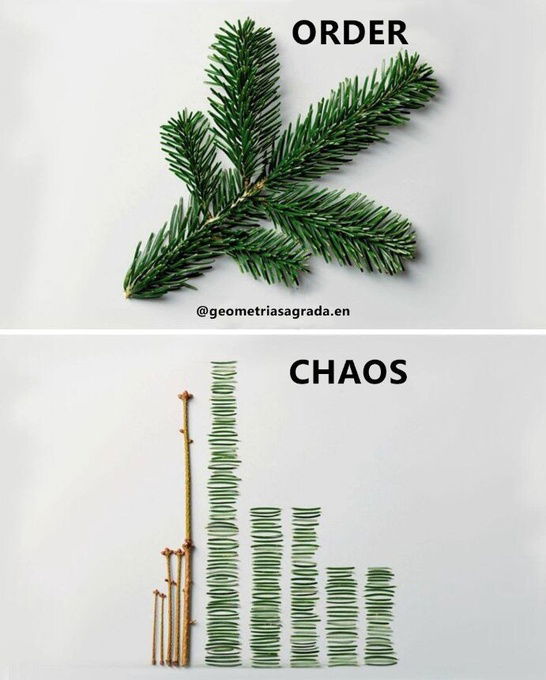
Order vs Chaos visualization
This image nails a powerful idea: all the right pieces don’t matter if they’re not assembled in the right order....
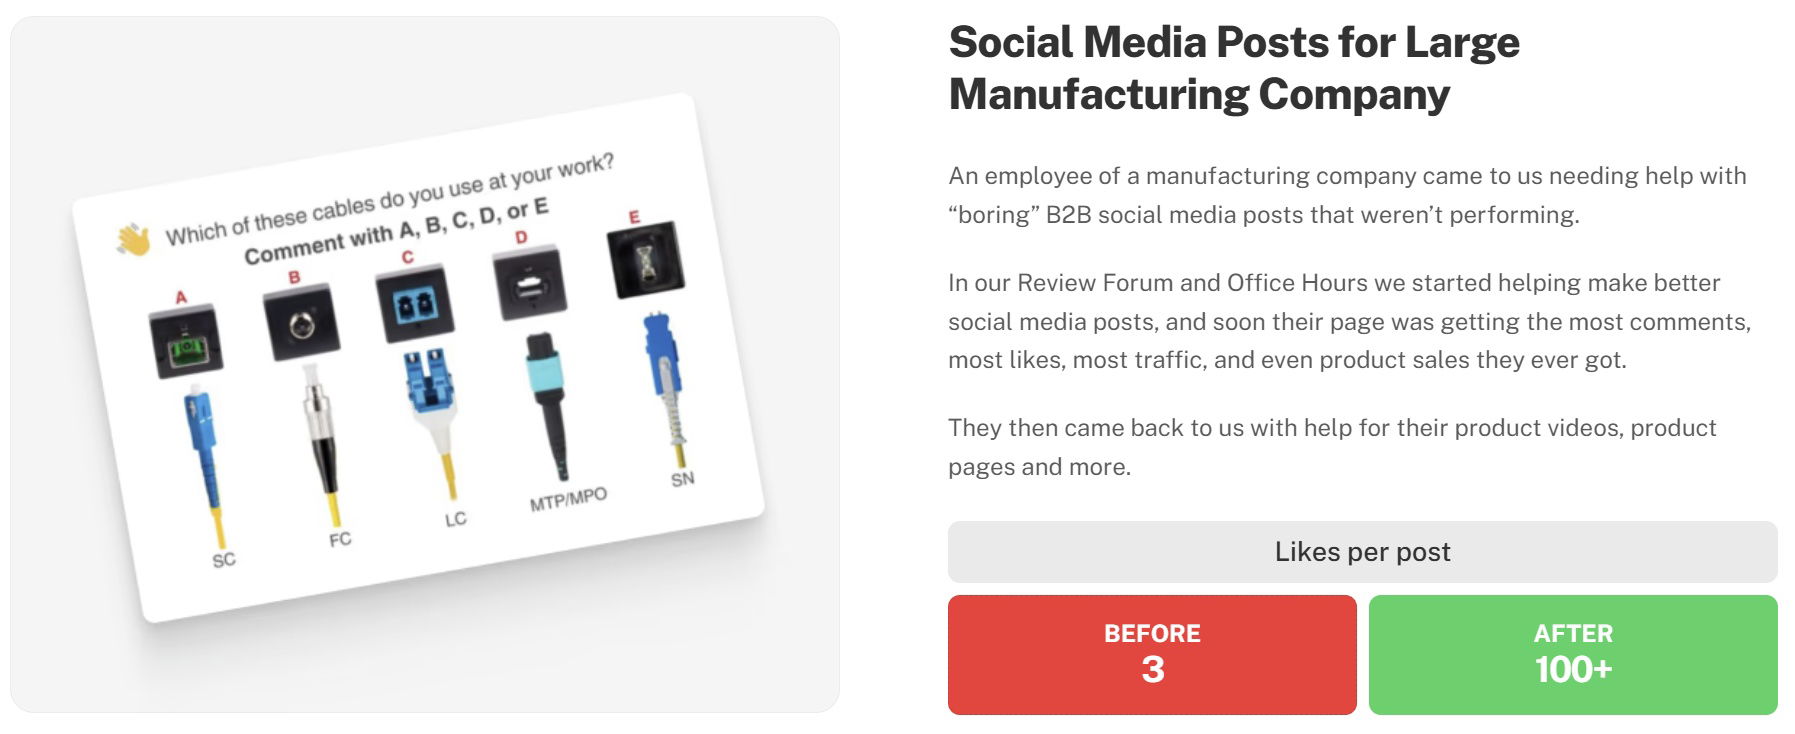
Before and After style results testimonial for a manufacturing company
Most sales pages spend paragraphs telling people what they’ll learn. This one from Copywriting Course just shows what happens after...