Great Newsletter Signup Pop-Up
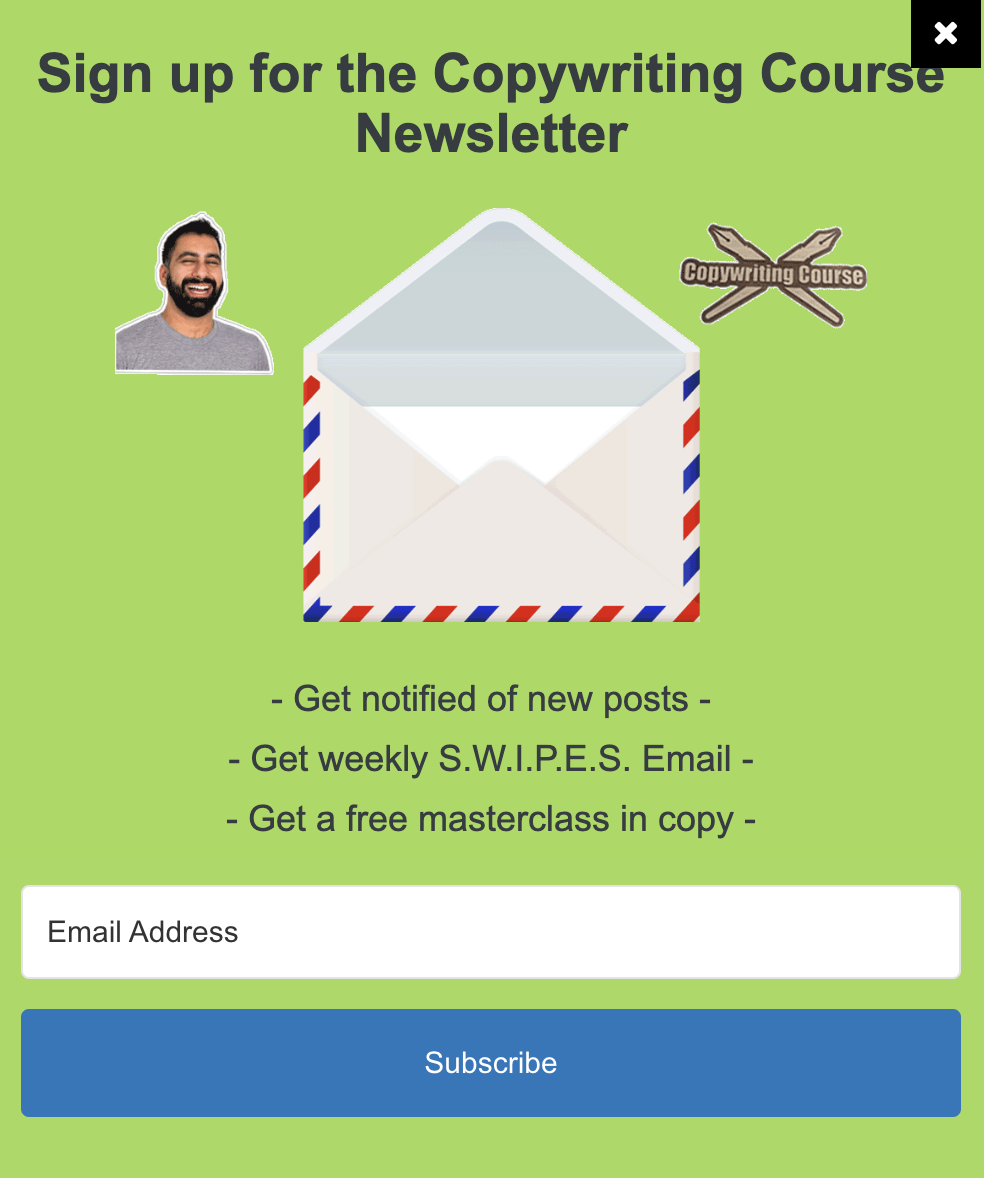
This pop-up from Copywriting Course nails the basics: a clear offer, a friendly face, and an easy action. It’s direct, visual, and zero fluff.
Why This Pop-Up Works
- Instant clarity: The headline says exactly what you get.
- Visual trust: Neville’s smiling face makes it feel human.
- Quick benefits: Three short bullets communicate clear value.
- Low friction: Only one field to fill out—no distractions.
- Consistency: Colors and style match the brand vibe perfectly.
Real-Life Examples
- HubSpot uses a smiling team photo and “Get smarter in 5 minutes a day” promise.
- Morning Brew sign-up asks only for an email and highlights quick, fun learning.
- The Hustle’s pop-up lists 3 engaging reasons to join, just like this one.
Analyzed by Swipebot
Loading analysis...