Jay Clouse “Creator Science” revenue

Transparent numbers turn fuzzy dreams into concrete targets.— Neville-style Marketing Brain
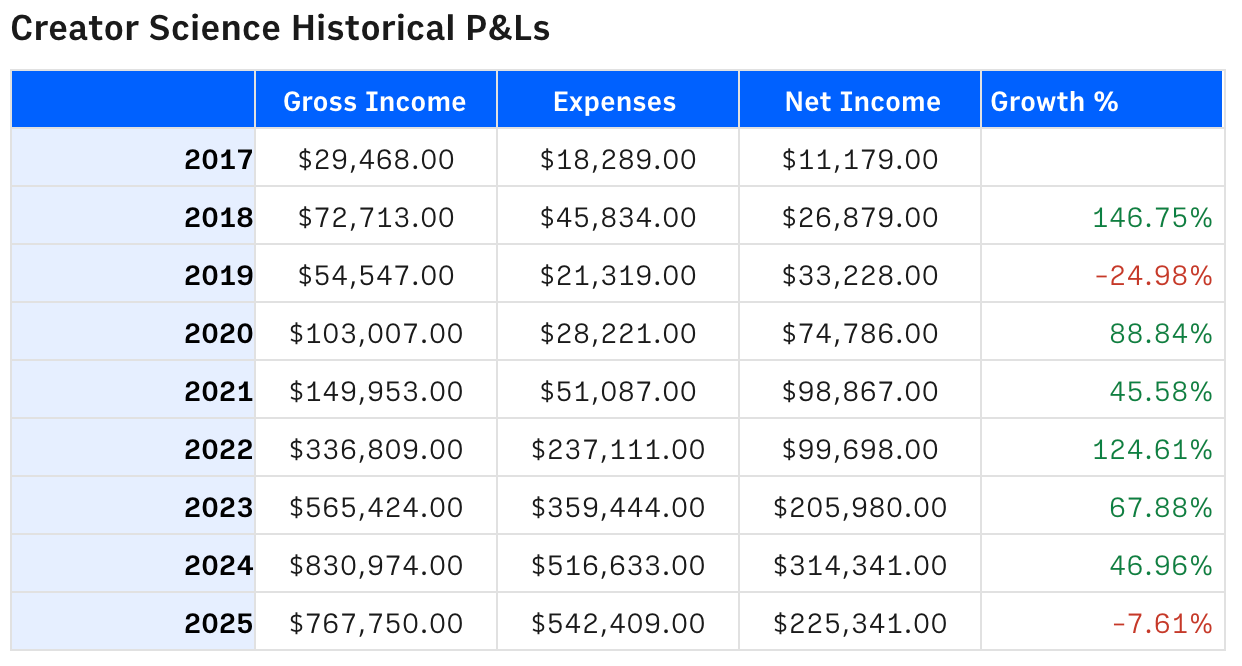
This P&L table is a creator business, laid bare from 2017–2025. Every row shows what most creators only guess at: gross, expenses, net, and year‑over‑year growth. Study this chart for 30 seconds and you will understand the real game behind “going full‑time creator.”
The Psychology Behind Publishing Numbers Like This
Posting a full P&L does three powerful things. First, it builds instant trust, because vague bragging is replaced with hard dollars and cents. Second, it reframes setbacks: a down year like 2019 or 2025 looks less like failure and more like tuition for future growth. Third, it quietly positions the creator as a serious operator, not just a lucky influencer. That combo attracts better sponsors, smarter collaborators, and more patient customers.
What This P&L Really Shows
- Growth is lumpy: 146.75 percent up in 2018, then a painful -24.98 percent in 2019.
- Scale is expensive: by 2024, expenses balloon to $516,633 to support $830,974 in revenue.
- Profit matters more than hype: 2023 nets $205,980, beating flashier revenue years with worse margins.
- Even a -7.61 percent dip in 2025 still throws off $225,341 in net income, because the base is huge.
Other Creators Using Radical Revenue Transparency
ConvertKit shares annual SaaS revenue, growth, and creator payouts in a public dashboard to signal stability and align with users.
Buffer publishes detailed salary formulas and company revenue so potential customers and hires see exactly how the business runs.
