Spot Rising Markets Before Competitors Do
Published on
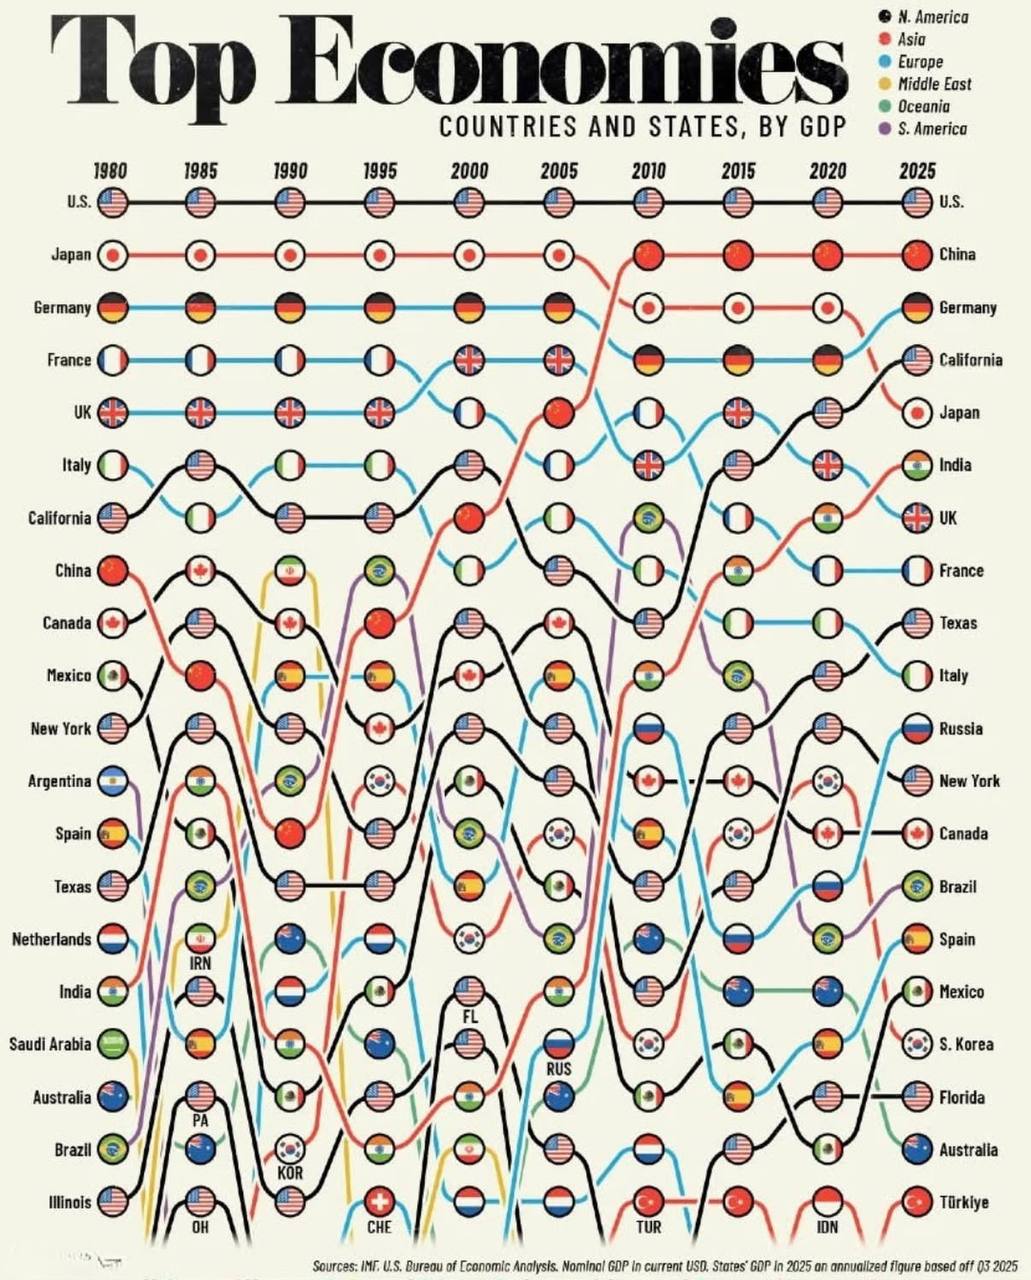
To spot rising markets, you don’t need a PhD in economics—you need a time machine made of charts. This visual of the world’s top economies from 1980 to 2025 is that time machine. Follow the colored lines and you literally watch money migrate: countries and even U.S. states climbing from afterthoughts to powerhouses. If you train your eyes to see these climbs early, you’ll see profitable markets long before your competitors do.
Read the Lines Like a Fortune Teller
Each colored path in the chart is a GDP rank over time. The magic isn’t at the top; it’s in the messy middle where lines cross. China, India, Texas, Brazil, South Korea, and Indonesia all snake upward from tiny roles in 1980 to major slots by 2025. That upward slope is your signal. When a region shows a long, steady climb—not a one‑year spike—it means infrastructure, talent, and spending power are compounding. Those are markets where ads get cheaper today and customers get richer tomorrow.
How To Spot Your Next Growth Market From Charts Like This
- Track climbers, not champions: The U.S. stays first, but China’s and India’s lines show the real story—decades of compounding growth.
- Watch when new players appear: Texas, New York, and Florida join the global top list, meaning individual states can be better bets than whole countries.
- Follow clusters, not outliers: Multiple Asian lines (China, India, South Korea, Indonesia) rise together—signal of a regional boom, not a fluke.
- Look for persistence: Markets that keep climbing across 3–4 time periods usually keep winning, even through recessions and shocks.
- Map your offers to the curve: Enter rising markets with digital products first (low friction), then layer in local partners as GDP and ad costs shift.
Companies That Rode Rising Markets Early
Alibaba grew by locking into China’s explosive GDP rise just as the country’s line in the chart bent sharply upward.
Netflix expanded into Brazil, Mexico, and other climbing economies while ad costs were low and middle classes were just starting to boom.
Samsung capitalized on South Korea’s rise from minor player to top‑tier economy by turning its home market strength into global dominance.
Creative Variations
Analyzed by Swipebot
Loading analysis...