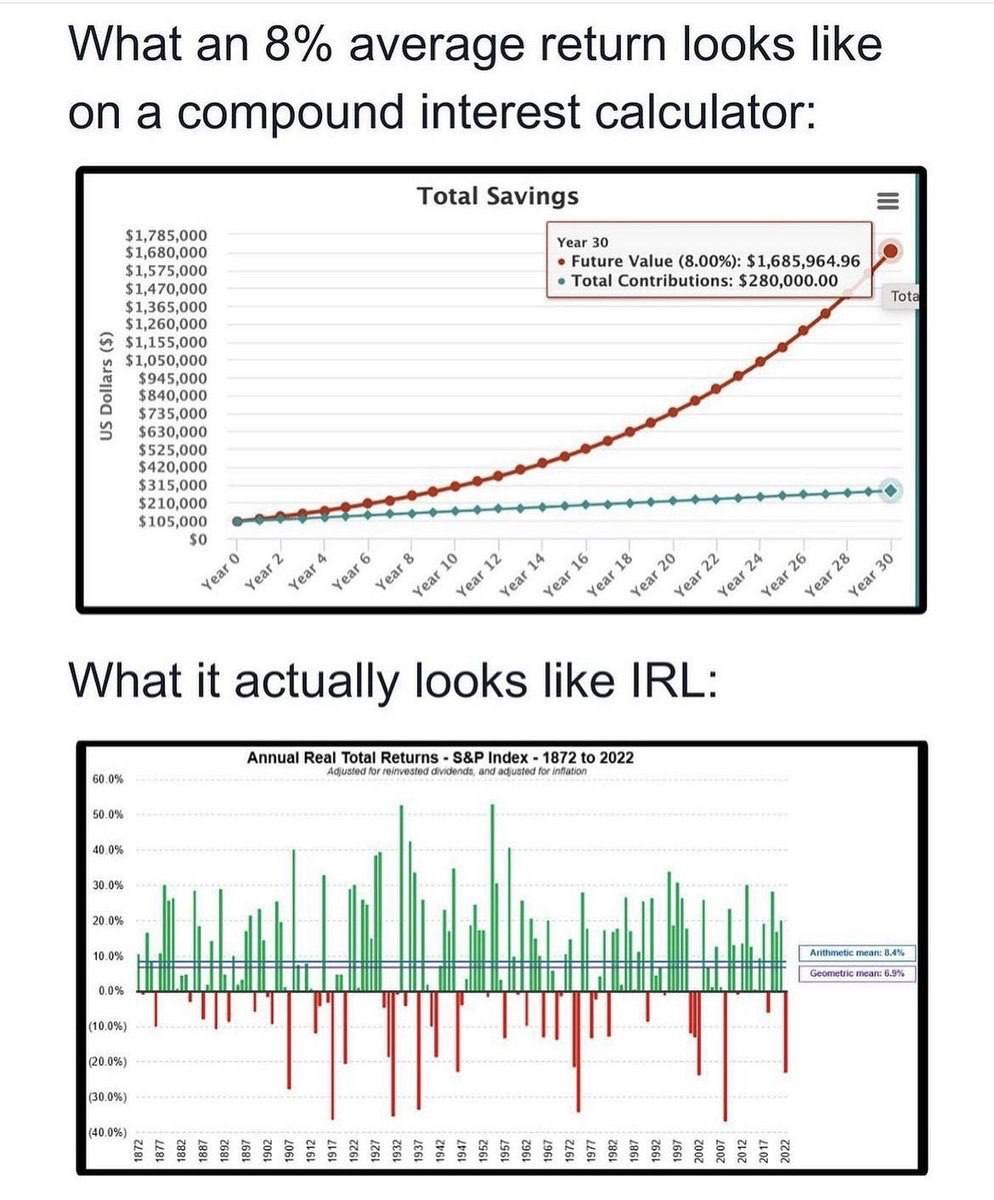
The image smacks you with the truth: the neat 8 percent line your broker loves is a fairy tale. On top, you see a perfect red arc gliding to $1.6M like a financial Disney movie. Under it, the real S&P return history looks like a heart monitor during a panic attack. Same “8 percent average,” totally different ride. That gap is where investors get wrecked.
The Visual Trick
The calculator chart assumes you calmly earn 8 percent every single year, no drama, no crashes, no manias. The second chart shows over a century of reality: giant green spikes, ugly red plunges, years of meh in between. Arithmetic average says 8.4 percent, but the compounded, lived result is closer to 6.9 percent. The illusion is mistaking a smooth spreadsheet fantasy for the jagged path your money actually takes.
What To Remember Before You Believe The 8 Percent Pitch
- Average returns hide the order of returns, and bad years early can kneecap your compounding.
- Risk is not a tiny footnote; those red bars are the emotional cost of the green ones.
- Plans should survive decades of volatility, not just look pretty in a compound interest screenshot.
Who Shows The Jagged Version
Vanguard publishes long-term return charts that highlight both booming and crashing years so investors see the real ride, not a fantasy line.
J.P. Morgan’s Guide to the Markets regularly uses bar charts of yearly S&P returns to hammer home how bumpy the path to an 8 percent average really is.
