
1
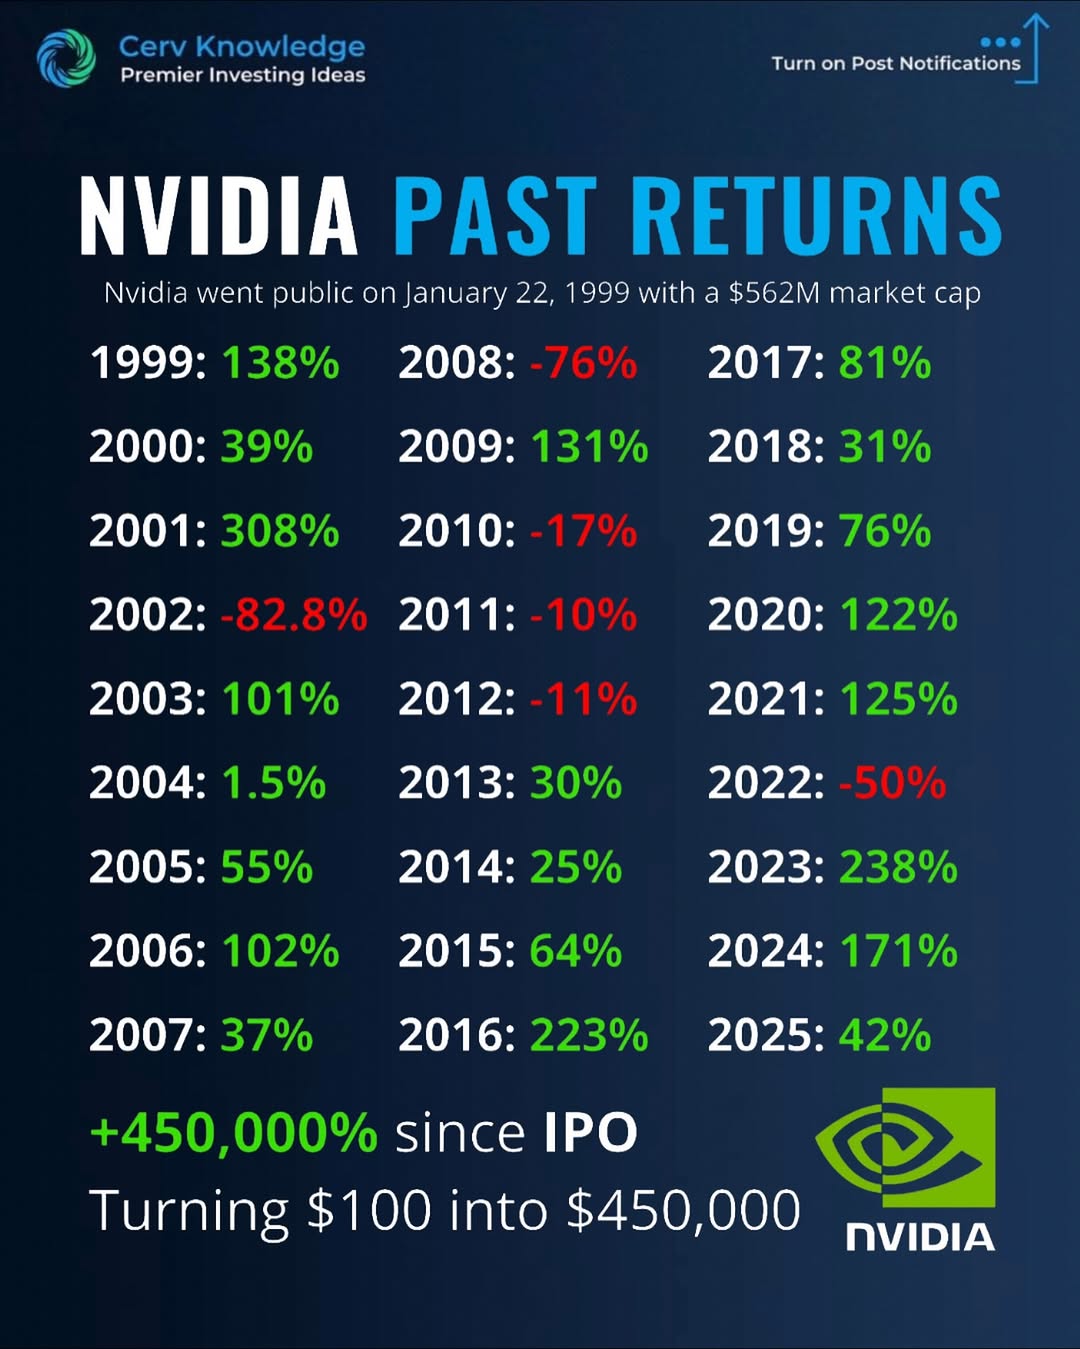
cervknowledge Nvidia IPO’d in 1999 with a $562M market cap — and has since delivered +450,000% total returns,...
This Nvidia chart is the most honest investing lesson you’ll see all week. It’s a wall of neon green gains stabbed with a few blood‑red years that look absolutely terrifying. Yet that ugly rollercoaster is exactly what turned $100 into $450,000. If you want those kinds of outcomes, you have to survive those kinds of drawdowns.
What the Nvidia Chart Really Shows
Zoom in on the image and you see the story: +308% in 2001, then -82.8% in 2002. A brutal -76% in 2008. A gut‑punch -50% in 2022. In between, you get monster years like +223%, +238%, +171%. The magic isn’t any single green bar; it’s the fact that long‑term holders didn’t bail during the red ones. Compounding only worked because conviction outlasted volatility.
How To Hold Through Drawdowns And Win Big
- Decide your holding period before you buy, so a bad year does not rewrite your plan.
- Anchor to the business and its future cash flows, not today’s price quote.
- Pre‑accept that a potential 10x–100x winner will feel awful to own several times.
- Use position sizing and diversification so a temporary -80% does not become a permanent knockout.
Analyzed by Swipebot
Loading analysis...
.png?width=3840&quality=80)