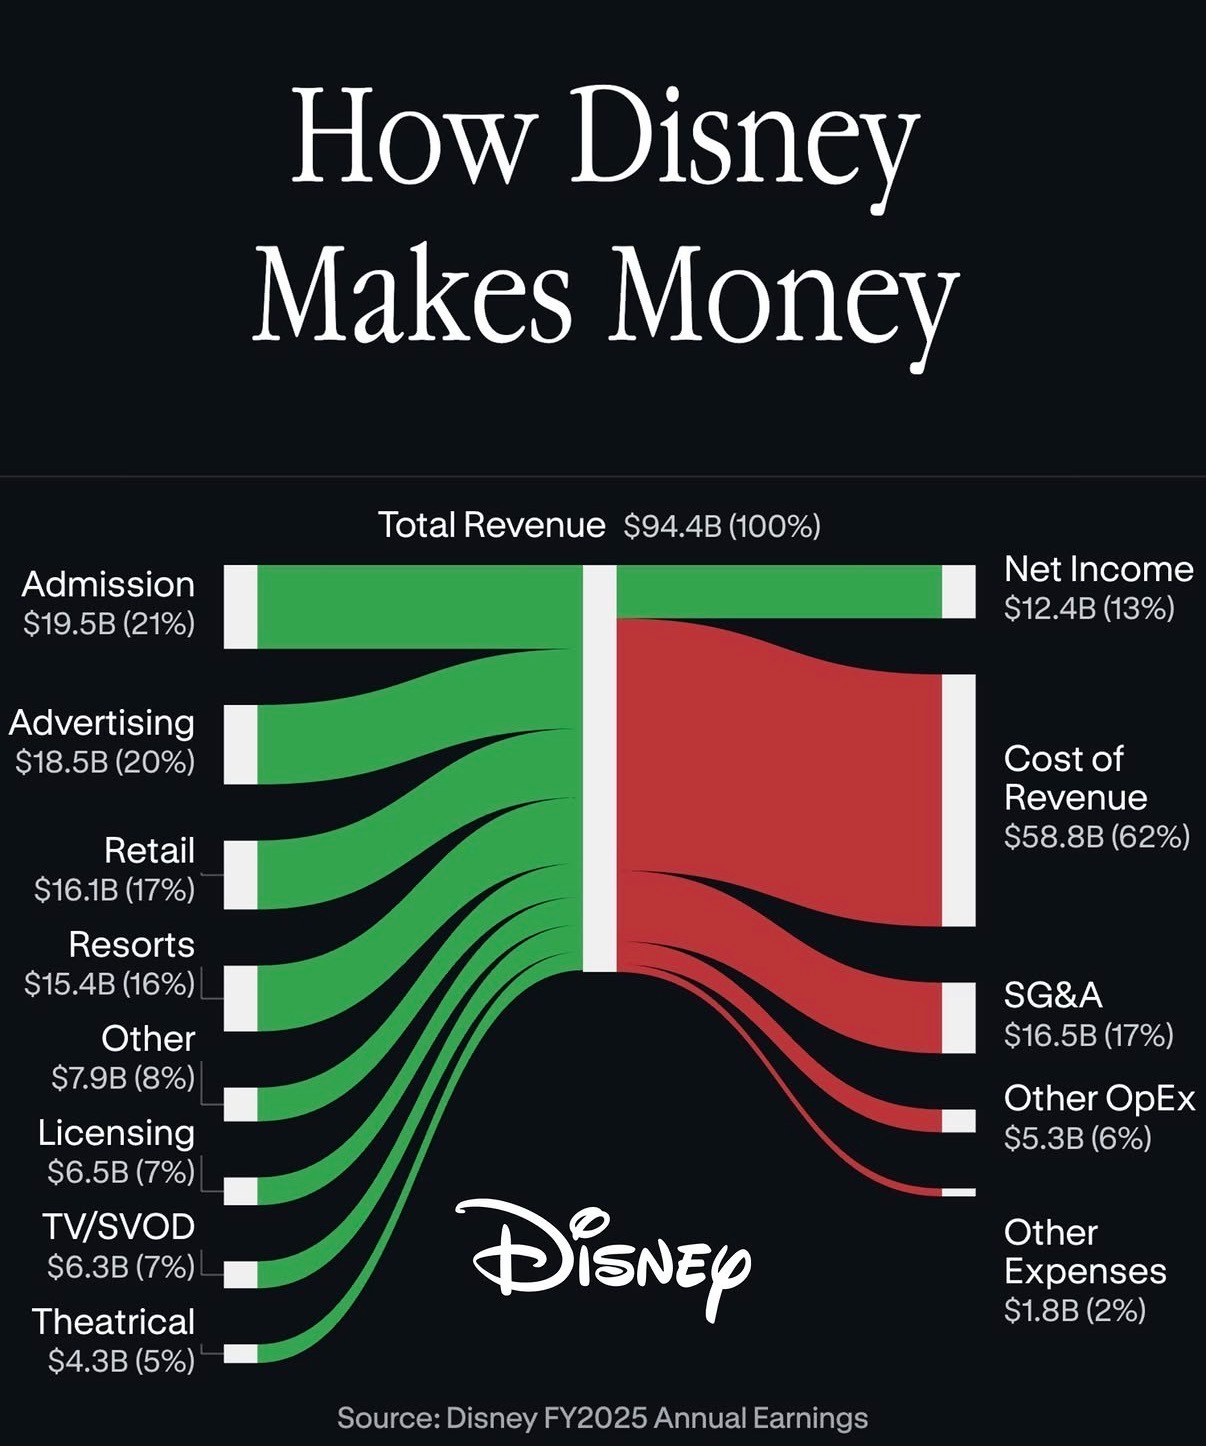
Most people think Disney makes money from movie tickets and Mickey-shaped ice cream. This revenue map blows that fantasy apart and shows exactly where the cash gushes in—and leaks out. Once you see the green-to-red river, you realize Disney is less a movie studio and more a money-routing machine. Let’s walk through where $94.4B really flows, and what that teaches you about building a sprawling, multi-channel business.
The Psychology Behind Disney’s Money Machine
The chart makes one thing obvious: Disney doesn’t rely on any single hit. It monetizes the same story across parks, merch, screens, and sponsors. One kid’s obsession with a character turns into admission fees, hotel nights, plush toys, licensing deals, and ad impressions. The cost side is brutal, but the map shows why Disney can spend big—every new world they build feeds multiple revenue streams at once. If your business only has one green line, you’re playing a much riskier game than Disney.
What the Revenue Map Actually Shows
- Admission is king: $19.5B (21%) from people simply walking through gates at parks and experiences.
- Advertising is almost as big at $18.5B (20%), turning Disney’s attention into a product.
- Retail and resorts together pull in over $31B, proving the brand prints money long after the movie ends.
- The “small” lines add up: licensing, TV/SVOD, theatrical, and other revenue still represent billions each.
- On the expense side, 62% ($58.8B) vanishes into Cost of Revenue before profit even enters the chat.
- Despite the red river of costs, Disney still lands $12.4B in net income—about 13 cents of profit per dollar.
How You Can Steal This Strategy

Shopify turns a simple ecommerce platform into multiple streams via subscriptions, payment processing, apps, and capital advances.
Netflix stretches each show into revenue by feeding subscriptions, licensing windows, and cross-promotions across regions.
Apple uses every new device launch to fuel hardware sales, services revenue, accessories, and ecosystem lock-in.
Creative Variations
Analyzed by Swipebot
Loading analysis...