Real Timelines: When Startups Reached Product-Market Fit (PMF)
Published on
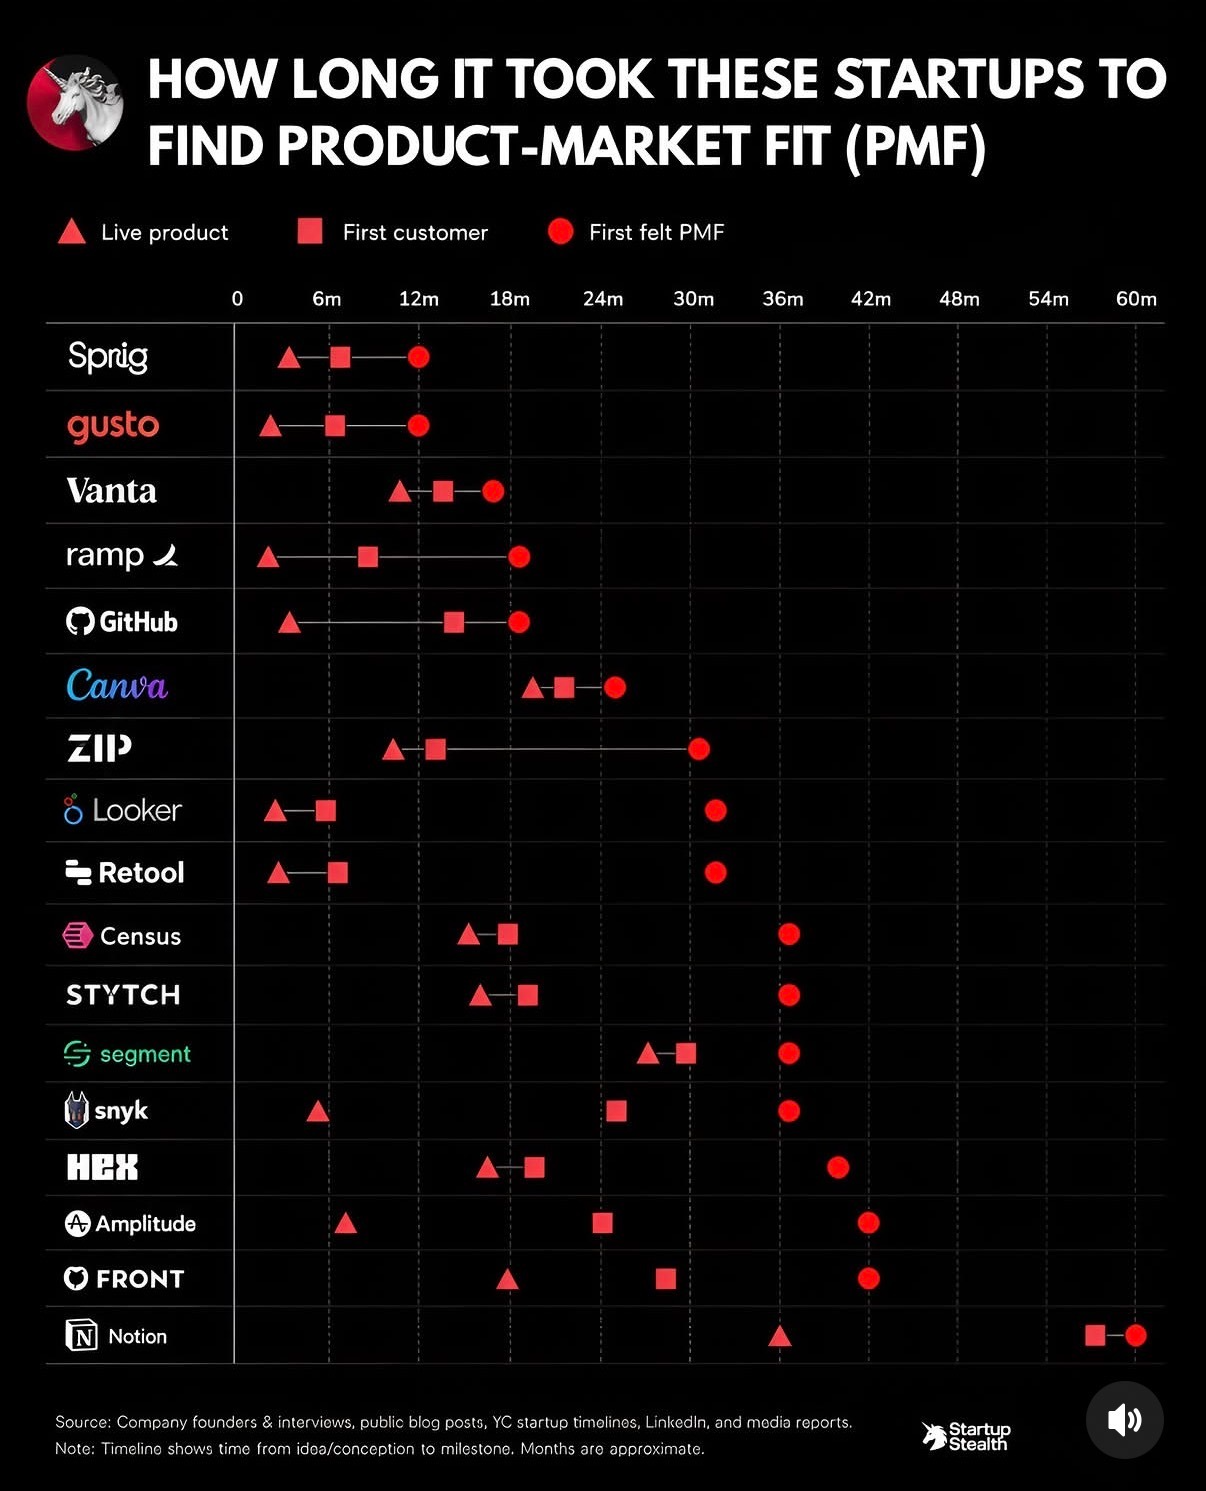
Most founders secretly hope product‑market fit shows up in six months. This chart slaps that fantasy in the face. It maps how long real startups took to launch, land their first customer, and finally feel PMF. When you see the red circles creeping out past 24, 36, even 60 months, the message is clear: slow timelines are normal, not failure.
How To Use This As A Founder
Print this chart and tape it above your desk. When you feel behind, look at those 36–60 month PMF circles and remember you are competing with reality, not launch-day success stories. The goal for the first couple of years is not perfection; it is staying alive long enough to move your own red circle a little further to the right.
What This PMF Timeline Chart Really Shows
- There is no standard clock: some companies feel PMF around 12 months, others grind for 3–5 years before it clicks.
- Launch is early, PMF is late: most triangles (live product) appear well before the red PMF circles, proving shipping is just the starting gun.
- Customers do not equal PMF: many squares (first customer) sit a year or more before the PMF moment, meaning revenue can mask weak pull.
- Survivors iterate, not pivot wildly: the dots drift right, but they stay on the same line, hinting these startups refined the core idea instead of restarting.
Real Startup Timelines From The Chart
Canva ships a product, gets customers, and still needs years before the red PMF circle finally lands near the far right of the chart.
Notion shows an extreme case where the PMF marker sits close to the 60‑month mark, visual proof that a breakout tool can marinate for half a decade.
Segment takes multiple years between early product dots and the eventual PMF circle, underlining how long analytics and infra tools can take to truly catch.
Creative Variations
Analyzed by Swipebot
Loading analysis...