Why Startups Fail Chart
Published on
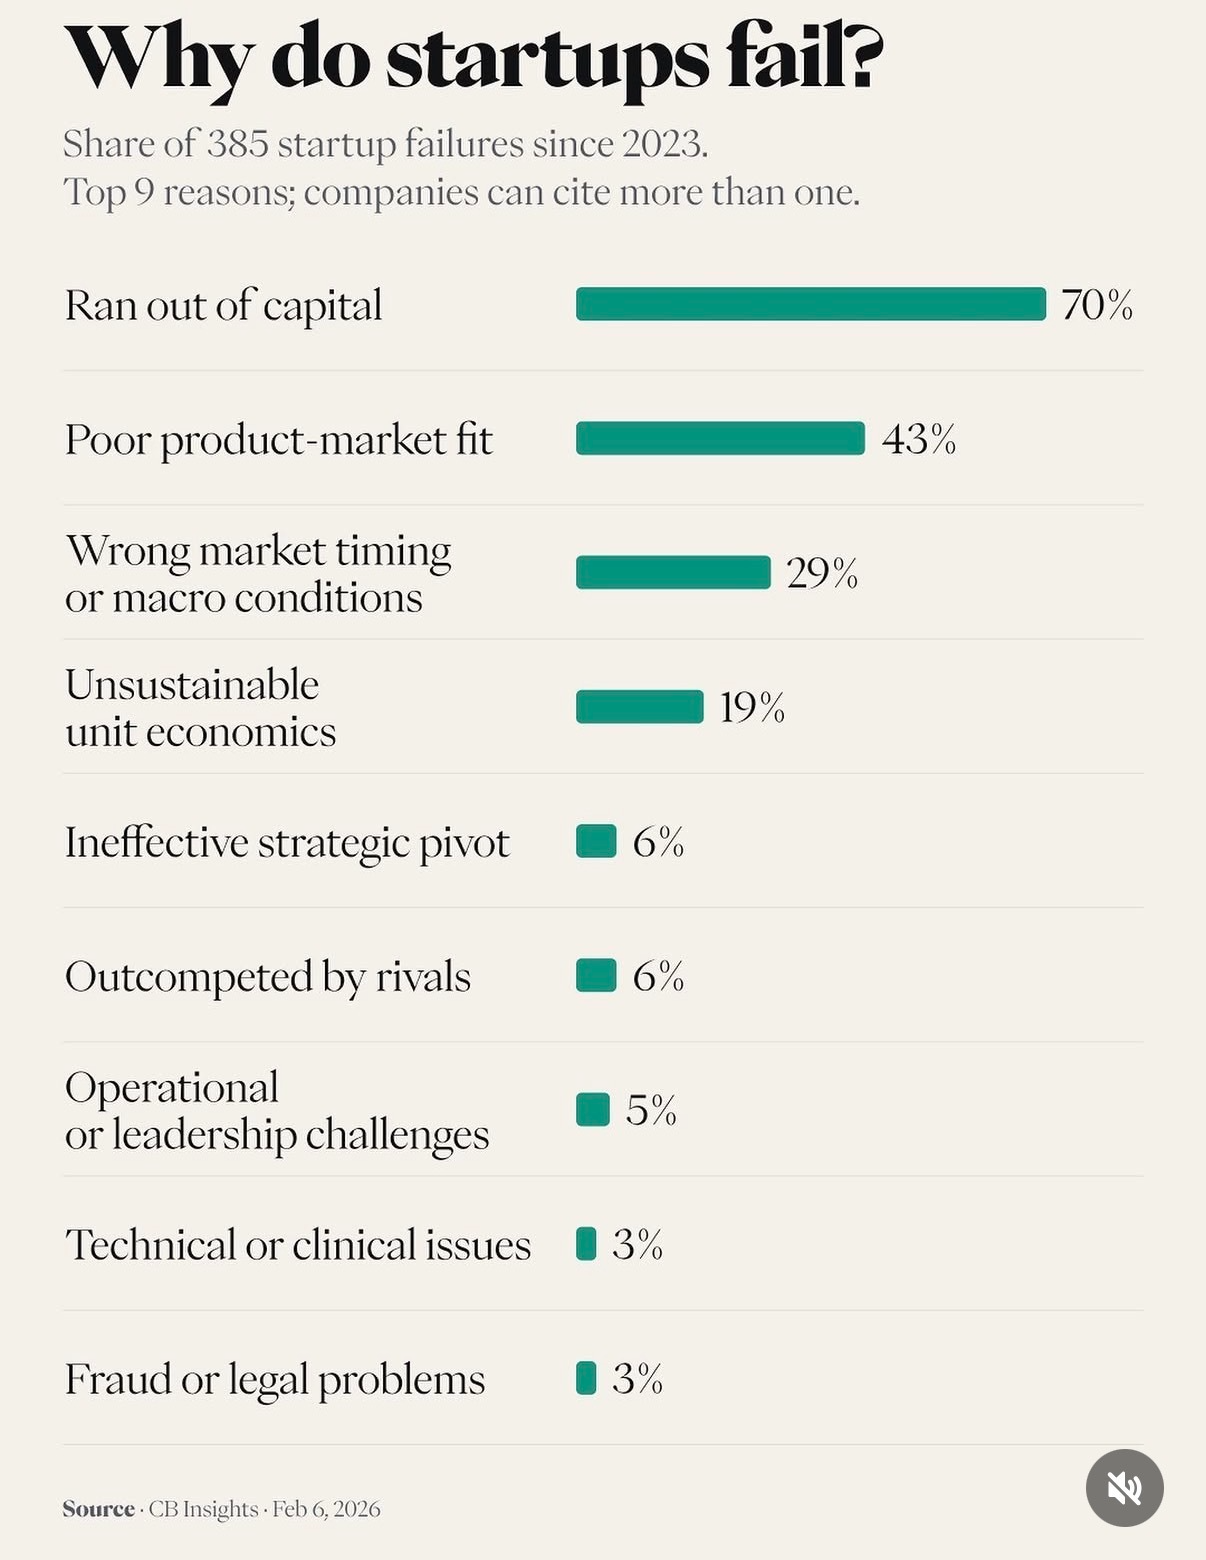
This chart quietly yells a brutal truth: startups don’t usually die from competition, code, or courts. They die because the bank account hits zero. When 70% of failures since 2023 cite “ran out of capital,” everything else—product, timing, strategy—gets graded on a curve called runway. If you can buy time, you get more at‑bats. If you can’t, even a decent idea gets buried under payroll and AWS bills.
Runway beats everything
Runway is not just how long you can keep the lights on. It is how many experiments you can run before the lights go off. Every month of extra cash buys more chances to find product‑market fit, repair unit economics, or ride out ugly macro conditions. The founders who win are often not the smartest or the earliest; they are the ones who stay alive long enough for the graph to finally tilt up. Protect runway first, then optimize everything else.
What the chart is really saying
- Money death (70%) dwarfs poor product‑market fit (43%) and bad timing (29%) combined.
- “Unsustainable unit economics” at 19% shows growth without margin just speeds up the crash.
- Fancy problems—strategy, rivals, leadership, tech, legal—each kill less than 6% of startups.
- If runway is healthy, you can survive bad timing, weak v1 product, and clumsy pivots long enough to fix them.
Creative Variations
Analyzed by Swipebot
Loading analysis...