Highest Grossing Movie Data
Updated on
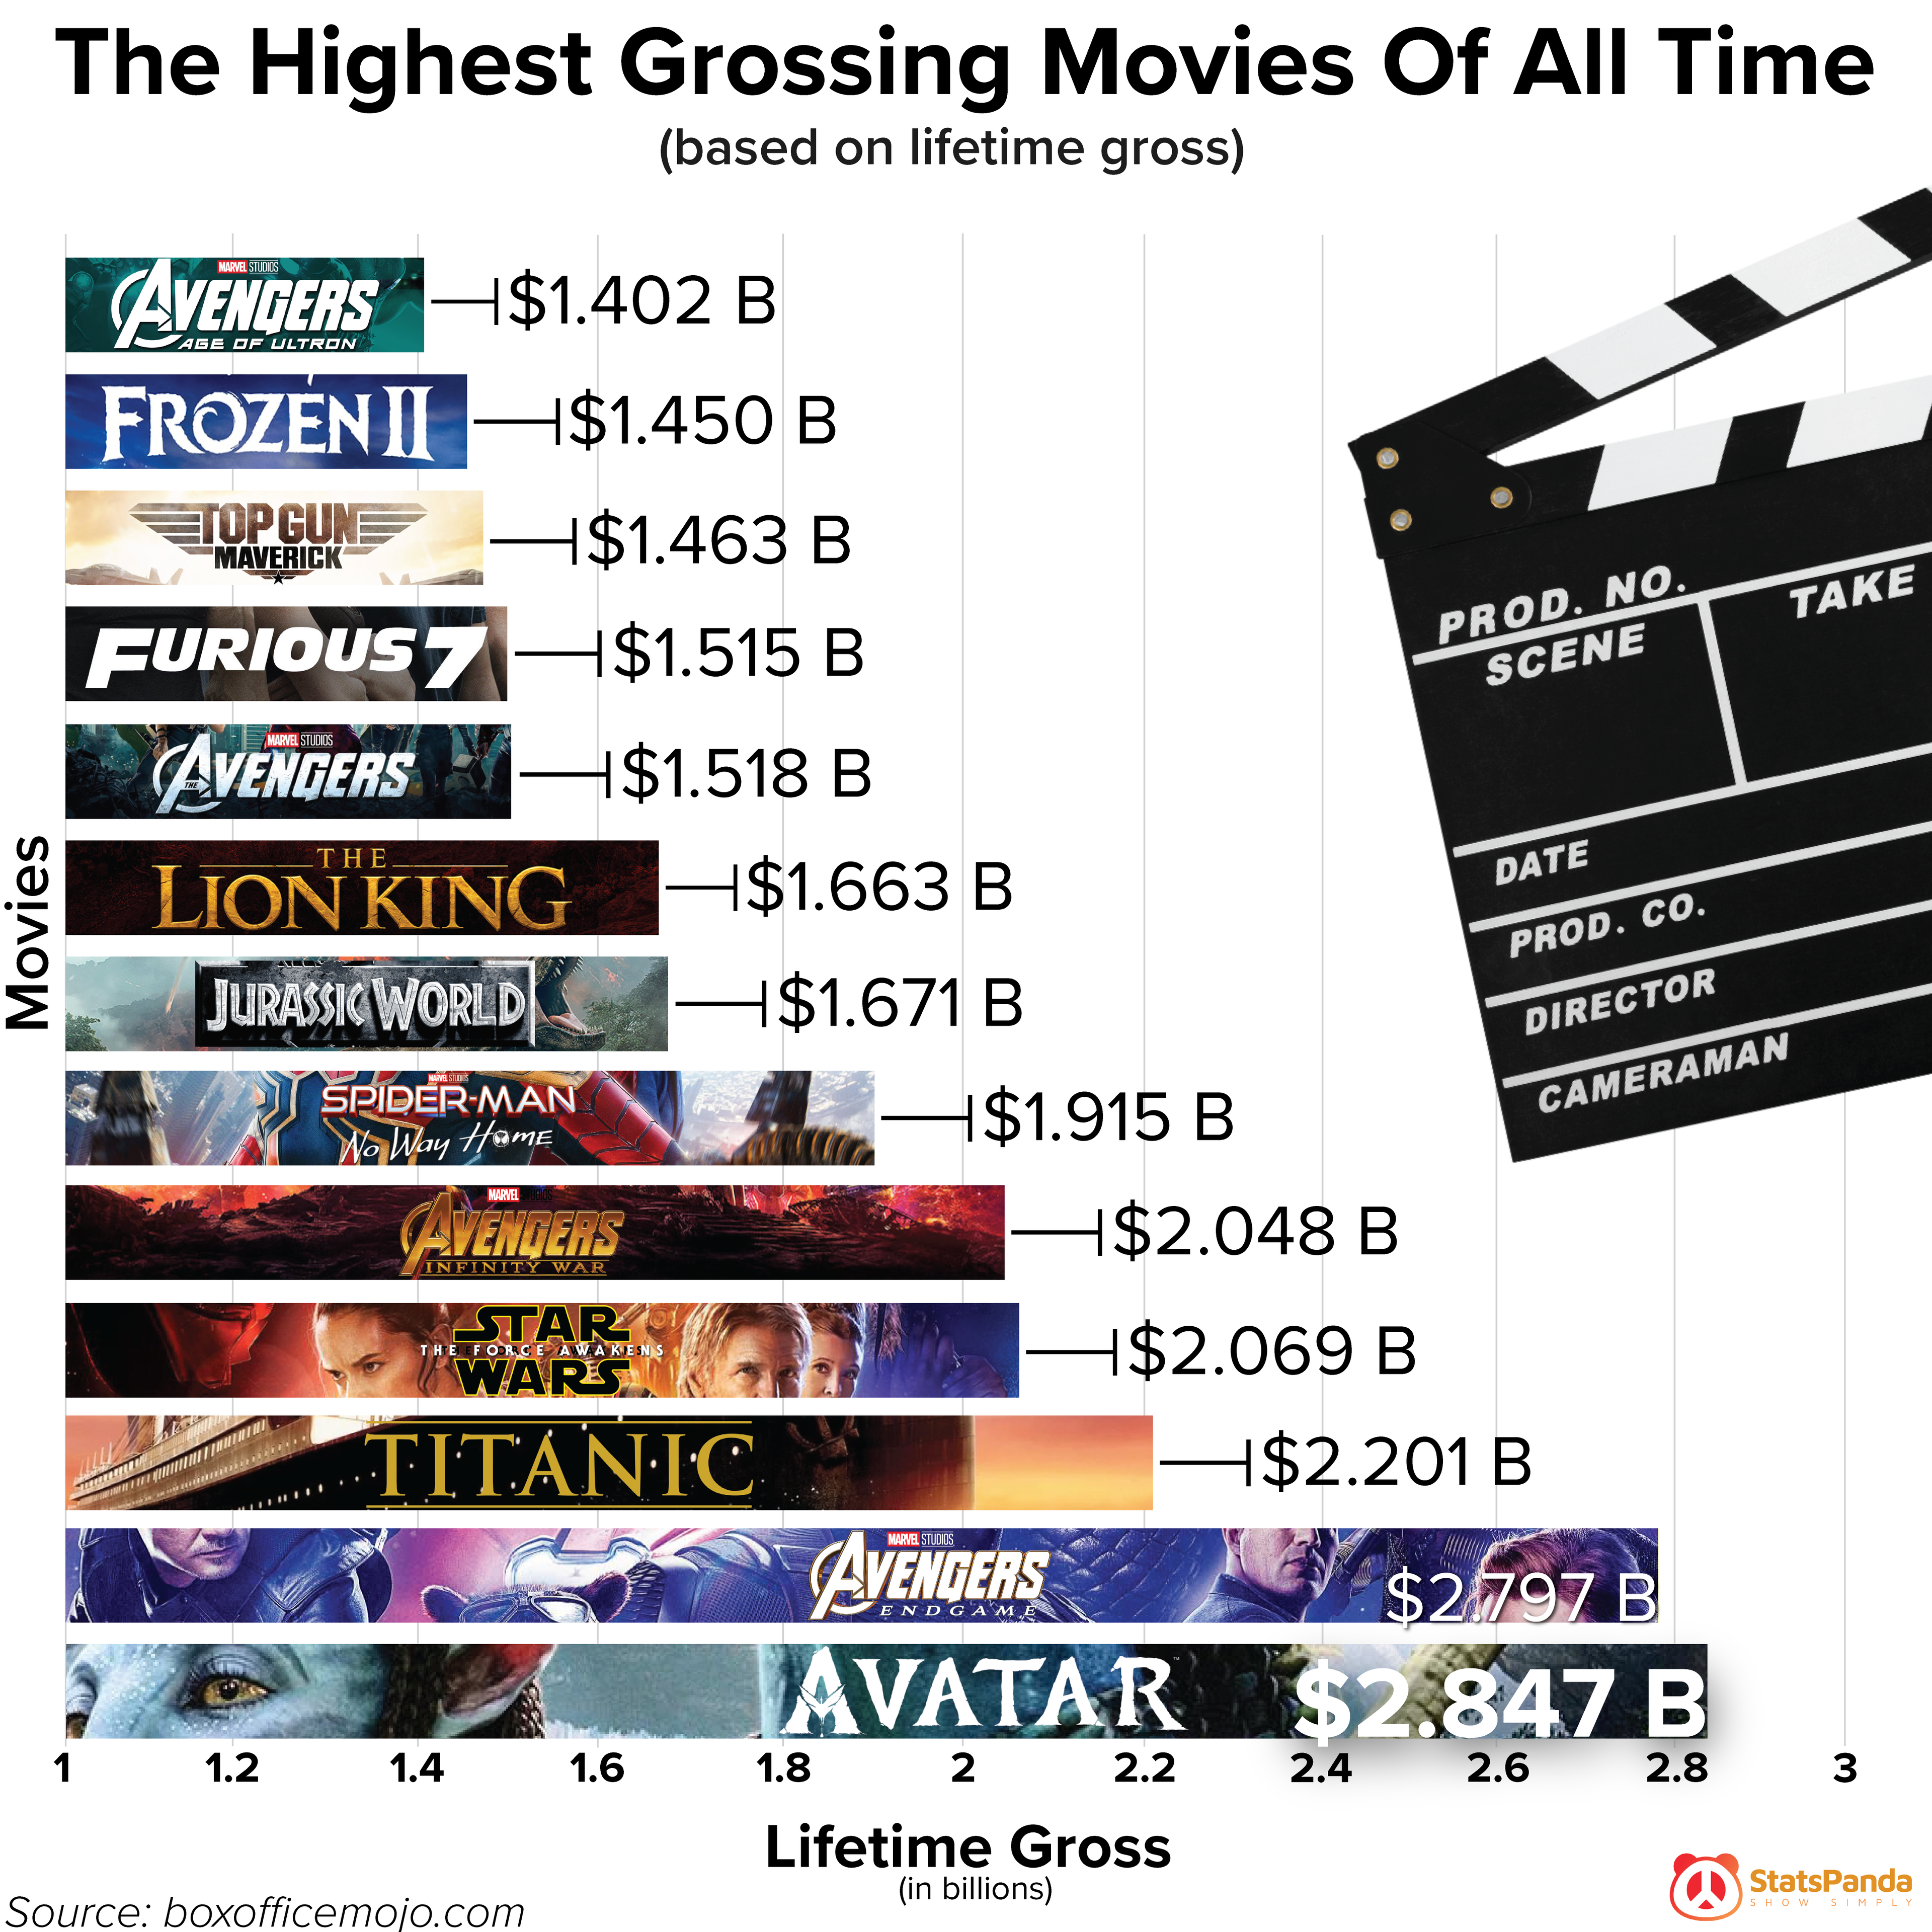
This chart pops. You instantly see which movies crushed it at the box office, from Avatar at the top to Avengers: Age of Ultron near the bottom. No fluff, just a fast visual story backed by massive numbers.
Why It Works
- Visual hierarchy makes the winners obvious—bigger bars, bigger payoff.
- The use of movie logos grabs brand recognition instantly.
- Clean layout means no thinking required to “get” the point.
- The chart uses billions for big, satisfying dollar figures.
Real-World Examples
- Spotify’s “Wrapped” visuals—simple bar-like graphics showing your top songs.
- Strava’s year-in-review charts—everyone loves seeing themselves on a leaderboard.
- LinkedIn’s “Top Startups” list—bold logos + clean ranking = endless shares.
Charts like this turn complex data into eye candy people actually share.
Analyzed by Swipebot
Loading analysis...