1,913 Images and Illustration Examples That Teach Things
Drawings and illustrations and photography can transmit more information from human-to-human than text can. This board is perfect for designers and marketers seeking visual inspiration.
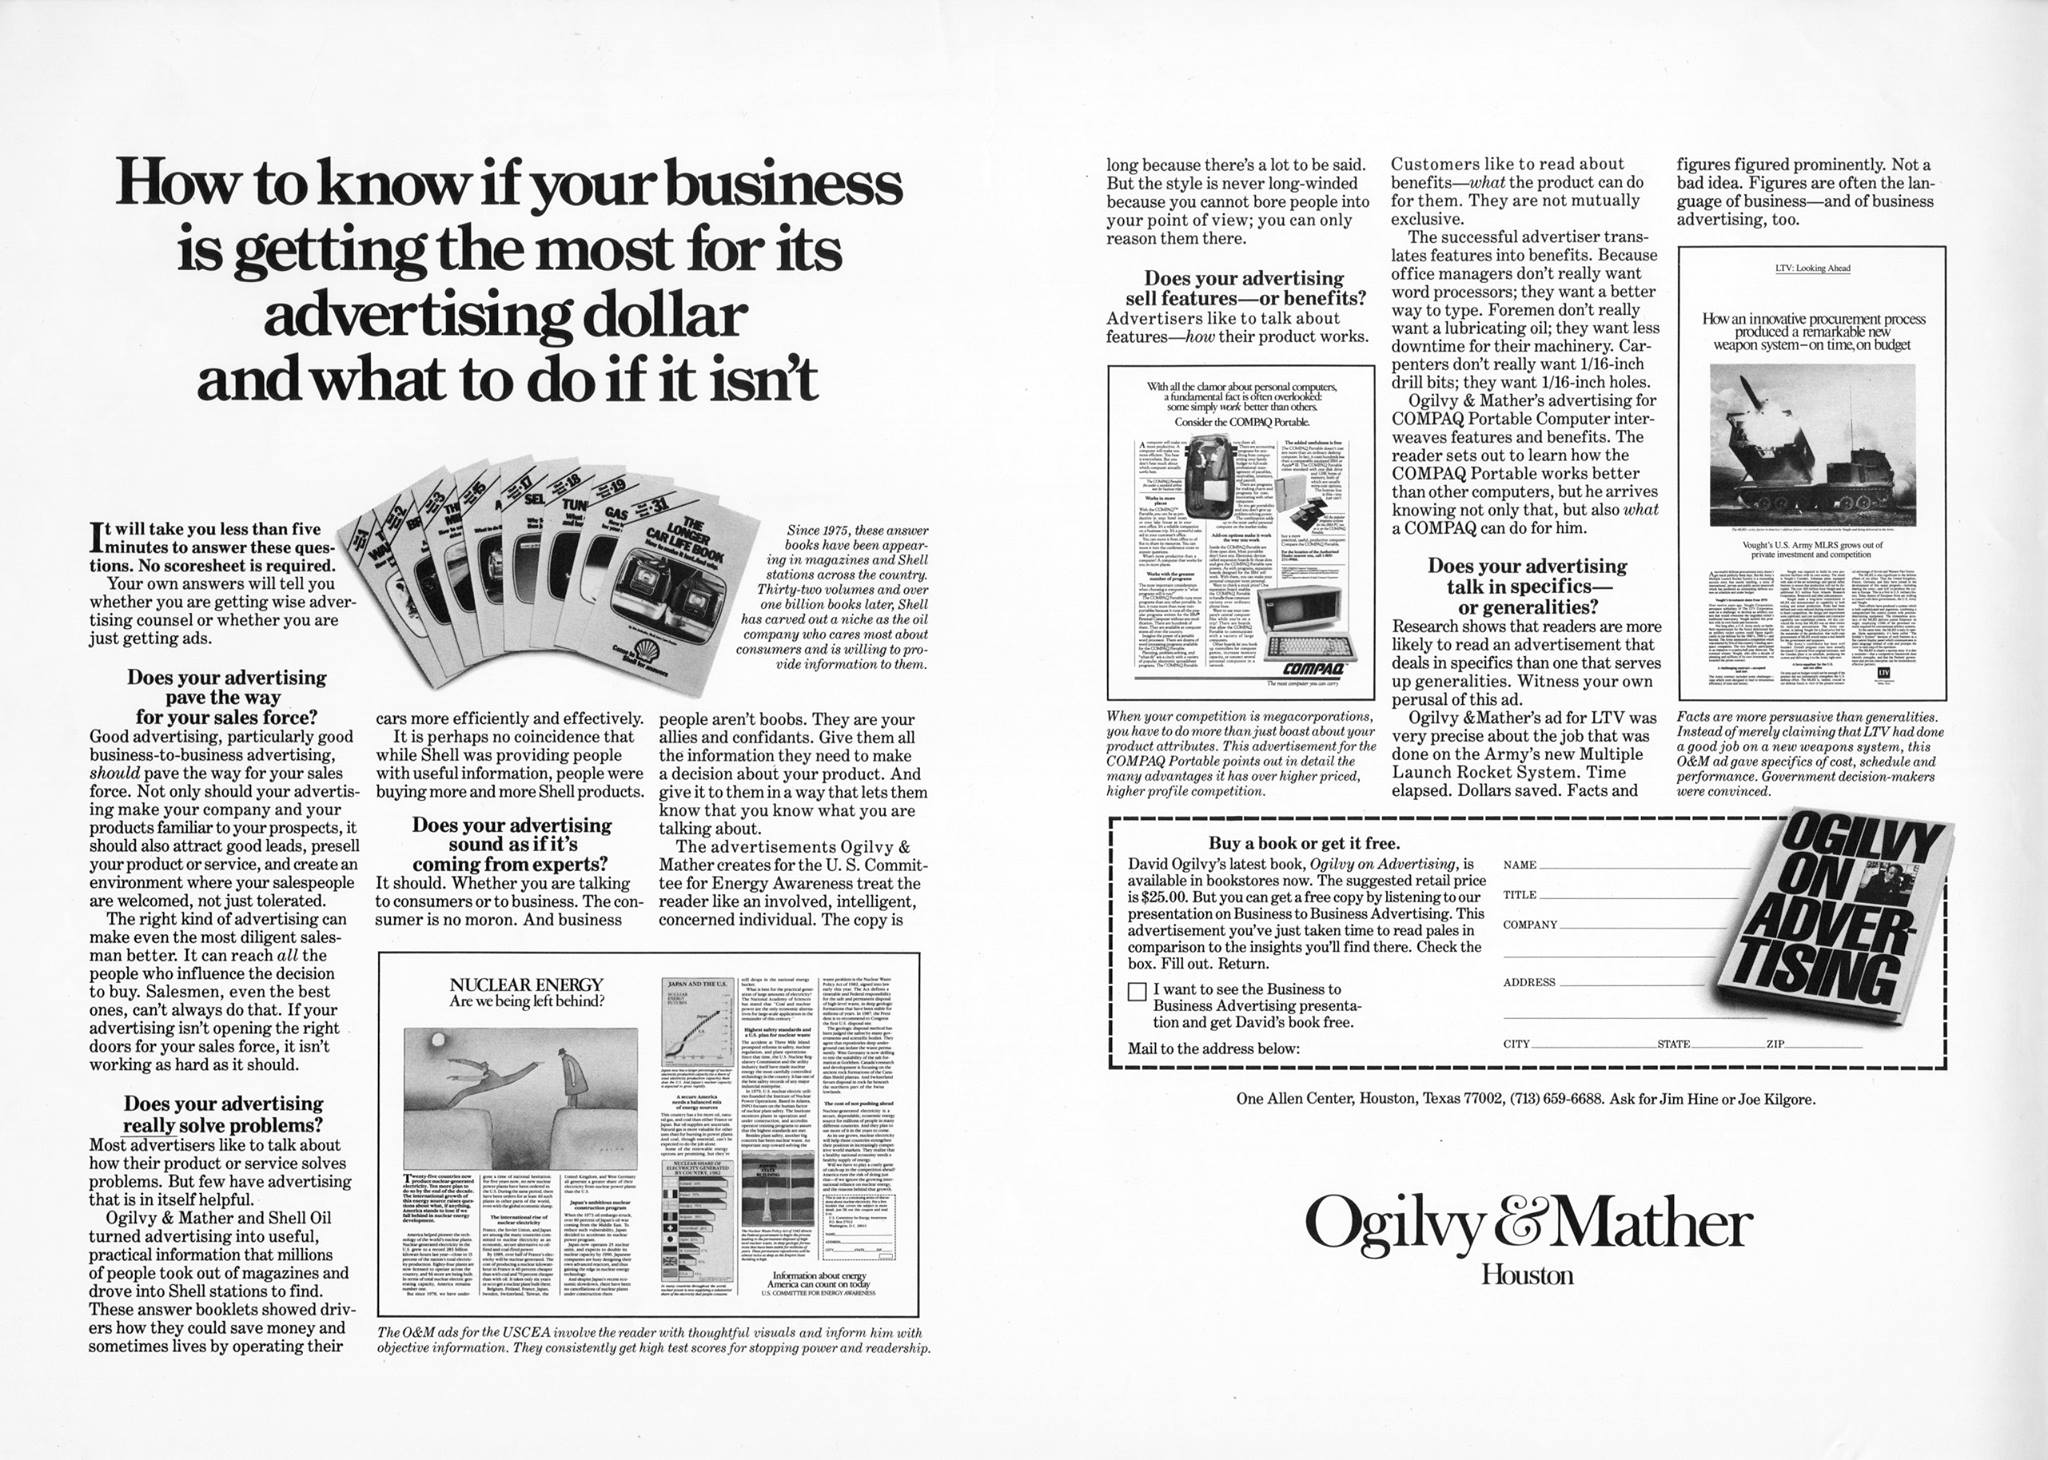
This Vintage Advertising Layout Still Teaches Modern Marketers a Lesson
This black-and-white vintage ad layout might look dated, but it’s a masterclass in strategic copywriting. It’s filled with dense text,...
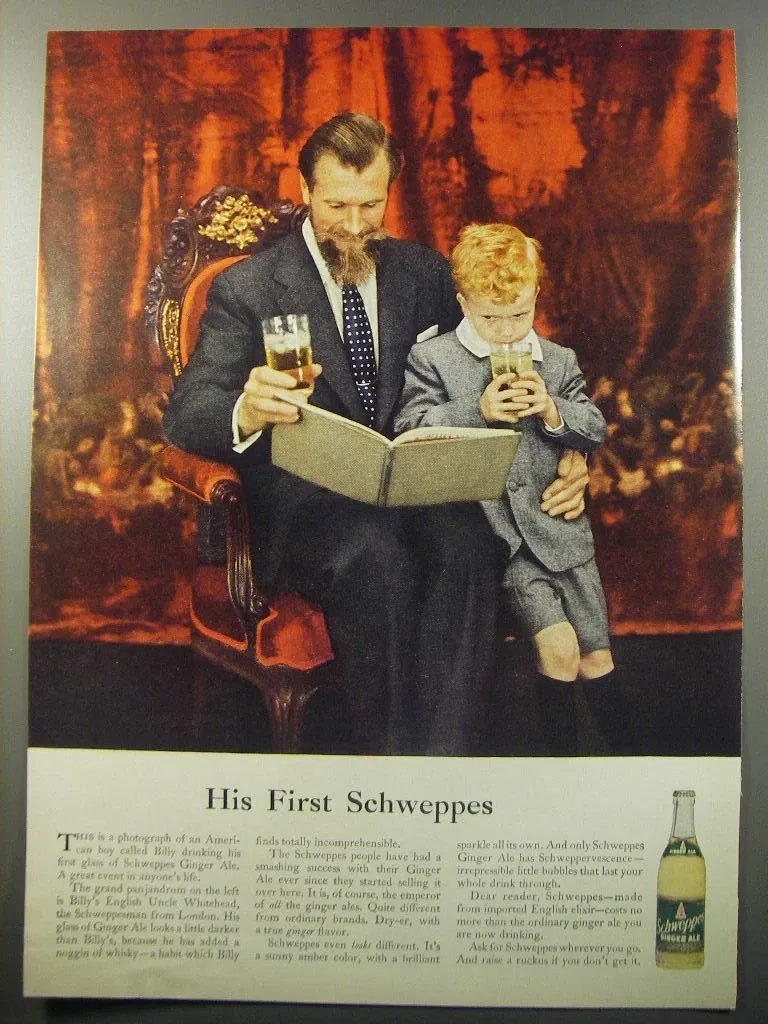
The Timeless Charm of “His First Schweppes”
The vintage Schweppes ad titled “His First Schweppes” perfectly captures the brand’s refined wit and old-world charm. It shows a...
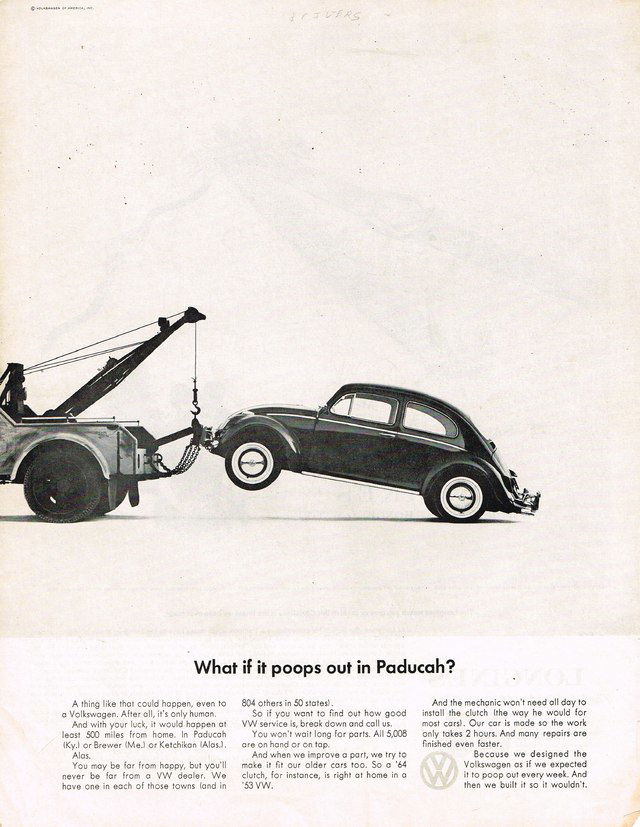
The Honesty That Sold Millions: VW’s 'Paducah' Ad
This vintage Volkswagen Beetle ad flips the typical car commercial on its head. Instead of boasting perfection, it opens with,...
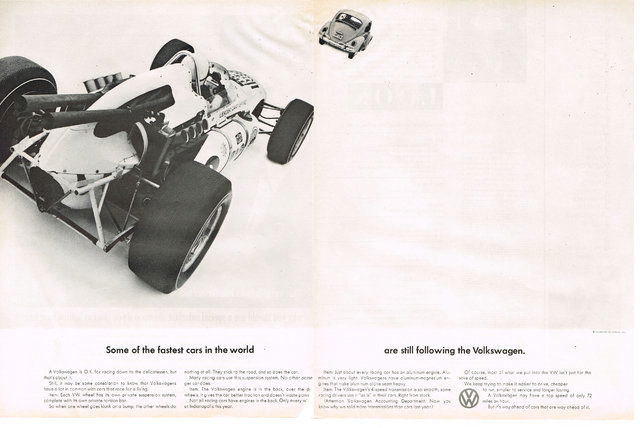
The Genius of Volkswagen’s “Still Following” Ad
This vintage Volkswagen ad turns simplicity into brilliance. The image shows a sleek Formula 1 car chasing a humble VW...

Why the VW Beetle Ad Still Captures Hearts Decades Later
This classic Volkswagen Beetle ad is a masterclass in confidence and simplicity. With a minimalist layout and a single sharp...
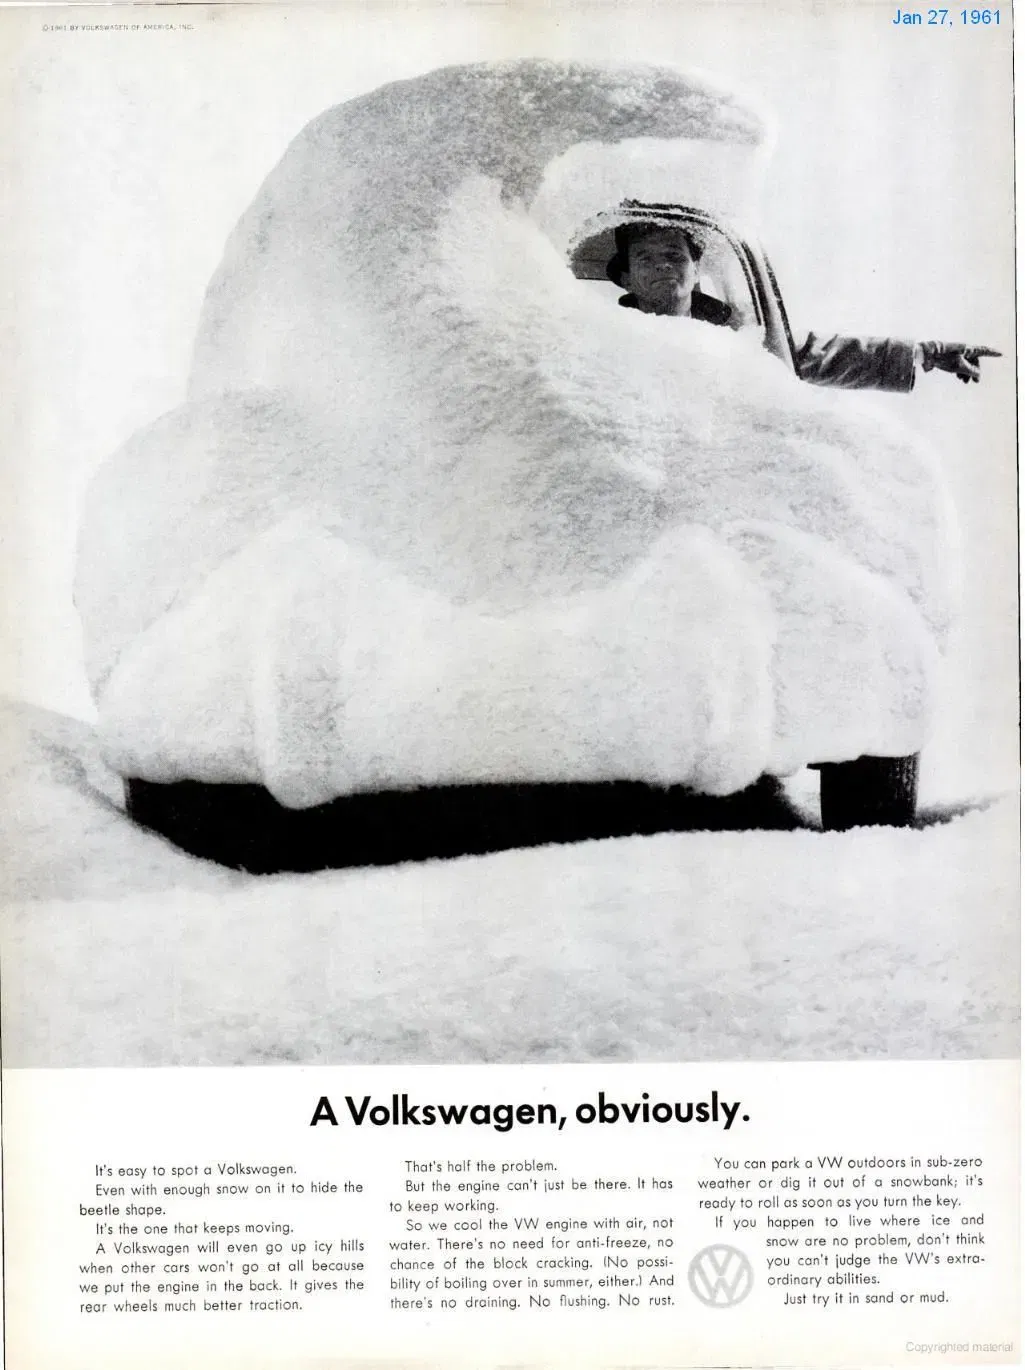
A Volkswagen, Obviously: Advertising That Makes You Feel Smart
This vintage Volkswagen ad from 1961 shows a car buried in snow — yet still instantly recognizable. It’s a masterclass...

The Shape of Things to Come: How VW Sold Simplicity
At first glance, this old Volkswagen ad looks almost empty—just a curvy black line and a few short paragraphs. But...

DeArrow's gif for "de-sensationalizing" YouTube Titles and Thumbnails
The image shows a split YouTube feed — the left half packed with over-the-top titles promising the impossible, and the...

The Odds of Where You’re Born
This simple world map breaks down the chances of being born on each continent. It’s a perspective-shifting look at global...

The Ad That Sold ‘No Change’ as an Upgrade
Volkswagen’s 1962 ad is a masterclass in reverse psychology and minimalist design. At first glance, it looks like a blank...
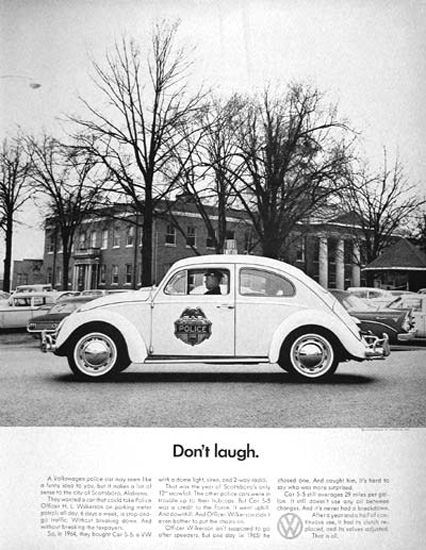
The Bold Simplicity Behind “Don’t Laugh”
This vintage Volkswagen ad flips expectations on their head. Featuring a VW Beetle dressed up as a police car, the...

Outdoor Advertising Is Making a Big Comeback
Outdoor advertising in the U.S. has quietly been making a huge comeback. The image shows a steady climb in market...

The Top Spotify Podcasts of 2025: What Dominated the Charts
This Spotify Wrapped list of 2025’s top global podcasts shows just how diverse listener tastes have become. From heavy-hitting interviews...

How Volkswagen Turned a Snowy Problem into an Ad Legend
This vintage Volkswagen ad nails clever storytelling with a simple question: how does the man who drives the snowplow get...

Why Ugmonk’s “This Is Analog” Ad Works
Ugmonk’s ad captures your attention by doing something paradoxical — selling simplicity in a digital world. The photo shows a...

Good Product + Distribution
This visual nails a truth every founder learns the hard way: growth isn’t just about having the best product. You...
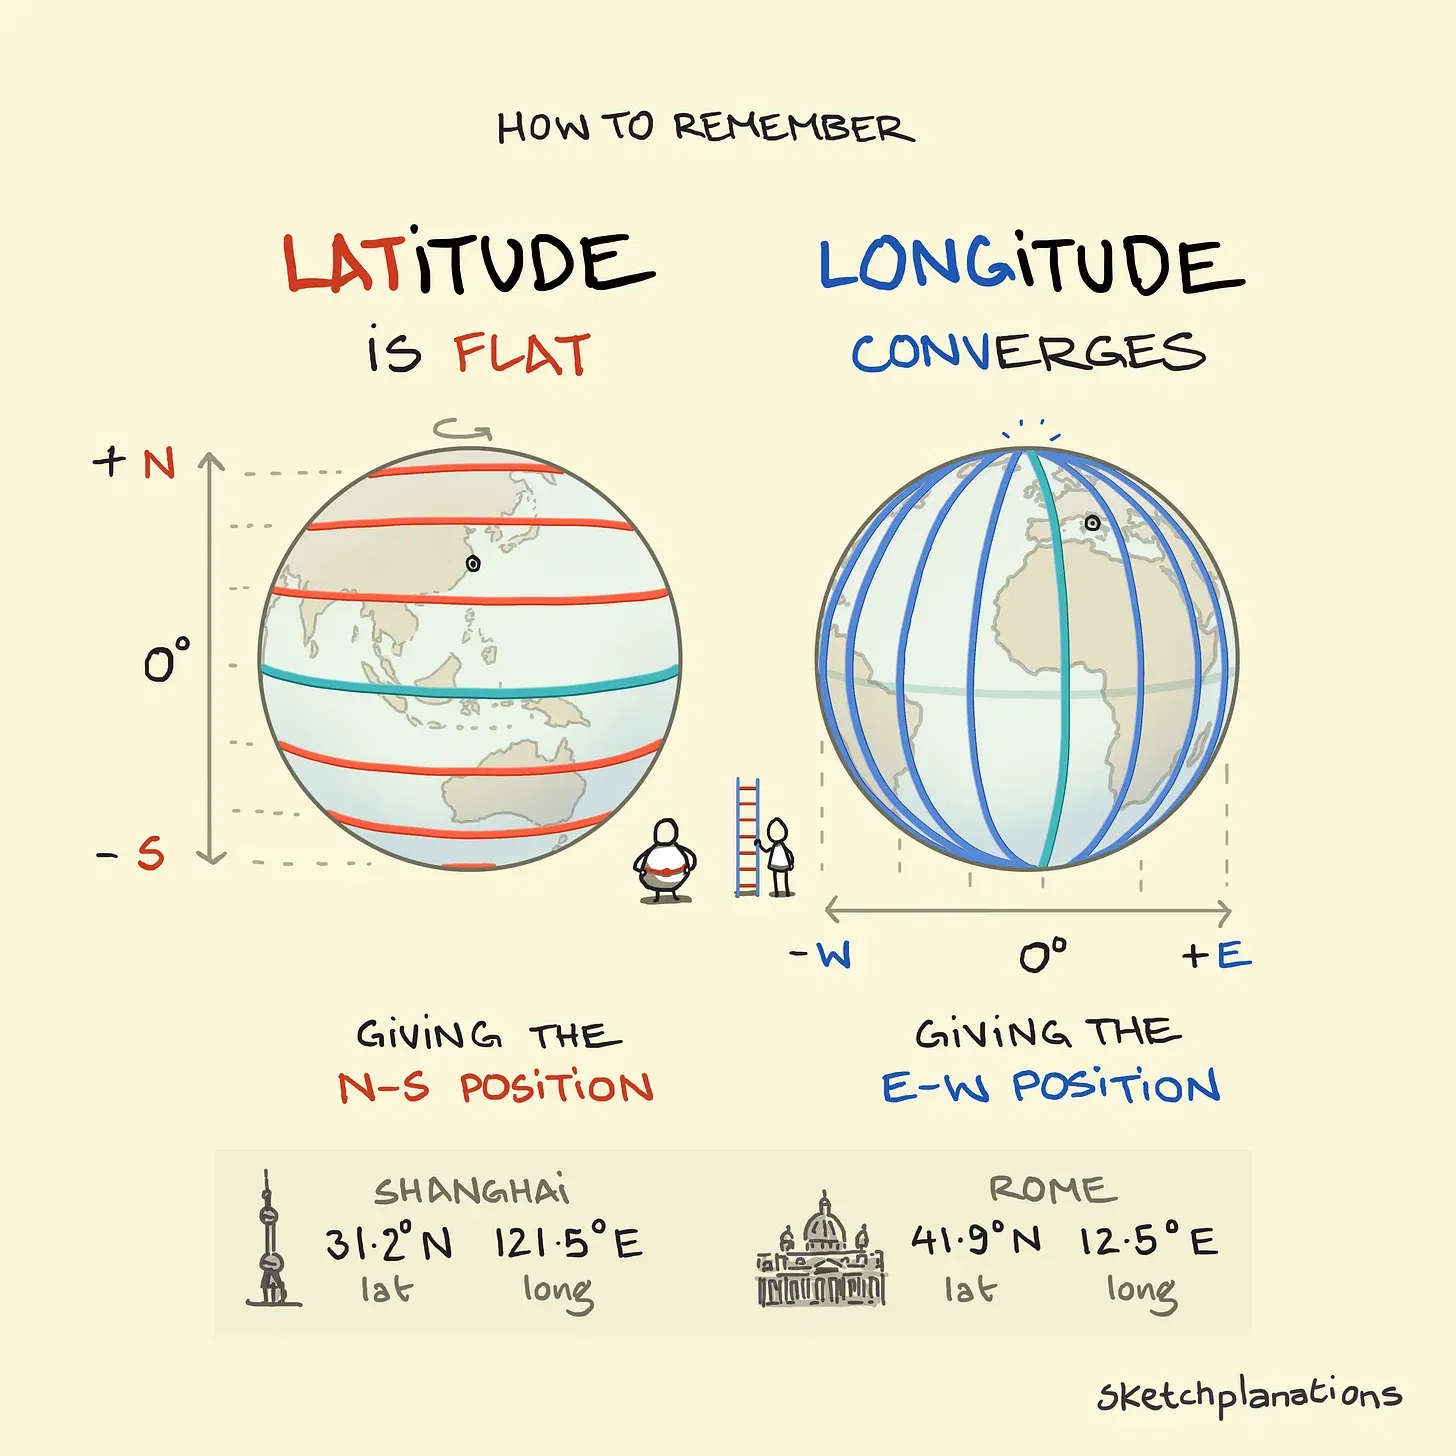
The Clever Trick to Remember Latitude vs. Longitude
Ever mix up latitude and longitude? This clever illustration breaks it down so simply you’ll never forget again. It uses...
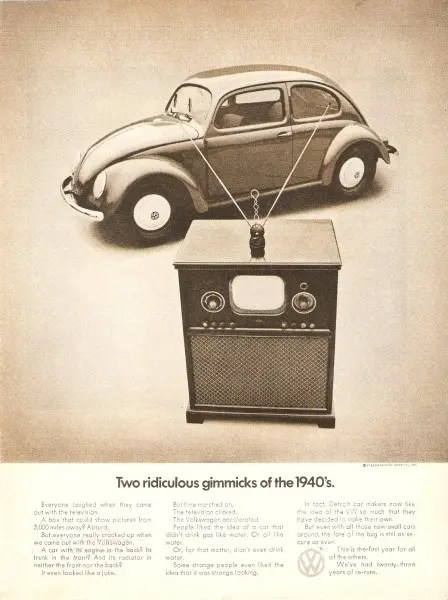
When “Ridiculous” Becomes Revolutionary
This classic Volkswagen ad flips skepticism into admiration. It pairs a Beetle with a 1940s television, mocking how both were...
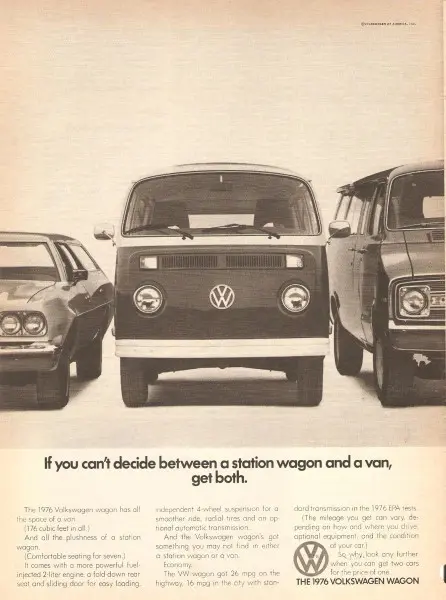
The Ad That Solved a Dilemma With One Line
Sometimes the best marketing move is to make a tough choice easier. This classic 1976 VW ad nails that. It...
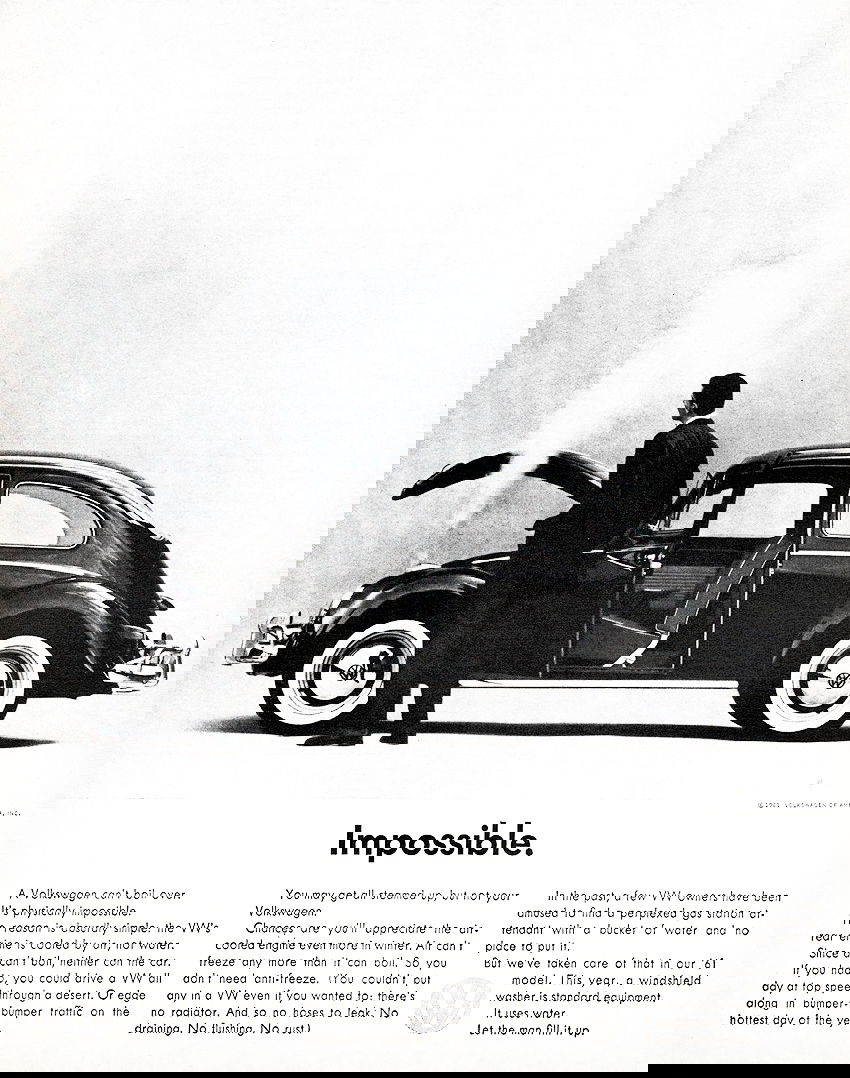
How a Blurry Volkswagen Ad Made Clarity the Star
This old Volkswagen ad looks glitched on purpose. The car and driver appear pixelated and smeared across the page. Weird?...
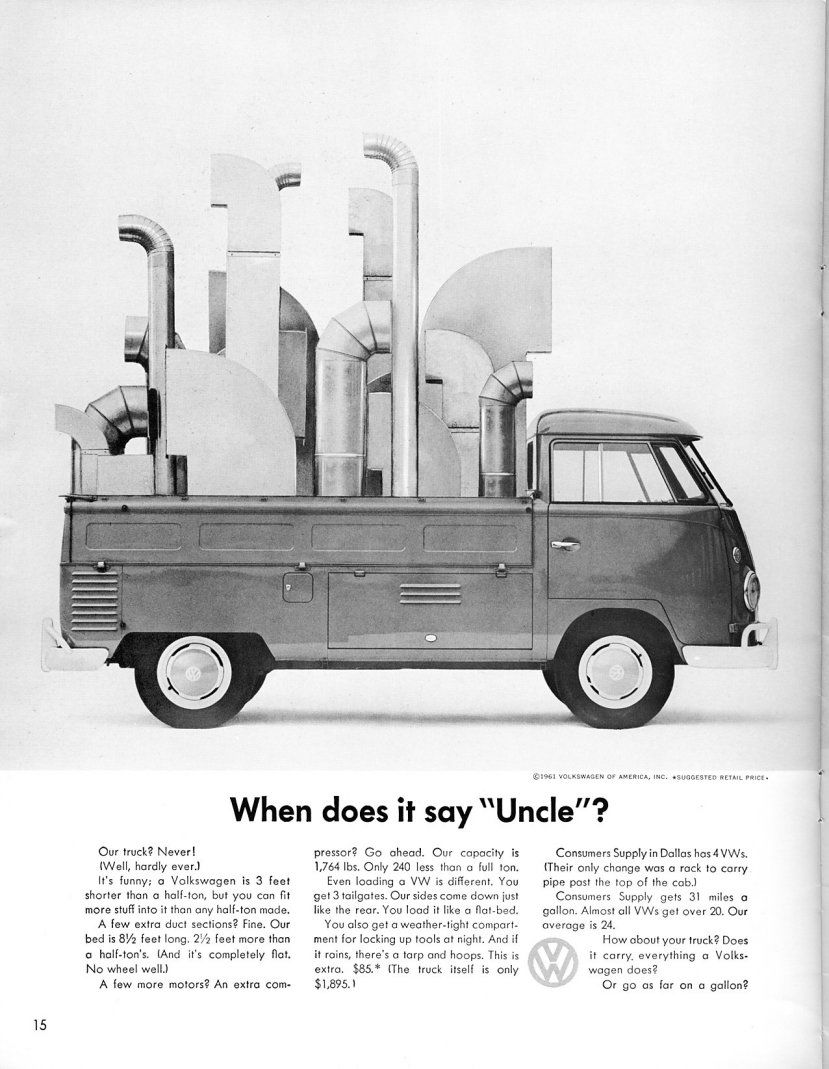
Volkswagen's “When does it say Uncle?” Ad
Volkswagen nailed it again with this minimalist, witty ad showing their truck loaded with an absurd amount of industrial pipes....
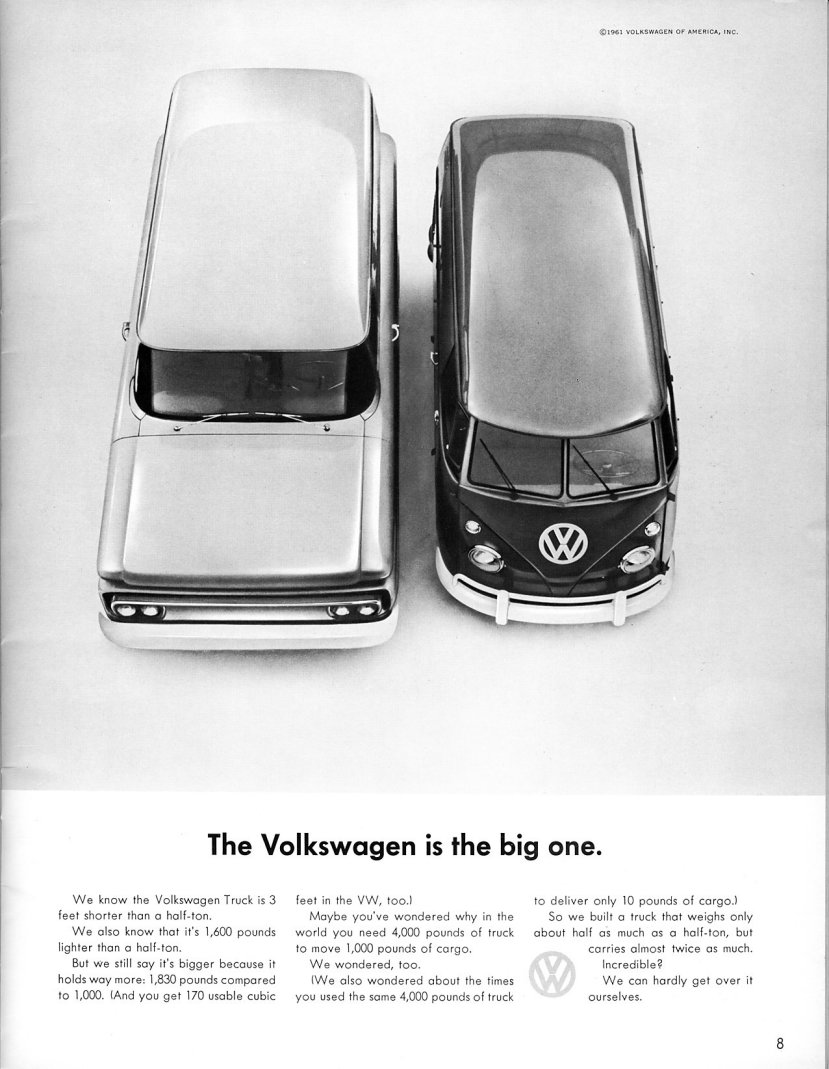
The Ad That Flipped “Big” On Its Head
This vintage Volkswagen ad is a masterclass in flipping assumptions. It juxtaposes two trucks from above: a bulky half-ton and...

The Ad That Turned “Uncool” Into a Sales Superpower
This 1960s Volkswagen ad looks simple—just a man peeking into a VW bus. But it’s a masterclass in flipping objections...

Big Scary Goals List Can Backfire
Ever make a giant list of goals and then immediately feel overwhelmed? This image nails that feeling. The towering, devil-horned...