Content Volume vs. Audience Growth Chart
Published on
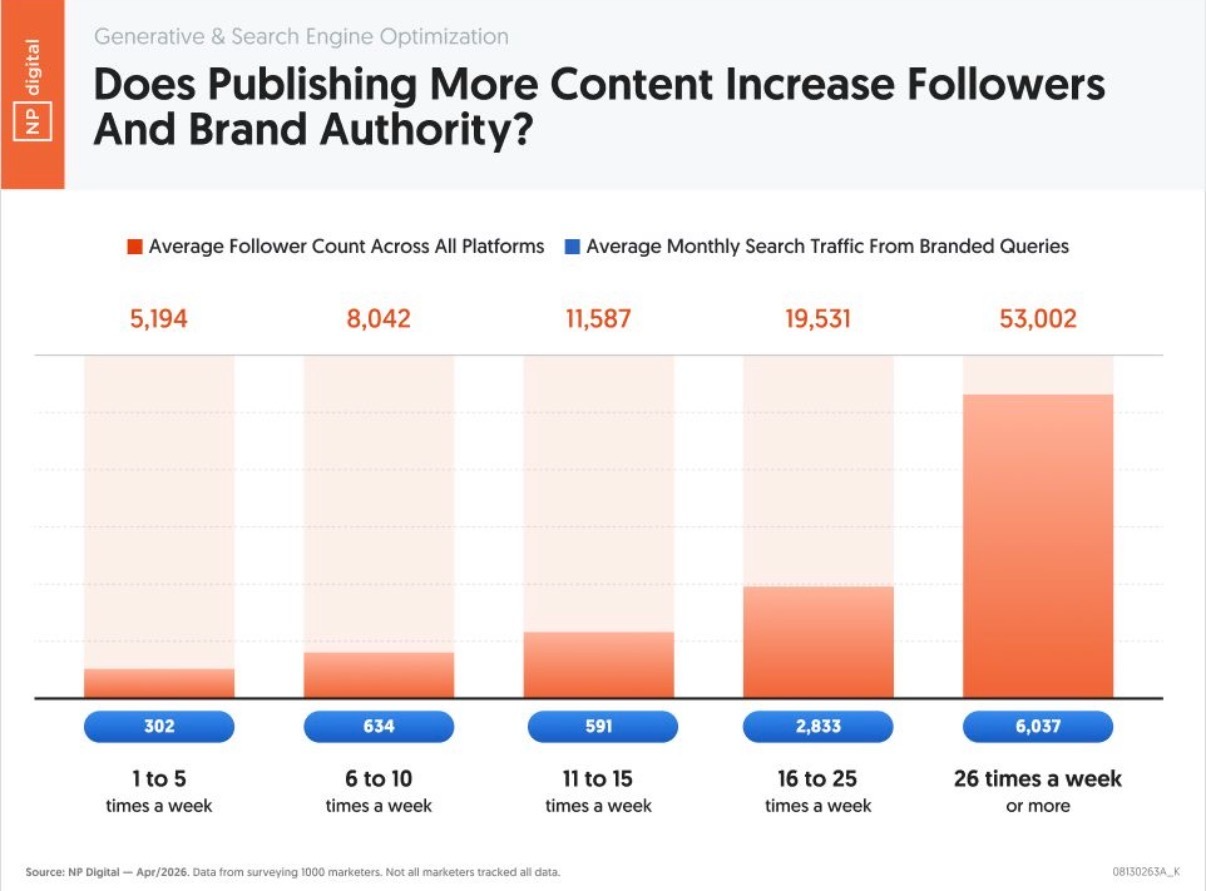
If you’re posting a couple times a week and wondering why growth is slow, this chart should scare you straight. It shows what happens when brands crank output from a casual trickle to 26+ posts every week. Follower counts don’t just rise…they spike. Branded search doesn’t just nudge up…it explodes. Let’s break down what this image is really screaming at you.
The 26+ Posts Per Week Jump
The bar chart compares brands by how often they publish each week. At 1–5 posts, the average follower count is 5,194. Bump that to 16–25 posts and it climbs to 19,531. But when companies cross the 26+ posts line, the average follower count rockets to 53,002. Same pattern with search: the highest publishing group more than doubles branded search traffic compared to the 16–25 posts group.
A Simple Posting Plan To Get To 26+
Repurpose instead of reinventing. One long-form piece becomes a blog post, 5–10 social snippets, 3 quote graphics, and 2 short videos. Rotate formats across platforms and schedule them in batches. You’re not writing 26 original essays every week—you’re slicing one solid idea into many small, fast hits. Do this for 90 days and the chart suggests your follower curve will look a lot less flat.
Why Aggressive Publishing Multiplies Followers
- Volume beats perfection: 26+ posts gives you far more chances to hit a nerve than polishing 2–3 masterpieces.
- Algorithm favoritism: platforms reward active accounts with more impressions, which compounds into more followers.
- Search dominance: each new post is another keyword hook; more hooks mean more branded queries and long‑tail traffic.
- Mindshare: showing up daily (often multiple times) keeps your brand top‑of‑mind instead of occasionally remembered.
Creative Variations
Analyzed by Swipebot
Loading analysis...