Double Down On 17–25 Social Time
Published on
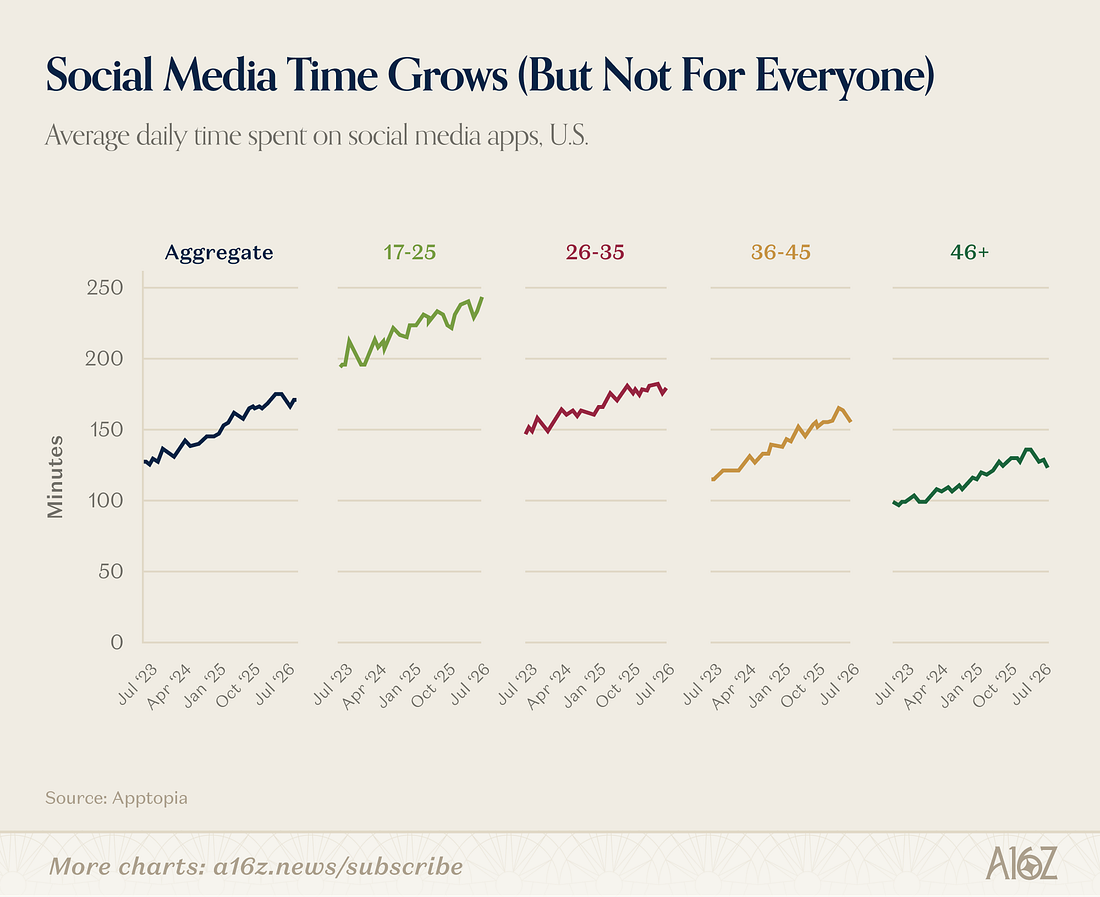
This chart quietly screams a big strategy shift: social media time is ballooning overall, but it’s not evenly spread. The 17–25 crowd is stacking serious minutes on social apps while other age groups creep up more slowly. If you’re marketing, building product, or just trying to hijack attention, this graph is basically telling you where the party actually is. Double down where the minutes are compounding.
Read The Graph Like A Growth Hacker
On the left, aggregate U.S. social time climbs from roughly two hours toward three. But the 17–25 panel shoots up fastest and stays high, meaning this group is living inside apps. The 26–35 and 36–45 lines rise, yet at a shallower slope. The 46+ line grows the slowest. Translation: the same ad dollar, post, or feature update buys more raw minutes of attention in the 17–25 bracket than almost anywhere else.
How To Double Down On 17–25 Social Time
- Build for habit loops: daily streaks, fast feedback, and reasons to check in multiple times per day.
- Ship native-first content: vertical video, remixable audio, and meme-ready visuals tailored to each platform.
- Treat older demos as profit, not growth: keep serving them, but test new ideas on 17–25 where behavior shifts first.
- Buy attention in off-peak hours: this cohort scrolls late night and between classes, when ad auctions are cheaper.
Brands Already Riding The 17–25 Wave
TikTok builds its entire product loop around the 17–25 attention spike, optimizing the For You feed for endless micro-dopamine hits.
Spotify leans into 17–25 behavior with collaborative playlists, social sharing, and campus-focused promos that turn listening into a group sport.
Discord captures 17–25 social time by making hanging out online always-on through servers, voice channels, and lightweight drop-in chats.
Creative Variations
Analyzed by Swipebot
Loading analysis...