Tesla Alumni Who Built $34B In Startups
Published on
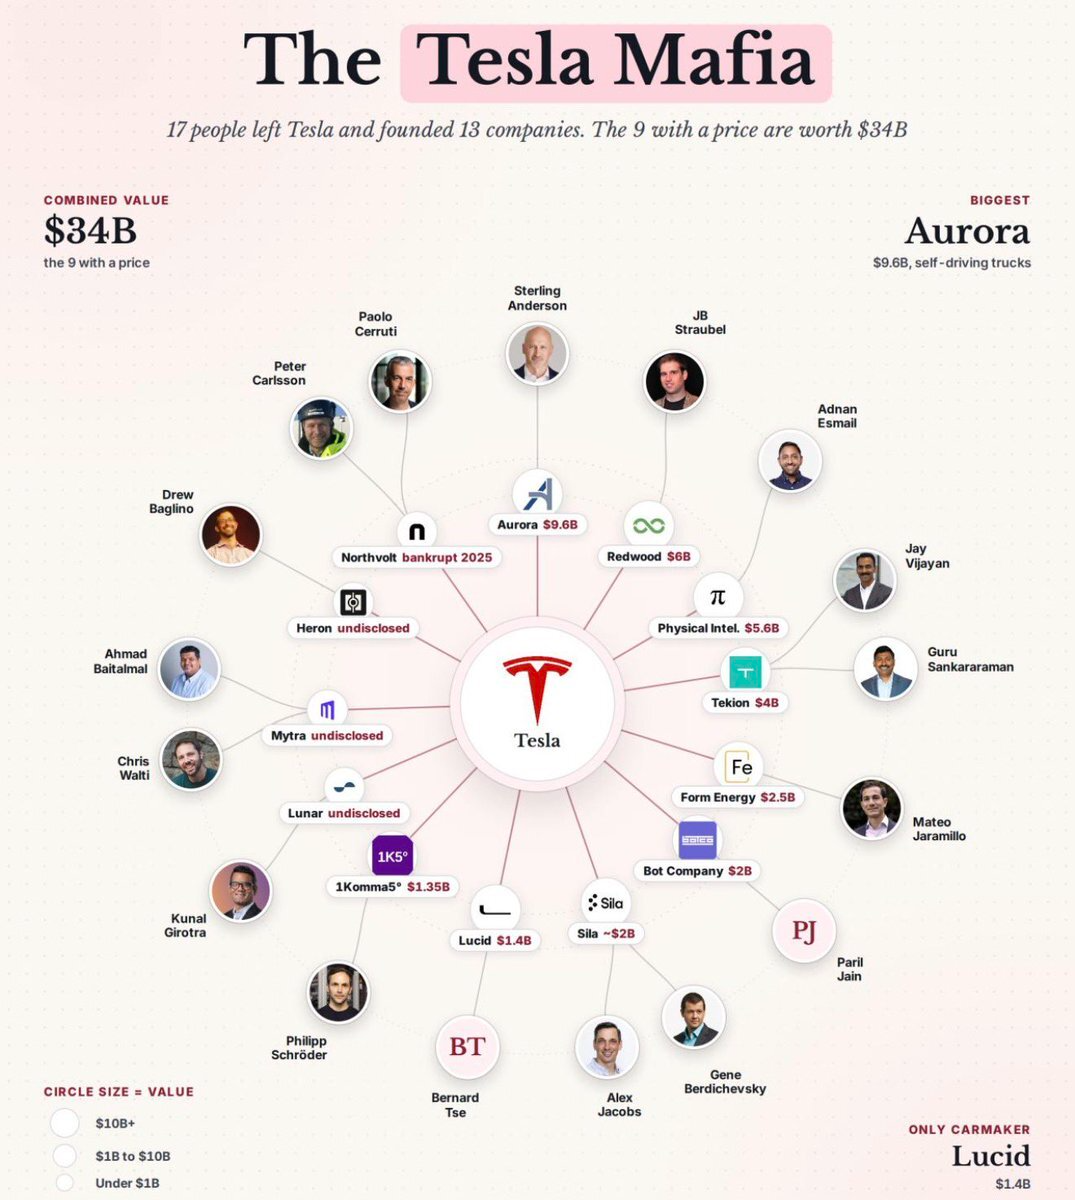
This Tesla Mafia chart is a masterclass in storytelling with one image. In a single glance, it shows how 17 ex-Tesla people spun out 13 companies worth a combined $34B. If you’re writing about alumni networks, founder pipelines, or startup ecosystems, this visual is your new swipe file. Let’s break down how this graphic sells the Tesla story without a single hypey sentence.
The psychology behind it
This image sells status by association. If Tesla alumni can go build Aurora, Redwood, Lucid, and a pile of multi‑billion‑dollar plays, then working at Tesla must be a golden ticket. It’s not just a valuation chart; it’s a recruiting ad, an investor confidence booster, and a brag sheet rolled into one. Any brand with a strong alumni base can riff on this: put your logo in the middle, show the offshoot wins, and let the viewer connect the dots about where the real leverage started.
Why this visual hits so hard
- The big Tesla logo at the center instantly frames the narrative: everything radiates from this one talent factory.
- Circular “orbit” layout makes each founder feel like a distinct planet, yet still part of the same universe.
- Dollar labels (Aurora $9.6B, Redwood $6B, Lucid $1.4B, etc.) turn vague success into concrete bragging rights.
- Subheads like “Combined value $34B” and “Only Carmaker: Lucid” act as built‑in tweetable stats.
- Circle size = value is a simple legend that turns design decoration into a data story you can understand in seconds.
How you can steal this for your brand

A SaaS company could map out its “founder alumni” in a similar hub‑and‑spoke chart, visually proving how ex‑employees went on to build funded startups.

A university could showcase its “university mafia” by putting the school crest in the center and plotting billion‑dollar alumni ventures around it with valuations and sectors.

An accelerator could create a portfolio graphic where its logo sits in the middle and each spoke highlights a breakout company, funding raised, and a tiny founder headshot.
Creative Variations
Analyzed by Swipebot
Loading analysis...